

Mutation in protein disulfide isomerase A3 causes neurodevelopmental defects by disturbing endoplasmic reticulum proteostasis
- PMID: 34904718
- PMCID: PMC8762563
- DOI: 10.15252/embj.2020105531
Mutation in protein disulfide isomerase A3 causes neurodevelopmental defects by disturbing endoplasmic reticulum proteostasis
Abstract
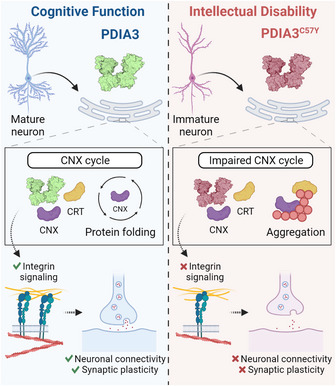
Recessive gene mutations underlie many developmental disorders and often lead to disabling neurological problems. Here, we report identification of a homozygous c.170G>A (p.Cys57Tyr or C57Y) mutation in the gene coding for protein disulfide isomerase A3 (PDIA3, also known as ERp57), an enzyme that catalyzes formation of disulfide bonds in the endoplasmic reticulum, to be associated with syndromic intellectual disability. Experiments in zebrafish embryos show that PDIA3C57Y expression is pathogenic and causes developmental defects such as axonal disorganization as well as skeletal abnormalities. Expression of PDIA3C57Y in the mouse hippocampus results in impaired synaptic plasticity and memory consolidation. Proteomic and functional analyses reveal that PDIA3C57Y expression leads to dysregulation of cell adhesion and actin cytoskeleton dynamics, associated with altered integrin biogenesis and reduced neuritogenesis. Biochemical studies show that PDIA3C57Y has decreased catalytic activity and forms disulfide-crosslinked aggregates that abnormally interact with chaperones in the endoplasmic reticulum. Thus, rare disease gene variant can provide insight into how perturbations of neuronal proteostasis can affect the function of the nervous system.
Keywords: actin cytoskeleton; cell adhesion; integrins; intellectual disability; protein disulfide isomerase.
© 2021 MRC Laboratory of Molecular Biology. Published under the terms of the CC BY 4.0 license.
Conflict of interest statement
The authors declare that they have no conflict of interest.
Figures
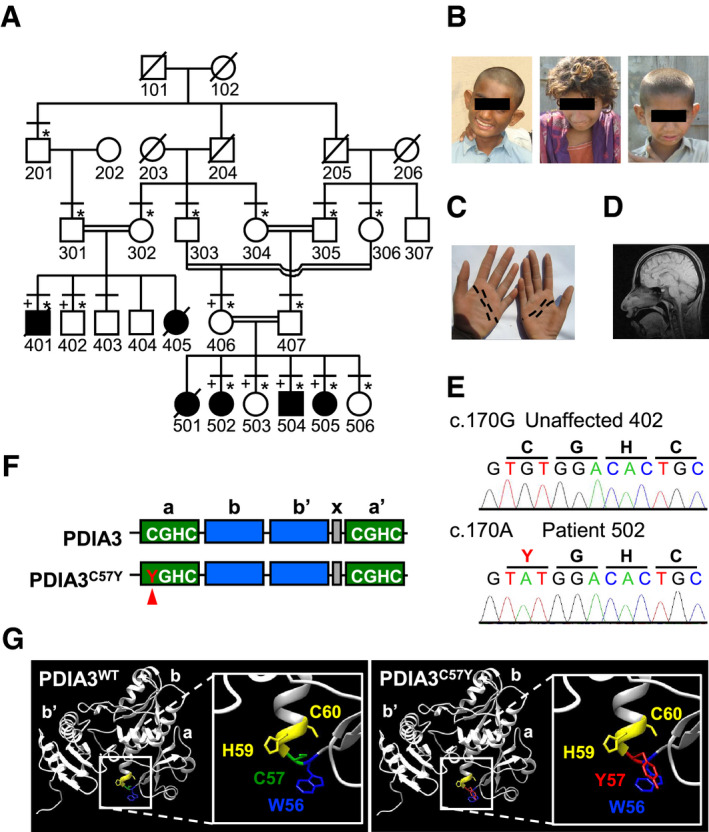
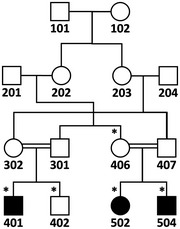
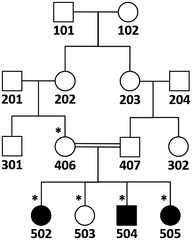
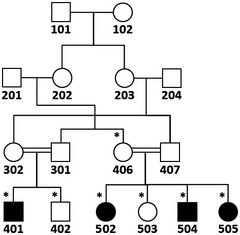
Family pedigree. Filled symbols indicate subjects suffering from severe intellectual disability with developmental impairment, crossed symbols deceased subjects, horizontal lines subjects physically examined, * subjects who participated in genetic studies, and + subjects with SNP genotype data.
Pictures of affected individuals showing mild facial dysmorphism such as protruding ears and broad nose. From left to right, subjects 401, 502, and 504.
Palmar creases of subject 502. Distal and proximal creases indicated by black dashed lines are normal while thenar and median creases are missing.
Cranial MRI of subject 502 showing no gross structural brain defects.
DNA sequence electropherograms showing the substitution c.170G>A (p.Cys57Tyr) in PDIA3.
Domain structure of PDIA3. Catalytic (a and a′, with active site motif CGHC) and non‐catalytic (b and b′) domains are shown in green and blue, respectively. The C57Y mutant is depicted, with Y57 indicated by a red arrowhead. The region shown in gray corresponds to the X‐linker between domains b′ and a′.
Structural modeling of substitution of cysteine‐57 with tyrosine in the N‐terminal PDIA3 active site.
- A–D
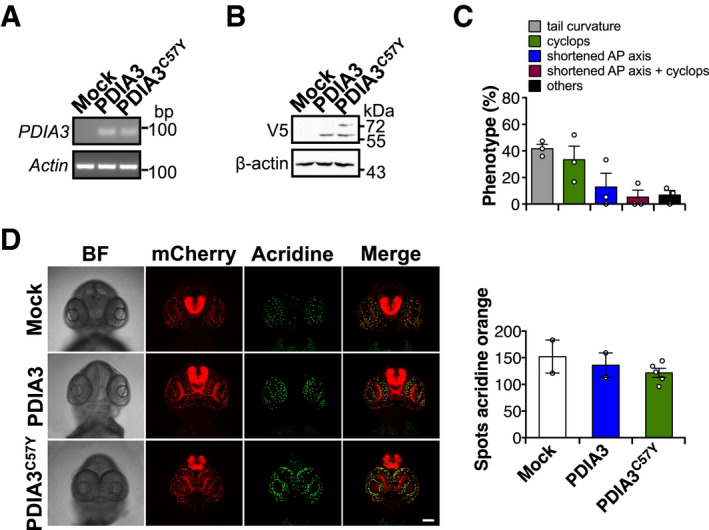
Zebrafish embryos at the one‐cell stage were injected with sense mRNA coding for wild‐type PDIA3‐V5 or PDIA3C57Y‐V5. (A) PDIA3 mRNA detection in embryos at 24 hpf by conventional PCR. Actin mRNA was employed as loading control. (B) PDIA3 protein levels at 24 hpf determined by Western blot analysis. β‐actin was employed as loading control. (C) Quantification of abnormal morphologies in embryos expressing PDIA3C57Y presented in Fig 2A. (D) Analysis of apoptosis in transgenic embryos with pan‐neuronal expression of mCherry in the central nervous system at 72 hpf. Acridine orange staining (Acridine) shown in green and mCherry in red. BF, bright field. Scale bar 100 μm. Graph shows quantification of acridine orange staining (number of positive spots). Mock, 2; PDIA3, 2; PDIA3C57Y, 5. Data are shown as mean ± s.e.m.
- A–D
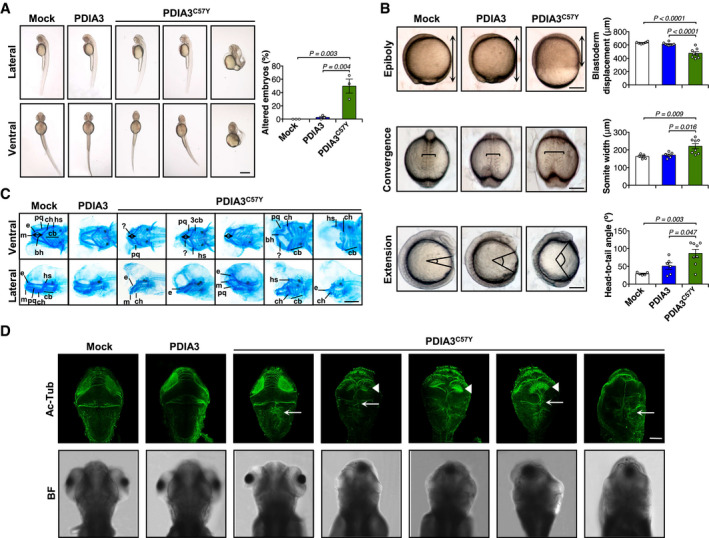
Zebrafish embryos were injected at the one‐cell stage with sense mRNA coding for either wild‐type PDIA3‐V5 or PDIA3C57Y‐V5. (A) Lateral and ventral micrographs of embryos at 48 h post‐fertilization (hpf) showing typical morphological alterations caused by PDIA3C57Y expression such as shortening of anterior–posterior axis, cyclopia, and tail curvature. Scale bar 500 μm. Mock, n = 125; PDIA3, n = 140; PDIA3C57Y, n = 239 embryos injected in three independent experiments. Graph shows quantification of percentage of embryos with altered morphology in each independent experiment. Data are shown as mean ± s.e.m. and statistical analysis performed using one‐way ANOVA with Tukey's post hoc test. (B) Cell movements during gastrulation. Upper panel: lateral micrographs of embryos undergoing epiboly at 9 hpf. Graph shows quantification of blastoderm displacement. Mock, n = 6; PDIA3, n = 8; PDIA3C57Y, n = 8. Middle panel: dorsal micrograph of embryos at 12.5 hpf showing convergence. Graph shows quantification of somite width. Mock, n = 5; PDIA3, n = 6; PDIA3C57Y, n = 8. Lower panel: lateral micrograph of embryos at 13 hpf showing extension. Graph shows quantification of head to tail angle. Mock, n = 5; PDIA3, n = 6; PDIA3C57Y, n = 8. Scale bar 200 μm. Data are shown as mean ± s.e.m. and statistical analysis performed using one‐way ANOVA with Tukey's post hoc test. (C) Alcian blue staining of cartilage showing craniofacial features of embryos at 6 days post‐fertilization (dpf). Embryos expressing PDIA3C57Y show reduced distance between Meckel's (m) and ceratohyal (ch) cartilages (double‐headed arrow), kinked palatoquadrate (pq), and additional unidentified pieces of cartilages (?). e, ethmoid plate; bh, basihyal; hs, hyosymplectic; cb, ceratobranchials. Scale bar 200 μm. Mock, n = 6; PDIA3, n = 5; PDIA3C57Y, n = 15. (D) Representative micrographs of acetylated‐tubulin (Ac‐Tub) indirect immunofluorescence in dorsal views of embryos at 96 hpf. White arrowheads and arrows in embryos expressing PDIA3C57Y point to the abnormal organization of axonal tracts in the optic tectum and the fused axons at the dorsal midline of the hindbrain, respectively. BF, bright field. Scale bar 100 μm. Mock, n = 3; PDIA3, n = 3; PDIA3C57Y, n = 11.
- A
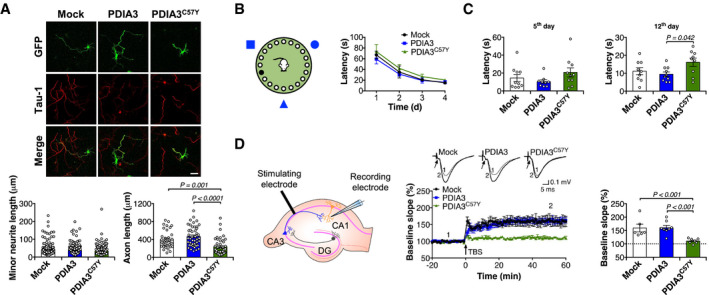
Primary culture of mouse hippocampal neurons was co‐transfected with constructs for transient expression of wild‐type PDIA3‐V5 or PDIA3C57Y‐V5, or empty vector (Mock), and GFP. Representative micrographs of GFP and indirect immunofluorescence of Tau‐1 to visualize axons at day 3 in vitro. Scale bar 50 μm. Left graph shows quantification of minor neurite length; Mock, n = 175; PDIA3, n = 204; PDIA3C57Y, n = 191 cells quantified in three independent experiments. Right graph shows quantification of axon length; Mock, n = 35; PDIA3, n = 46; PDIA3C57Y, n = 43 cells quantified in three independent experiments. Data are shown as mean ± s.e.m. and statistical analysis performed using Kruskal–Wallis with Dunn's post hoc test.
- B–D
Young mice at P55 received bilateral stereotaxis injection of adeno‐associated virus serotype 9 (AAV9) to express wild‐type PDIA3‐V5 or PDIA3C57Y‐V5 and GFP or GFP alone (Mock) into the hippocampus for behavioral and electrophysiological analysis. (B) Barnes maze test: mice were placed in a circular arena with 20 holes on the edge and visual cues on the surrounding walls (scheme to the left). The time spent to find the target hole was recorded as latency. The latency from days 1 to 4 is plotted as learning curve (graph to the right); Mock, n = 10; PDIA3, n = 10; PDIA3C57Y, n = 10. Data are shown as mean ± s.e.m. (C) Latency at day 5 is measured as short‐term memory; Mock, n = 10; PDIA3, n = 9; PDIA3C57Y, n = 10. Latency at day 12 is measured as long‐term memory; Mock, n = 9; PDIA3, n = 10; PDIA3C57Y, n = 9. Data are shown as mean ± s.e.m. and statistical analysis performed using one‐way ANOVA with Tukey's post hoc test. (D) Field excitatory postsynaptic potentials (fEPSPs) were recorded in the stratum radiatum of the CA1 region after stimulation of Schaeffer collateral commissural fibers projecting from CA3 as indicated in the scheme. DG, dentate gyrus. After fEPSP baseline acquisition, long‐term potentiation (LTP) was induced by theta burst stimulation (TBS). Left graph: time course of TBS‐induced LTP in Mock, PDIA3, and PDIA3C57Y mice. Arrow indicates TBS. Inset: representative recordings averaging 10 traces at −10 min (Pre‐TBS, indicated as time “1”) and 50 min (Post‐TBS, indicated as time “2”). Arrow: presynaptic volley. Right graph: LTP quantification during the final 20 min of the recording, presented as the averaged percentage of baseline. Mock, n = 5, 6; PDIA3, n = 7, 8; PDIA3C57Y, n = 5, 7 for number of animals and recorded slices, respectively. Data are shown as mean ± s.e.m. and statistical analysis performed using Wilcoxon–Mann–Whitney two‐sample rank test.
- A–D
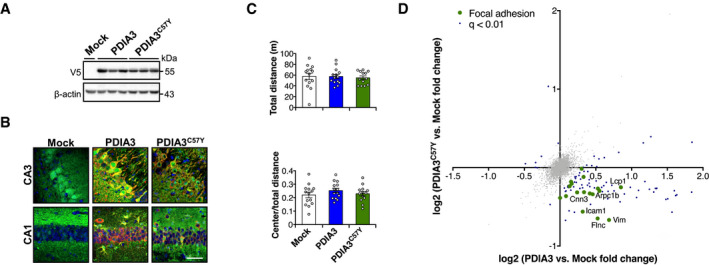
Young mice at P55 received bilateral stereotaxis injection of adeno‐associated virus serotype 9 (AAV9) to express wild‐type PDIA3‐V5 or PDIA3C57Y‐V5 and GFP or GFP alone (Mock) into the hippocampus for behavioral and proteomic analysis. (A) PDIA3 protein levels in hippocampus at P180 detected by Western blot analysis. β‐actin employed as loading control. (B) Representative micrographs of hippocampus analyzed by immunofluorescence to GFP (green) and V5 (red) at P180 showing neuronal transduction in CA3 and CA1 regions. Nucleus stained with Hoechst (blue). Scale bar 50 μm. (C) Open field. Mice were placed in a squared arena and recorded for 15 min. Total distance (upper graph) and center to total distance ratio (lower graph) were measured as locomotor activity and exploratory behavior, respectively. Mock, n = 14; PDIA3, n = 14; PDIA3C57Y, n = 13. Data are shown as mean ± s.e.m. and statistical analysis performed using one‐way ANOVA with Tukey's post hoc test. No statistically significant differences exist between groups. (D) Proteomic analysis at P180. Mock, n = 3; PDIA3, n = 3; PDIA3C57Y, n = 4. Scatter plot of proteomic analysis of hippocampus tissue of mice expressing wild‐type PDIA3 or PDIA3C57Y. The x‐axis denotes logarithmic fold change in total protein levels in wild‐type PDIA3 mice relative to Mock littermates. The y‐axis denotes logarithmic fold change in total protein levels in PDIA3C57Y mice relative to Mock littermates. Representative hits of focal adhesion are highlighted in green.
- A–D
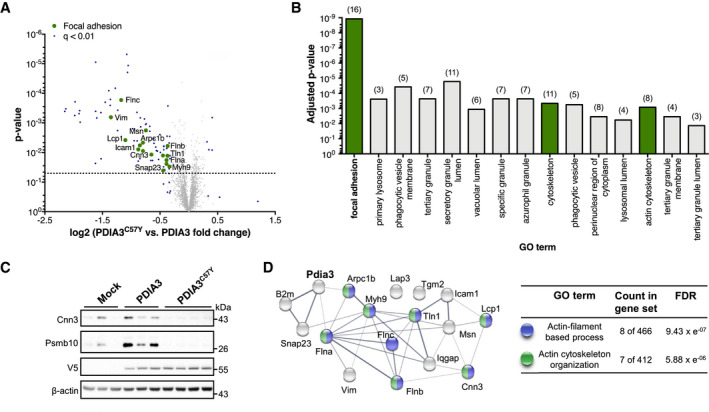
Young mice at P55 received bilateral stereotaxic injection of adeno‐associated virus serotype 9 (AAV9) to express wild‐type PDIA3‐V5 or PDIA3C57Y‐V5 and GFP or GFP alone (Mock) into the hippocampus for proteomic analysis. (A) Volcano plot of proteomic analysis of hippocampus tissue of mice expressing wild‐type PDIA3 or PDIA3C57Y. The x‐axis denotes logarithmic fold change of total protein levels in PDIA3C57Y relative to wild‐type PDIA3 mice. The y‐axis denotes the P‐value of statistical analysis. Dotted line indicates threshold for statistical significance. Statistical analysis performed using two‐tailed Student's t‐test with 95% confidence interval. PDIA3, n = 3; PDIA3C57Y, n = 4. (B) Functional categorization of proteomic hits according to the Gene Ontology (GO) annotation. Graph shows significantly enriched GO terms of cellular component comparing wild‐type PDIA3 to PDIA3C57Y mice. The number of genes associated with each term is indicated in parenthesis. Focal adhesion hits are highlighted in green in the volcano plot presented in A. (C) Western blot validation of the total protein levels of the proteomic hits Calponin‐3 (Cnn3) and Proteasome subunit beta type‐10 (Psmb10; see Dataset EV4). V5 and β‐actin were employed as loading control. (D) Network analysis of Pdia3 interaction with identified genes related to focal adhesion as presented in A and B (see Dataset EV5). The nodes represent the proteins and the edges interactions. The thickness of the edges indicates the extent of interactions, which not necessarily mean physical binding. The table shows GO annotation of biological function of network components. FDR, false discovery rate.
- A
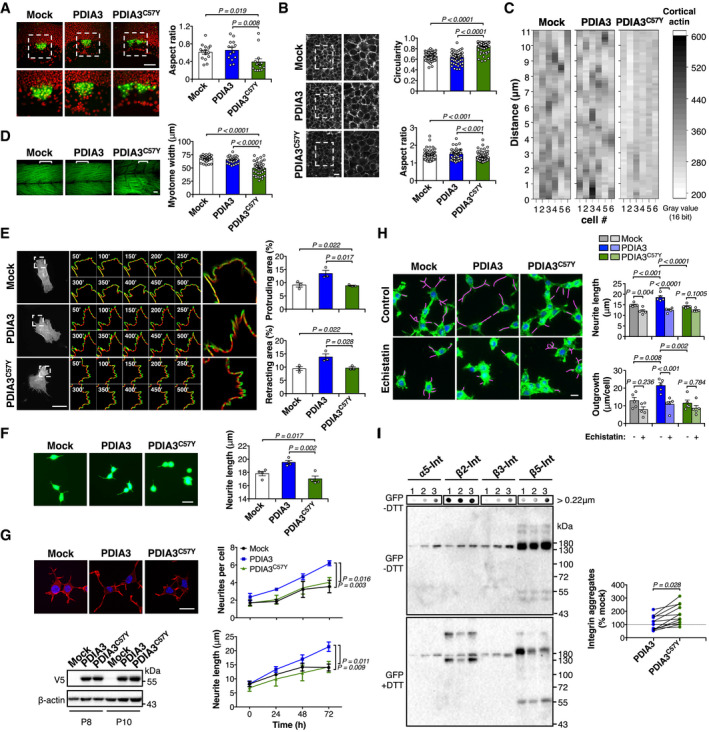
Transgenic zebrafish embryos expressing GFP in dorsal forerunner cells (DFC), Tg(sox17:GFP), were injected at the one‐cell stage with sense mRNA coding for either wild‐type PDIA3‐V5 or PDIA3C57Y‐V5. Fluorescence micrographs of DFC from dorsal views obtained at 8 hpf. Nuclei depicted in red. Right images are digital magnifications of areas delimited by white dashed squares. Scale bar 100 μm. Graph shows quantification of aspect ratio of the DFC cluster. Mock, n = 15; PDIA3, n = 14; PDIA3C57Y, n = 14. Data are shown as mean ± s.e.m. and statistical analysis performed using Kruskal–Wallis with Dunn's post hoc test.
- B, C
Transgenic zebrafish embryos ubiquitously expressing the mCherry‐tagged actin binding domain of utrophin, Tg(actb1:mCherry‐utrCH), were injected at the one‐cell stage with sense mRNA coding for either wild‐type PDIA3‐V5 or PDIA3C57Y‐V5. (B) Fluorescence micrographs of deep cells from the animal pole obtained at 8 hpf. Right images are digital magnifications of areas delimited by white dashed squares. Scale bar 20 μm. Graphs show quantification of cell circularity and aspect ratio. Mock, n = 55; PDIA3, n = 57; PDIA3C57Y, n = 84 cells quantified from at least three embryos per group. Data are shown as mean ± s.e.m. and statistical analysis performed using Mann–Whitney test. (C) Heatmap of fluorescence intensity of mCherry along the cortex of individual deep cells.
- D
Phalloidin staining of skeletal muscle of embryos at 48 hpf. Embryos expressing PDIA3C57Y show decreased myotome width and disorganized muscle fibers. Scale bar 20 μm. Graph shows quantification of myotome width. Mock, n = 40; PDIA3, n = 28; PDIA3C57Y, n = 40 myotomes quantified from at least five embryos. Data are shown as mean ± s.e.m. and statistical analysis performed using one‐way ANOVA with Tukey's post hoc test.
- E
Mouse embryonic fibroblast knock‐out for Pdia3 (MEF Pdia3 KO) was co‐transfected with constructs for expression of wild‐type PDIA3‐V5 or PDIA3C57Y‐V5, or empty vector (Mock), and EGFP‐LifeAct. Representative micrographs of live cell imaging performed at 48 h after transfection are shown. Segmentation of time‐lapse images was used to obtain protruding (green) and retracting (red) areas. Zoom of representative cell areas is shown. Protruding and retracting area was quantified using Fiji software. Scale bar 50 μm. n = 3 independent experiments. A total of 10 movies per group with 1 or 2 cells per movie were quantified. Data are shown as mean ± s.e.m. and statistical analysis performed using one‐way ANOVA with Tukey's post hoc test.
- F
NSC‐34 cells cotransfected with constructs for transient expression of wild‐type PDIA3‐V5 or PDIA3C57Y‐V5, or empty vector (Mock), and GFP were differentiated and neurite length measured at 48 h. Scale bar 20 μm. n = 4 independent experiments. Total cells quantified: Mock, 200; PDIA3, 157; PDIA3C57Y, 145. Data are shown as mean ± s.e.m. and statistical analysis performed using one‐way ANOVA with Tukey's post hoc test.
- G
NSC‐34 neuronal cell lines stably expressing wild‐type PDIA3‐V5 or PDIA3C57Y‐V5, or empty vector (Mock) were differentiated for 72 h and neurite number and length determined over time by high‐content analysis of cells stained with phalloidin. Scale bar 20 μm. n = 3 independent experiments. Total cells quantified: Mock, 343; PDIA3, 388; PDIA3C57Y, 495. Data are shown as mean ± s.e.m. and statistical analysis performed using two‐way ANOVA with Tukey's post hoc test. Western blot analysis of PDIA3 levels in NSC‐34 cell lines employed for the differentiation assay at different passages (P) after initial transfection. β‐actin employed as loading control.
- H
NSC‐34 neuronal cell lines stably expressing wild‐type PDIA3‐V5 or PDIA3C57Y‐V5, or empty vector (Mock) were differentiated for 24 h and treated with 40 nM Echistatin to inhibit integrin signaling. The cells were collected at 72 h of differentiation, stained with phalloidin‐FITC, and scanned by automated microscopy for analysis of neurite length and outgrowth. Magenta traces mark neurite extension. Scale bar 30 μm. n = 5 independent experiments with at least 96 neurites quantified per group in each experiment. Data are shown as mean ± s.e.m. and statistical analysis performed using one‐way ANOVA with Sidak's post hoc test.
- I
Western blot and filter‐trap analysis of a panel of integrin paralogs in stable NSC‐34 cell lines overexpressing PDIA3 or PDIA3C57Y, or mock control. The cells were transfected with constructs for overexpression of α5‐integrin (α5‐int) fused to GFP, β2‐integrin (β2‐int) fused to YFP, β3‐integrin (β3‐int) fused to YFP, and β5‐integrin (β5‐int) fused to 2xGFP and analyzed under non‐reducing (−DTT, dithiothreitol) or reducing conditions (+DTT). The anti‐GFP antibody detects both GFP and YFP tags. 1, Mock, 2, PDIA3‐V5, and 3, PDIA3C57Y‐V5. Representative image of three independent experiments. The graph shows quantification of integrin aggregates relative to mock control detected under non‐reducing conditions. Lines connect aggregates quantified in the same experiment. Aggregates from different integrin paralogs were pooled in the statistical analysis using two‐tailed Student's t‐test. Figure EV3C shows quantification of aggregates from each integrin paralog separately.
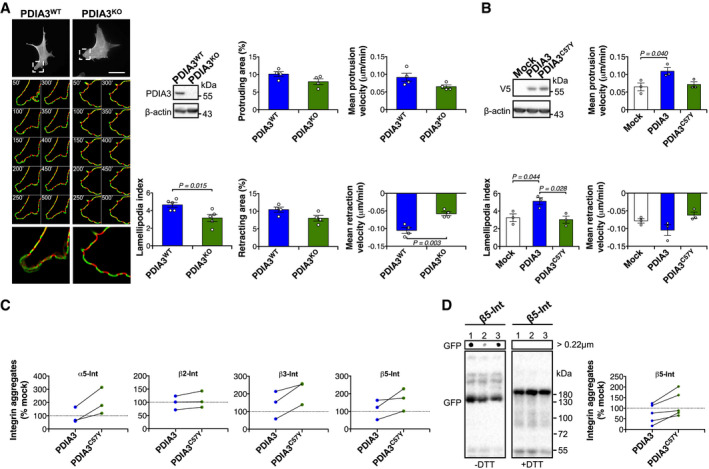
Mouse embryonic fibroblast (MEF) knock‐out for Pdia3 (Pdia3 KO) and wild‐type MEF (Pdia3 WT) were transfected with construct for expression of EGFP‐LifeAct. Representative micrographs of live cell imaging performed at 48 h after transfection are shown. Segmentation of time‐lapse images was used to obtain protruding (green) and retracting (red) areas. Zoom of representative cell areas is shown. Lamellipodia number and protrusion/retraction movement were quantified using Fiji software. Scale bar 50 μm. n = 4 independent experiments. A total of 9 movies per group with 1 or 2 cells per movie were quantified. Data are shown as mean ± s.e.m. and statistical analysis performed using two‐tailed Student's t‐test. Pdia3 KO MEF was checked by Western blot analysis. β‐actin was employed as loading control.
Pdia3 KO MEF was co‐transfected with constructs for expression of wild‐type PDIA3‐V5 or PDIA3C57Y‐V5, or empty vector (Mock), and EGFP‐LifeAct. n = 3 independent experiments. A total of 10 movies per group with 1 or 2 cells per movie were quantified. Graphs show quantification of lamellipodia number and protruding/retracting velocity. Data are shown as mean ± s.e.m. and statistical analysis performed using one‐way ANOVA with Tukey's post hoc test. Wild‐type PDIA3‐V5 or PDIA3C57Y‐V5 levels were checked by Western blot analysis. β‐actin was employed as loading control.
NSC‐34 neuronal cell lines stably expressing wild‐type PDIA3‐V5 or PDIA3C57Y‐V5, or empty vector (Mock) were transfected with constructs for overexpression of α5‐integrin (α5‐int) fused to GFP, β2‐integrin (β2‐int) fused to YFP, β3‐integrin (β3‐int) fused to YFP, and β5‐integrin (β5‐int) fused to 2xGFP and analyzed by filter trap under non‐reducing (−DTT, dithiothreitol) or reducing (+DTT) conditions as described in Fig 5I. The graphs show quantification of aggregates of each integrin paralog relative to mock control detected under non‐reducing conditions. Lines connect aggregates quantified in the same experiment. n = 3 independent experiments.
Pdia3 KO MEF was co‐transfected with constructs for expression of wild‐type PDIA3‐V5 or PDIA3C57Y‐V5, or empty vector (Mock), and β5‐integrin (β5‐int) fused to 2xGFP and analyzed by Western blot and filter‐trap under non‐reducing (−DTT, dithiothreitol) or reducing (+DTT) conditions. 1, Mock, 2, PDIA3‐V5, and 3, PDIA3C57Y‐V5. Representative image of five independent experiments. The graph shows quantification of integrin aggregates relative to mock control detected under non‐reducing conditions. Lines connect aggregates quantification in the same experiment.
- A
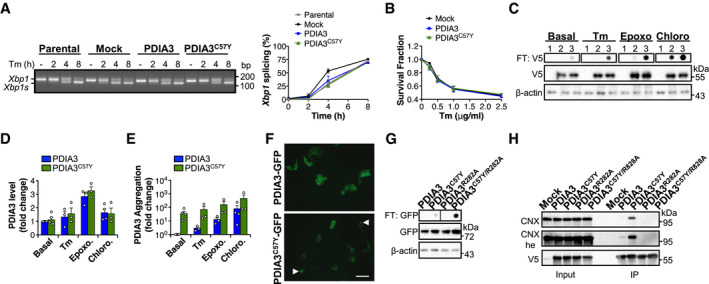
Kinetics of unfolded protein response activation measured by splicing of X‐box binding protein 1 (Xbp1) mRNA in NSC‐34 cell lines stably expressing wild‐type PDIA3‐V5 or PDIA3C57Y‐V5, or empty vector (Mock) treated with 1 μg/ml of the ER stressor tunicamycin (Tm). Xbp1s, spliced form of Xbp1 mRNA. Parental, non‐transfected NSC‐34. Graph shows quantification of percentage of Xbp1 mRNA splicing in three independent experiments. Data are shown as mean ± s.e.m.
- B
NSC‐34 cells were transfected with constructs for transient expression of wild‐type PDIA3‐V5 or PDIA3C57Y‐V5, or empty vector (Mock). Viability was determined after treatment with the indicated dose of Tm for 24 h in three independent experiments. Data are shown as mean ± s.e.m.
- C–E
NSC‐34 cells were transfected with constructs for transient expression of wild‐type PDIA3‐V5 or PDIA3C57Y‐V5, or empty vector (Mock). (C) Filter‐trap analysis of PDIA3‐V5 aggregates under non‐reducing conditions at 24 h after treatment with Tm (1 μg/ml), the proteasome inhibitor epoxomicin (Epoxo, 250 nM), or the lysosome inhibitor chloroquine (Chloro, 30 μM). β‐actin was employed as loading control. 1, Mock, 2, PDIA3‐V5, and 3, PDIA3C57Y‐V5. Representative image of three independent experiments. (D) Quantification of total levels of PDIA3 by Western blot under different stress conditions. PDIA3 levels expressed as fold change relative to the wild‐type protein under basal condition. Data are shown as mean ± s.e.m. (E) Quantification of PDIA3 aggregates by filter trap under different stress conditions. PDIA3 aggregates levels expressed as fold change relative to the wild‐type protein under basal condition. Data are shown as mean ± s.e.m.
- F
NSC‐34 cells were transfected with constructs for transient expression of wild‐type PDIA3‐GFP or PDIA3C57Y‐GFP. Fluorescence micrographs show live cells at 48 h after transfection. Arrowheads point to puncta of PDIA3C57Y‐GFP. Scale bar 50 μm. The image is representative of a single experiment performed for construct validation.
- G
NSC‐34 cells were transfected with constructs for transient expression of wild‐type PDIA3‐GFP, PDIA3C57Y‐GFP, PDIA3R282A‐GFP, or PDIA3C57Y/R282A‐GFP. Filter‐trap analysis under non‐reducing conditions was performed at 48 h after transfection. β‐actin was employed as loading control. The image is representative of a single experiment performed for construct validation.
- H
HEK cell line was transfected with constructs for transient expression of wild‐type PDIA3‐V5, PDIA3C57Y‐V5, PDIA3R282A‐V5, or PDIA3C57Y/R282A‐V5, or empty vector (Mock). Immunoprecipitation of V5‐tag was carried out at 48 h after transfection and PDIA3 interaction with calnexin (CNX) measured by Western blot; he, high exposure. The image is representative of a single experiment performed for construct validation.
- A, B
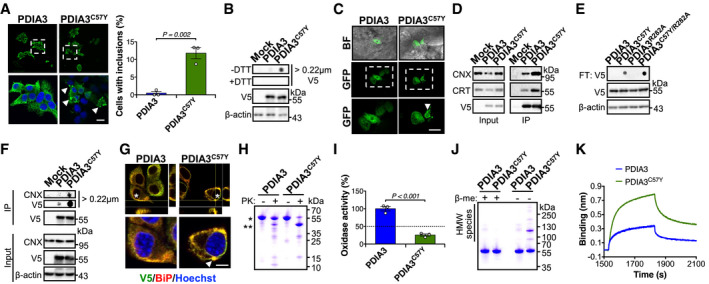
NSC‐34 cells were transfected with constructs for expression of wild‐type PDIA3‐V5 or PDIA3C57Y‐V5, or empty vector (Mock). (A) Fluorescence micrographs of V5 immunostaining at 48 h after transfection. Bottom images are digital magnifications of areas delimited by white dashed squares. Arrowheads point to PDIA3C57Y‐V5 puncta. Scale bar 15 μm. Graph shows quantification of percentage of cells containing PDIA3 puncta. n = 3 independent experiments. Total cells quantified: PDIA3, 365; PDIA3C57Y, 301. Data are shown as mean ± s.e.m. and statistical analysis performed using two‐tailed Student's t‐test. (B) Filter‐trap analysis of PDIA3‐V5 aggregates under non‐reducing (−DTT, dithiothreitol) and reducing (+DTT) conditions at 48 h after transfection. V5 and β‐actin Western blot analysis was employed for loading control. Representative image of five independent experiments.
- C
Zebrafish embryos were injected at the four‐cell stage with plasmid DNA for expression of wild‐type PDIA3‐GFP or PDIA3C57Y‐GFP. Representative fluorescence micrographs of embryos at 48 hpf show mosaic expression of PDIA3‐GFP and PDIA3C57Y‐GFP in epithelial cells. Bottom images are digital magnifications of areas delimited by white dashed squares. Arrowhead points to PDIA3C57Y‐GFP puncta. BF, bright field. Scale bar 50 μm. n = 3 embryos in each group.
- D
HEK cell line was transiently transfected with constructs for expression of wild‐type PDIA3‐V5 or PDIA3C57Y‐V5, or empty vector (Mock). Western blot analysis of immunoprecipitation of V5‐tag to measure PDIA3 interaction with calnexin (CNX) and calreticulin (CRT) at 48 h after transfection. Representative image of three independent experiments.
- E
NSC‐34 cells were transiently transfected with constructs for expression of wild‐type PDIA3‐V5, PDIA3C57Y‐V5, PDIA3R282A‐V5, or PDIA3C57Y/R282A‐V5. Filter‐trap analysis under non‐reducing conditions was performed at 48 h after transfection. β‐actin was employed as loading control. Representative image of three independent experiments.
- F
HEK cell line was transiently transfected with constructs for expression of wild‐type PDIA3‐V5 or PDIA3C57Y‐V5, or empty vector (Mock). Native filter‐trap analysis of immunoprecipitation of V5‐tag to measure CNX interaction with PDIA3 aggregates at 48 h after transfection. Representative image of three independent experiments.
- G
NSC‐34 cells were transfected with constructs for expression of wild‐type PDIA3‐V5 or PDIA3C57Y‐V5, or empty vector (Mock). Fluorescence micrographs with XZ and YZ orthogonal views from Z‐stacks of seven confocal planes show co‐localization of V5 and BiP immunostaining. Bottom images are digital magnifications of cells indicated with white asterisks. Arrowhead points to PDIA3C57Y‐V5 puncta positive for BiP. Scale bar 5 μm. Representative image of three independent experiments.
- H
Purified recombinant wild‐type PDIA3 and PDIA3C57Y were treated with proteinase K and analyzed by SDS–PAGE with Coomassie blue staining. *, undigested protein. **, main fragment of PDIA3C57Y digestion. Representative image of four independent reactions.
- I
Relative thiol oxidase activity of recombinant wild‐type PDIA3 and PDIA3C57Y using NRCSQGSCWN as substrate peptide. n = 3 independent reactions. Data are shown as mean ± s.e.m. and statistical analysis performed using two‐tailed Student's t‐test.
- J
SDS–PAGE analysis of recombinant wild‐type PDIA3 and PDIA3C57Y under reducing (+β‐me, β‐mercaptoethanol) and non‐reducing (−β‐me) conditions with Coomassie blue staining.
- K
Representative traces for binding of 400 nM wild‐type PDIA3 or PDIA3C57Y to immobilized CRT‐P domain using Bio‐Layer Interferometry. A total of five independent measurements were performed.
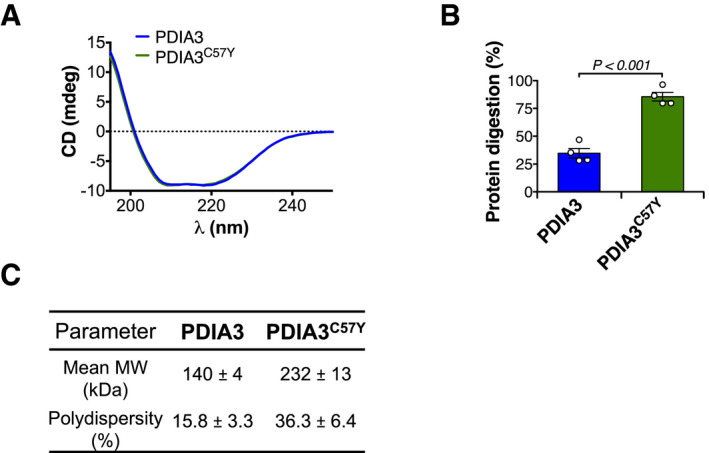
Circular dichroism (CD) analysis of recombinant wild‐type PDIA3 and PDIA3C57Y. Average traces of CD spectroscopic scans are shown.
Purified recombinant wild‐type PDIA3 and PDIA3C57Y were treated with proteinase K and analyzed by SDS–PAGE with Coomassie blue staining as shown in Fig 6H. n = 4 independent reactions. Bar graph shows quantification of protein digestion. Data are shown as mean ± s.e.m. and statistical analysis performed using two‐tailed Student's t‐test.
Dynamic light scattering determination of mean molecular weight (MW) and percent polydispersity of wild‐type PDIA3 and PDIA3C57Y. Data are shown as mean ± s.d.
References
-
- American Psychiatric Association (2013) Diagnostic and statistical manual of mental disorders, 5th edn. Arlington, VA: American Psychiatric Association;
-
- Ayuso E, Mingozzi F, Montane J, Leon X, Anguela XM, Haurigot V, Edmonson SA, Africa L, Zhou S, High KA et al (2010) High AAV vector purity results in serotype‐ and tissue‐independent enhancement of transduction efficiency. Gene Ther 17: 503–510 - PubMed
-
- Benjamini Y, Krieger AM, Yekutieli D (2006) Adaptive linear step‐up procedures that control the false discovery rate. Biometrika 93: 491–507
Publication types
MeSH terms
Substances
LinkOut - more resources
Full Text Sources
Medical
Molecular Biology Databases
Miscellaneous
