. 2022 Apr;303(1):130-138.
doi: 10.1148/radiol.212579. Epub 2021 Dec 14.

First Clinical Photon-counting Detector CT System: Technical Evaluation

Affiliations

First Clinical Photon-counting Detector CT System: Technical Evaluation

Kishore Rajendran et al. Radiology. 2022 Apr.

Abstract

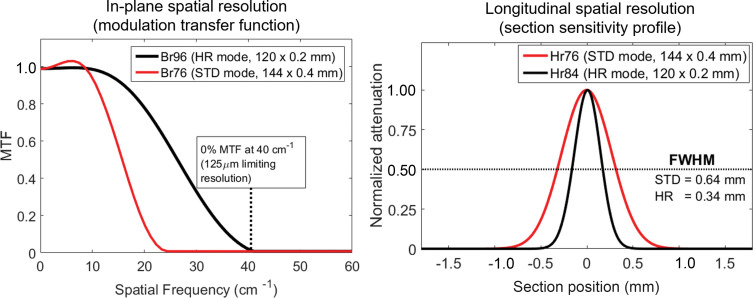
Background The first clinical CT system to use photon-counting detector (PCD) technology has become available for patient care. Purpose To assess the technical performance of the PCD CT system with use of phantoms and representative participant examinations. Materials and Methods Institutional review board approval and written informed consent from four participants were obtained. Technical performance of a dual-source PCD CT system was measured for standard and high-spatial-resolution (HR) collimations. Noise power spectrum, modulation transfer function, section sensitivity profile, iodine CT number accuracy in virtual monoenergetic images (VMIs), and iodine concentration accuracy were measured. Four participants were enrolled (between May 2021 and August 2021) in this prospective study and scanned using similar or lower radiation doses as their respective clinical examinations performed on the same day using energy-integrating detector (EID) CT. Image quality and findings from the participants' PCD CT and EID CT examinations were compared. Results All standard technical performance measures met accreditation and regulatory requirements. Relative to filtered back-projection reconstructions, images from iterative reconstruction had lower noise magnitude but preserved noise power spectrum shape and peak frequency. Maximum in-plane spatial resolutions of 125 and 208 µm were measured for HR and standard PCD CT scans, respectively. Minimum values for section sensitivity profile full width at half maximum measurements were 0.34 mm (0.2-mm nominal section thickness) and 0.64 mm (0.4-mm nominal section thickness) for HR and standard PCD CT scans, respectively. In a 120-kV standard PCD CT scan of a 40-cm phantom, VMI iodine CT numbers had a mean percentage error of 5.7%, and iodine concentration had root mean squared error of 0.5 mg/cm3, similar to previously reported values for EID CT. VMIs, iodine maps, and virtual noncontrast images were created for a coronary CT angiogram acquired with 66-msec temporal resolution. Participant PCD CT images showed up to 47% lower noise and/or improved spatial resolution compared with EID CT. Conclusion Technical performance of clinical photon-counting detector (PCD) CT is improved relative to that of a current state-of-the-art CT system. The dual-source PCD geometry facilitated 66-msec temporal resolution multienergy cardiac imaging. Study participant images illustrated the effect of the improved technical performance. © RSNA, 2022 Online supplemental material is available for this article. See also the editorial by Willemink and Grist in this issue.


Conflict of interest statement

Disclosures of conflicts of interest: K.R. No relevant relationships. M.P. No relevant relationships. A.H. No relevant relationships. E.R.S. No relevant relationships. B.S. No relevant relationships. T.G.F. No relevant relationships. A.F. No relevant relationships. F.B. No relevant relationships. F.E.D. Support for attending meetings and/or travel from the Spine Intervention Society. L.Y. License to Siemens Healthcare for intellectual property rights owned by the Mayo Clinic for which author is an inventor. P.R. Royalties from Elsevier. J.G.F. License to Siemens Healthcare for intellectual property rights owned by the Mayo Clinic for which author is an inventor; grant support from Siemens Healthineers. S.L. License to Siemens Healthcare for intellectual property rights owned by the Mayo Clinic for which author is an inventor. C.H.M. Grant support from Siemens Healthineers; license to Siemens Healthcare for intellectual property rights owned by the Mayo Clinic for which author is an inventor; board member of the International Society of Computed Tomography.

Figures

None
Graphical abstract
Graphs show modulation transfer functions (MTFs) (left) and section sensitivity profiles (right) for the standard (STD) and high-spatial-resolution (HR) collimations of the photon-counting detector CT system. Limiting in-plane spatial resolution of 125 µm and full width at half maximum (FWHM) value of the section sensitivity profile of 0.34 mm were achieved using HR collimation. Br = body-regular reconstruction kernel, Hr = head-regular reconstruction kernel.
Figure 1:
Graphs show modulation transfer functions (MTFs) (left) and section sensitivity profiles (right) for the standard (STD) and high-spatial-resolution (HR) collimations of the photon-counting detector CT system. Limiting in-plane spatial resolution of 125 µm and full width at half maximum (FWHM) value of the section sensitivity profile of 0.34 mm were achieved using HR collimation. Br = body-regular reconstruction kernel, Hr = head-regular reconstruction kernel.
Image noise was reduced by 11.5% and 34.5% for quantum iterative reconstruction (QIR, Siemens) images using strengths of 1 and 3, respectively (labeled QIR1 and QIR3), relative to weighted filtered back projection (WFBP) using Hr40 (head-regular, sharpness level 40) kernel. (A) Bar graph has horizontal dotted lines to assist the reader in comparing noise levels between the collimation settings. (B, C) Noise power spectra (NPS) curves for standard (STD) (B) and high-spatial-resolution (HR) collimations (C) demonstrate that QIR reduced noise magnitude (height of curve) compared with WFBP images for both collimations and QIR strengths without shifting spatial frequency of the peak of the noise power spectrum curves, indicating that only the amount of noise, and not noise texture, is affected with use of QIR.
Figure 2:
Image noise was reduced by 11.5% and 34.5% for quantum iterative reconstruction (QIR, Siemens) images using strengths of 1 and 3, respectively (labeled QIR1 and QIR3), relative to weighted filtered back projection (WFBP) using Hr40 (head-regular, sharpness level 40) kernel. (A) Bar graph has horizontal dotted lines to assist the reader in comparing noise levels between the collimation settings. (B, C) Noise power spectra (NPS) curves for standard (STD) (B) and high-spatial-resolution (HR) collimations (C) demonstrate that QIR reduced noise magnitude (height of curve) compared with WFBP images for both collimations and QIR strengths without shifting spatial frequency of the peak of the noise power spectrum curves, indicating that only the amount of noise, and not noise texture, is affected with use of QIR.
Images in a 71-year-old man scanned with(A) energy-integrating detector (EID) CT and (B, C) photon-counting detector (PCD) CT with dual-source geometry to achieve 66-msec temporal resolution. Axial images are shown in left column, and oblique coronal images are shown in right column. While the EID CT examination is limited to single-energy data (A) at this temporal resolution, the multienergy capabilities of the PCD CT system allowed creation of low-energy (45, 55 keV) virtual monoenergetic images (VMIs) (B), which showed increased iodine signal (shown as mean Hounsfield unit measurements in regions of interest) compared with EID CT despite an 18% decrease (A: 110 mL vs B, C: 90 mL iohexol [Omnipaque 350, GE Healthcare]) in volume of administered contrast material (mean CT numbers for the black circular regions of interest are given in the left column of images). The use of VMIs adds to the inherently higher iodine contrast-to-noise ratio possible with PCD CT and provides clearer delineation of a branch of the left coronary artery (arrowheads). Increasing the VMI energy (65 keV or higher) decreased calcium blooming relative to EID CT (arrows in A and B). Absolute iodine concentration was measured using the iodine map images (mean concentration in mg/cm3 unit shown in region of interest) and virtual noncontrast (VNC) images used to visualize calcifications (arrow in C) with attenuation similar to that of iodinated blood. Reconstruction kernels used were as follows: Bv40 (body-vascular, sharpness level 40) (EID CT 90-kV, in A), Bv48 (PCD CT VMIs in B), Qr40 (quantitative-regular, sharpness level 40) (PCD CT iodine map and VNC images in C) Display windows and levels were as follows: 2000 HU and 200 HU for EID CT and PCD CT VMIs, 30/15 mg · mL−1 for iodine map, and 1000 HU and 100 HU for VNC image.
Figure 3:
Images in a 71-year-old man scanned with (A) energy-integrating detector (EID) CT and (B, C) photon-counting detector (PCD) CT with dual-source geometry to achieve 66-msec temporal resolution. Axial images are shown in left column, and oblique coronal images are shown in right column. While the EID CT examination is limited to single-energy data (A) at this temporal resolution, the multienergy capabilities of the PCD CT system allowed creation of low-energy (45, 55 keV) virtual monoenergetic images (VMIs) (B), which showed increased iodine signal (shown as mean Hounsfield unit measurements in regions of interest) compared with EID CT despite an 18% decrease (A: 110 mL vs B, C: 90 mL iohexol [Omnipaque 350, GE Healthcare]) in volume of administered contrast material (mean CT numbers for the black circular regions of interest are given in the left column of images). The use of VMIs adds to the inherently higher iodine contrast-to-noise ratio possible with PCD CT and provides clearer delineation of a branch of the left coronary artery (arrowheads). Increasing the VMI energy (65 keV or higher) decreased calcium blooming relative to EID CT (arrows in A and B). Absolute iodine concentration was measured using the iodine map images (mean concentration in mg/cm3 unit shown in region of interest) and virtual noncontrast (VNC) images used to visualize calcifications (arrow in C) with attenuation similar to that of iodinated blood. Reconstruction kernels used were as follows: Bv40 (body-vascular, sharpness level 40) (EID CT 90-kV, in A), Bv48 (PCD CT VMIs in B), Qr40 (quantitative-regular, sharpness level 40) (PCD CT iodine map and VNC images in C) Display windows and levels were as follows: 2000 HU and 200 HU for EID CT and PCD CT VMIs, 30/15 mg · mL−1 for iodine map, and 1000 HU and 100 HU for VNC image.
Axial images in an 85-year-old man with aortoiliac stent graft scanned for angiography with energy-integrating detector (EID) CT at 100 kV (left column) and high-spatial-resolution photon-counting detector (PCD) CT (low-energy threshold, or T3D, images; includes photon energies from 20 to 120 keV) (center and right columns). Both scans were obtained with similar radiation doses (approximately 10 mGy). Images in the top row correspond to enlarged view of the rectangular region of interest displayed in the bottom row. PCD CT image in right column was created using sharper resolution (Br72 [body-regular, sharpness level 72] kernel) than is possible to achieve with EID CT, which reduces stent blooming and improves delineation of struts at the expense of increased image noise (shown as standard deviation of pixel values in the white circular region of interest [SD]). Display window = 1800 HU; display level = 440 HU.
Figure 4:
Axial images in an 85-year-old man with aortoiliac stent graft scanned for angiography with energy-integrating detector (EID) CT at 100 kV (left column) and high-spatial-resolution photon-counting detector (PCD) CT (low-energy threshold, or T3D, images; includes photon energies from 20 to 120 keV) (center and right columns). Both scans were obtained with similar radiation doses (approximately 10 mGy). Images in the top row correspond to enlarged view of the rectangular region of interest displayed in the bottom row. PCD CT image in right column was created using sharper resolution (Br72 [body-regular, sharpness level 72] kernel) than is possible to achieve with EID CT, which reduces stent blooming and improves delineation of struts at the expense of increased image noise (shown as standard deviation of pixel values in the white circular region of interest [SD]). Display window = 1800 HU; display level = 440 HU.
Axial images in a 74-year-old man clinically indicated for whole-body low-dose CT skeletal survey for multiple myeloma. Energy-integrating detector (EID) CT scan (left) and high-spatial-resolution photon-counting detector (PCD) CT scans (center and right) were acquired using the same radiation dose (4.2 mGy). PCD CT image (center) using same section thickness (2 mm) as EID CT image (left) showed 47% lower noise (36.8 HU vs 69.4 HU within the white circular regions of interest). Use of thinner (1-mm) section thickness (right) and 1024 × 1024 matrix resulted in image noise similar to that of the EID CT image and improved delineation of vertebral lesion (arrows). Display window = 1500 HU; display level = 150 HU. Br = body-regular reconstruction kernel, SD = standard deviation of pixel values in region of interest.
Figure 5:
Axial images in a 74-year-old man clinically indicated for whole-body low-dose CT skeletal survey for multiple myeloma. Energy-integrating detector (EID) CT scan (left) and high-spatial-resolution photon-counting detector (PCD) CT scans (center and right) were acquired using the same radiation dose (4.2 mGy). PCD CT image (center) using same section thickness (2 mm) as EID CT image (left) showed 47% lower noise (36.8 HU vs 69.4 HU within the white circular regions of interest). Use of thinner (1-mm) section thickness (right) and 1024 × 1024 matrix resulted in image noise similar to that of the EID CT image and improved delineation of vertebral lesion (arrows). Display window = 1500 HU; display level = 150 HU. Br = body-regular reconstruction kernel, SD = standard deviation of pixel values in region of interest.
Oblique axial images in a 72-year-old man scanned with (A, B) energy-integrating detector (EID) CT and (C, D) photon-counting detector (PCD) CT for temporal bone examination. Right temporal bone images acquired with use of EID CT were reconstructed using ultra-high-resolution-regular (Ur) kernels (Ur77 and Ur85) at 0.4-mm section thickness and PCD CT using head-regular (Hr) kernels (Hr76 and Hr84) at 0.2-mm section thickness. PCD CT images show better trabecular detail and delineation of the stapes (arrows) compared with EID CT (images C and D vs A and B), despite use of 30% lower dose (32.6 mGy vs 46.4 mGy) for PCD CT. Display window = 3800 HU; display level = 700 HU. Mean and standard deviation (SD) of CT numbers were measured in the white circular regions of interest.
Figure 6:
Oblique axial images in a 72-year-old man scanned with (A, B) energy-integrating detector (EID) CT and (C, D) photon-counting detector (PCD) CT for temporal bone examination. Right temporal bone images acquired with use of EID CT were reconstructed using ultra-high-resolution-regular (Ur) kernels (Ur77 and Ur85) at 0.4-mm section thickness and PCD CT using head-regular (Hr) kernels (Hr76 and Hr84) at 0.2-mm section thickness. PCD CT images show better trabecular detail and delineation of the stapes (arrows) compared with EID CT (images C and D vs A and B), despite use of 30% lower dose (32.6 mGy vs 46.4 mGy) for PCD CT. Display window = 3800 HU; display level = 700 HU. Mean and standard deviation (SD) of CT numbers were measured in the white circular regions of interest.

Comment in

References

    1. Yu Z , Leng S , Kappler S , et al. . Noise performance of low-dose CT: comparison between an energy integrating detector and a photon counting detector using a whole-body research photon counting CT scanner . J Med Imaging (Bellingham) 2016. ; 3 ( 4 ): 043503 . - PMC - PubMed
    1. Muenzel D , Daerr H , Proksa R , et al. . Simultaneous dual-contrast multi-phase liver imaging using spectral photon-counting computed tomography: a proof-of-concept study . Eur Radiol Exp 2017. ; 1 ( 1 ): 25 . - PMC - PubMed
    1. Sartoretti T , Eberhard M , Nowak T , et al. . Photon-counting multienergy computed tomography with spectrally optimized contrast media for plaque removal and stenosis assessment . Invest Radiol 2021. ; 56 ( 9 ): 563 – 570 . - PubMed
    1. Cormode DP , Roessl E , Thran A , et al. . Atherosclerotic plaque composition: analysis with multicolor CT and targeted gold nanoparticles . Radiology 2010. ; 256 ( 3 ): 774 – 782 . - PMC - PubMed
    1. Leng S , Rajendran K , Gong H , et al. . 150-μm spatial resolution using photon-counting detector computed tomography technology: technical performance and first patient images . Invest Radiol 2018. ; 53 ( 11 ): 655 – 662 . - PMC - PubMed

Publication types