Observational Study
. 2021 Dec 1;10(14):11.
doi: 10.1167/tvst.10.14.11.

Short-Term Parafoveal Cone Loss Despite Preserved Ellipsoid Zone in Rod Cone Dystrophy

Affiliations
Observational Study

Short-Term Parafoveal Cone Loss Despite Preserved Ellipsoid Zone in Rod Cone Dystrophy

Danial Roshandel et al. Transl Vis Sci Technol. .

Abstract

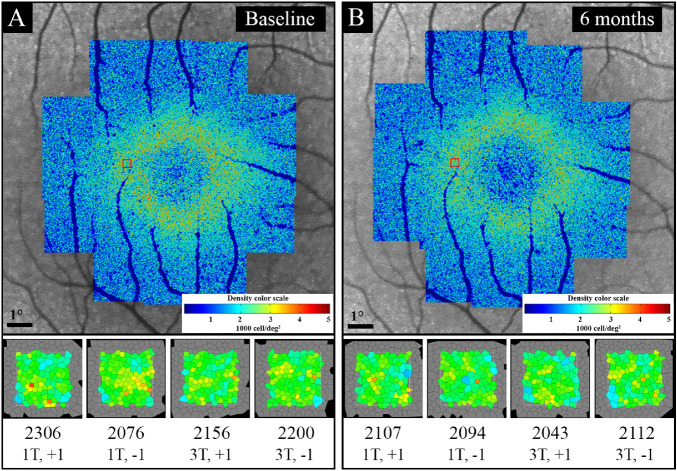
Purpose: Rod-cone dystrophy (RCD) is characterized by centripetal loss of rod followed by cone photoreceptors. In this prospective, observational cohort, we used flood-illumination adaptive optics (AO) imaging to investigate parafoveal cone loss in regions with preserved ellipsoid zone (EZ) in patients with RCD.

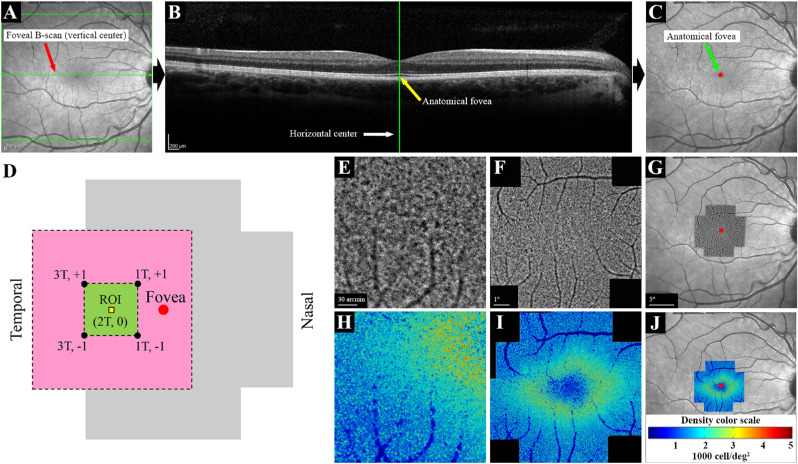
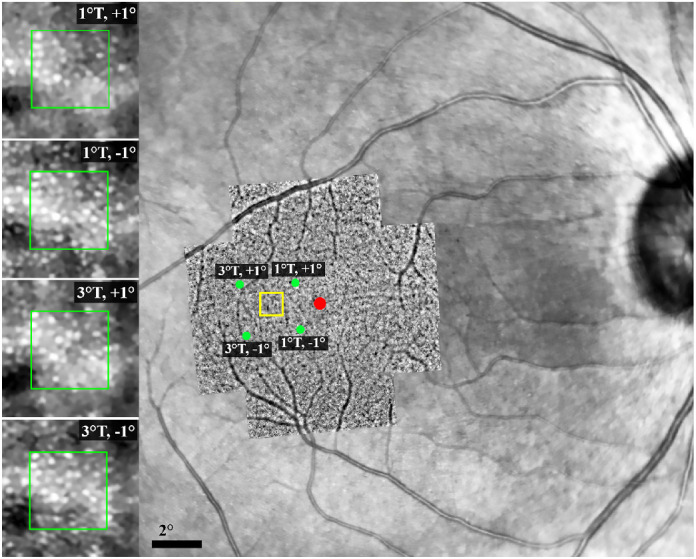
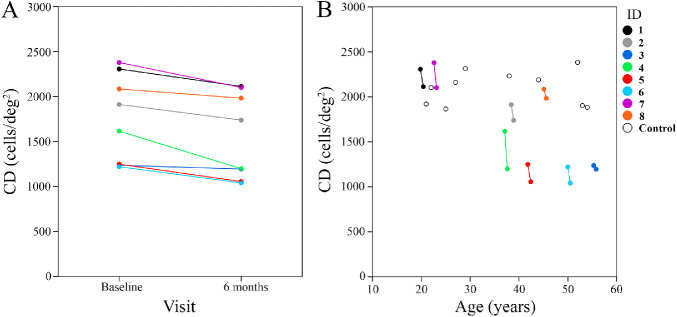
Methods: Eight patients with RCD and 10 age-matched healthy controls underwent spectral-domain optical coherence tomography and AO imaging. The RCD cohort underwent a follow-up examination after 6 months. Cone density (CD) and intercone distance (ICD) measurements were performed at 2° temporal from the fovea. Baseline CD and ICD values were compared between the control and patient groups, and longitudinal changes were calculated in the patient group. Residual EZ span in patients was measured in horizontal foveal B-scans.

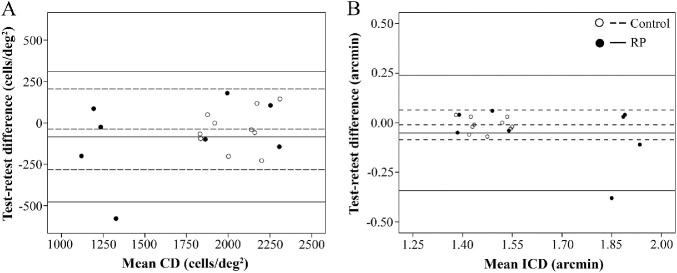
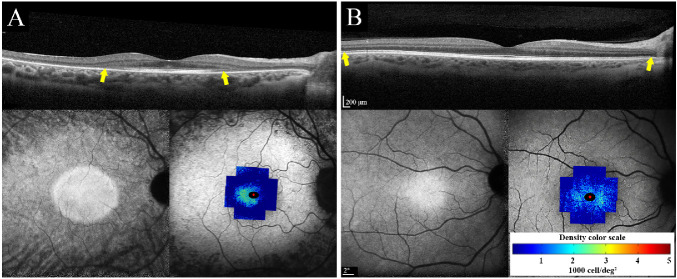
Results: Between the control and patient groups, there was no significant difference in the baseline CD (2094 vs. 1750 cells/deg2, respectively; P = 0.09) and ICD (1.46 vs. 1.62 arcmin, respectively; P = 0.08). Mean CD declined by 198 cells/deg2 (-11.3%; P < 0.01), and mean ICD increased by 0.09 arcmin (+5.6%; P = 0.01) at the 6-month follow-up in the patient group. Mean baseline and follow-up residual EZ spans in the six patients with EZ defect were 3189 µm and 3065 µm, respectively (-3.9%; P = 0.08).

Conclusions: AO imaging detected significant parafoveal cone loss over 6-month follow-up even in regions with preserved EZ. Further studies to refine AO imaging protocol and validate cone metrics as a structural endpoint in early RCD are warranted.

Translational relevance: CD and ICD may change prior to EZ span shortening in RCD.


Conflict of interest statement

Disclosure: D. Roshandel, None; R.C. Heath Jeffery, None; J. Charng, None; D.M. Sampson, None; S. McLenachan, None; D.A. Mackey, None; F.K. Chen, None

Figures

Figure 1.
Figure 1.
Procedures used for image acquisition, montage and marking the foveal center in a normal eye. Vertical (A) and horizontal (B) centers of the high-resolution IR image were located using the HEYEX software, and the foveal center was marked on the IR image (C). The AO imaging protocol included 12 overlapping 4° × 4° image frames covering the central 10° (D). Fovea, region of interest (ROI), and x, y coordinates (degrees from the fovea) of the four overlapping image frames are shown. The pink area (6° × 6°) shows the area covered by the four overlapping image frames, and the green area (2° × 2°) shows the area shared by these image frames. The ROI (80 µm × 80 µm) was located on the horizontal meridian, 2° temporal to the fovea. Individual AO image frames (E) were stitched together to create an AO montage (F). The AO montage was overlaid on the center-marked IR image, and the foveal center was marked on the AO montage (G). The same procedure was performed for the analyzed AO images to create cone density maps (HJ). The color code for the density map is shown in (J). T, temporal; +, superior; −, inferior.
Figure 2.
Figure 2.
Location of the ROI on the AO montage overlaid on the IR image. The red spot shows the foveal center, and the yellow box shows the approximate location of the ROI (2° temporal to the foveal center along the horizontal meridian). Green dots show the center of each of the four image frames. Note that the distance of the ROI from the image frame centers is approximately the same for all image frames, although there is a mild rotation in the AO image compared with the background IR image. Magnified images on the left side represent the cone mosaic and precise alignment of the ROI (located within the yellow box) in the overlapping image frames. Green boxes show the dimensions of the sampling window (80 µm × 80 µm). T, temporal; +, superior; −, inferior.
Figure 3.
Figure 3.
Bland–Altman plots show no relationship between intra-session test–retest difference and mean CD (A) and ICD (B) in the control and patient groups. In each eye, the two highest values from the same session were analyzed. For each group, the middle, upper, and lower lines represent mean +2 SD and −2 SD of the test–retest differences.
Figure 4.
Figure 4.
Macular SD-OCT (top), near-infrared autofluorescence (NI-AF; bottom left) and CD map overlaid on short-wavelength autofluorescence (SW-AF; bottom right) in two patients with RP. (A) Severe generalized cone loss with only preserved temporal cone mosaic in patient 8. (B) Severe perifoveal cone loss in patient 3 with autosomal recessive retinitis pigmentosa (ARRP). Ellipsoid zone appeared normal in areas with severe cone loss in both patients. Yellow arrows show the span of the ellipsoid zone, which was beyond the imaging field in patient 3. Scales of OCT, SW-AF, and CD are shown.
Figure 5.
Figure 5.
Example of baseline (A) and follow-up (B) CD map and analysis of ROI in four overlapping image frames in patient 1 with autosomal dominant retinitis pigmentosa (ADRP). There was an overall decline in parafoveal CD on the CD map at the 6-month follow-up (B) compared with baseline (A). Red boxes indicate the approximate location of the ROI. The bottom section shows a magnified image of the analyzed sampling window on each image frame, CD (cells/deg2; top line), and image frame centration coordinates (bottom line), showing a decline in CD at the 6-month follow-up (B) compared with baseline (A).
Figure 6.
Figure 6.
(A) CD declined between baseline and the 6-month follow-up. (B) Scatterplot of CD in control subjects superimposed on patients' baseline and follow-up measurements shows inter-individual variations across five decades of age range.

References

    1. Roshandel D, Thompson JA, Charng J, et al. .. Exploring microperimetry and autofluorescence endpoints for monitoring disease progression in PRPF31-associated retinopathy. Ophthalmic Genet . 2020; 42: 1–14. - PubMed
    1. Cehajic-Kapetanovic J, Xue K, Martinez-Fernandez de la Camara C, et al. .. Initial results from a first-in-human gene therapy trial on X-linked retinitis pigmentosa caused by mutations in RPGR. Nat Med . 2020; 26: 354–359. - PMC - PubMed
    1. Ramachandran R, Zhou L, Locke KG, Birch DG, Hood DC.. A comparison of methods for tracking progression in X-linked retinitis pigmentosa using frequency domain OCT. Transl Vis Sci Technol . 2013; 2: 5. - PMC - PubMed
    1. Birch DG, Locke KG, Wen Y, Locke KI, Hoffman DR, Hood DC.. Spectral-domain optical coherence tomography measures of outer segment layer progression in patients with X-linked retinitis pigmentosa. JAMA Ophthalmol . 2013; 131: 1143–1150. - PMC - PubMed
    1. Cai CX, Locke KG, Ramachandran R, Birch DG, Hood DC.. A comparison of progressive loss of the ellipsoid zone (EZ) band in autosomal dominant and x-linked retinitis pigmentosa. Invest Ophthalmol Vis Sci . 2014; 55: 7417–7422. - PMC - PubMed

Publication types