. 2022 Jul 1;24(7):1056-1070.
doi: 10.1093/neuonc/noab288.

Targeting radiation-tolerant persister cells as a strategy for inhibiting radioresistance and recurrence in glioblastoma

Affiliations

Targeting radiation-tolerant persister cells as a strategy for inhibiting radioresistance and recurrence in glioblastoma

Jintao Gu et al. Neuro Oncol. .

Abstract

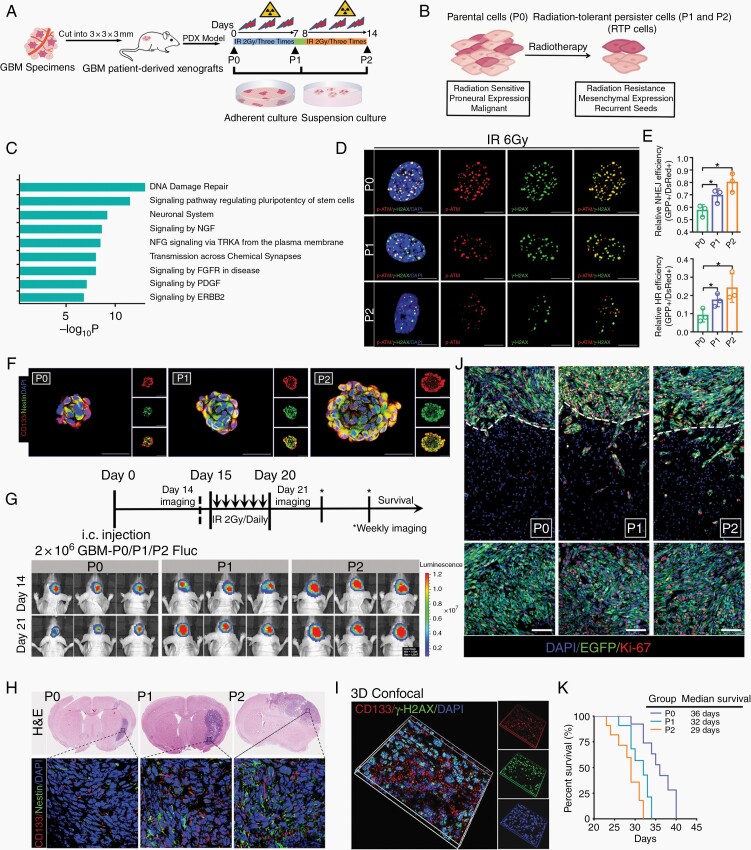
Background: Compelling evidence suggests that glioblastoma (GBM) recurrence results from the expansion of a subset of tumor cells with robust intrinsic or therapy-induced radioresistance. However, the mechanisms underlying GBM radioresistance and recurrence remain elusive. To overcome obstacles in radioresistance research, we present a novel preclinical model ideally suited for radiobiological studies.

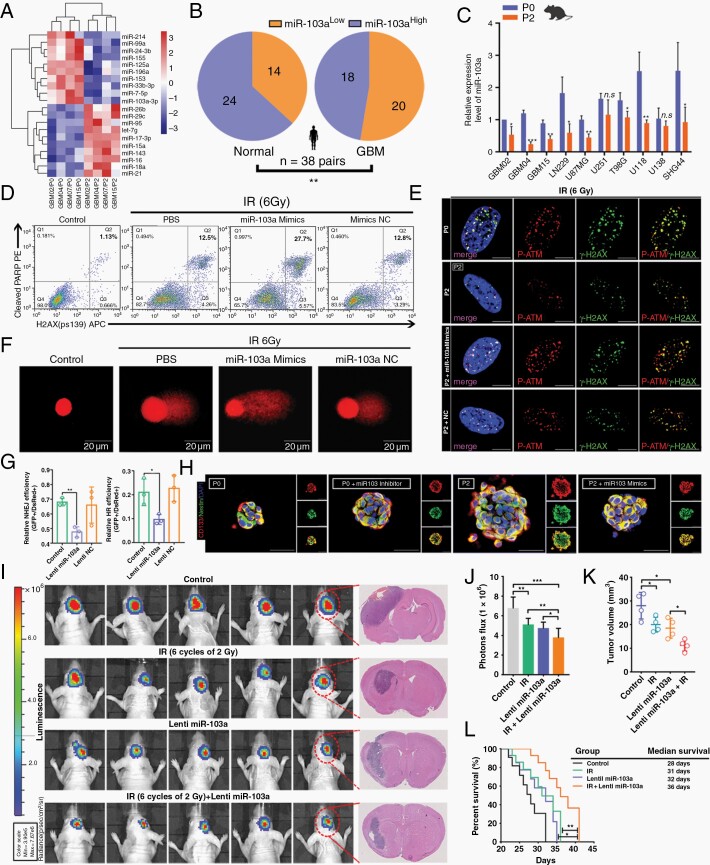
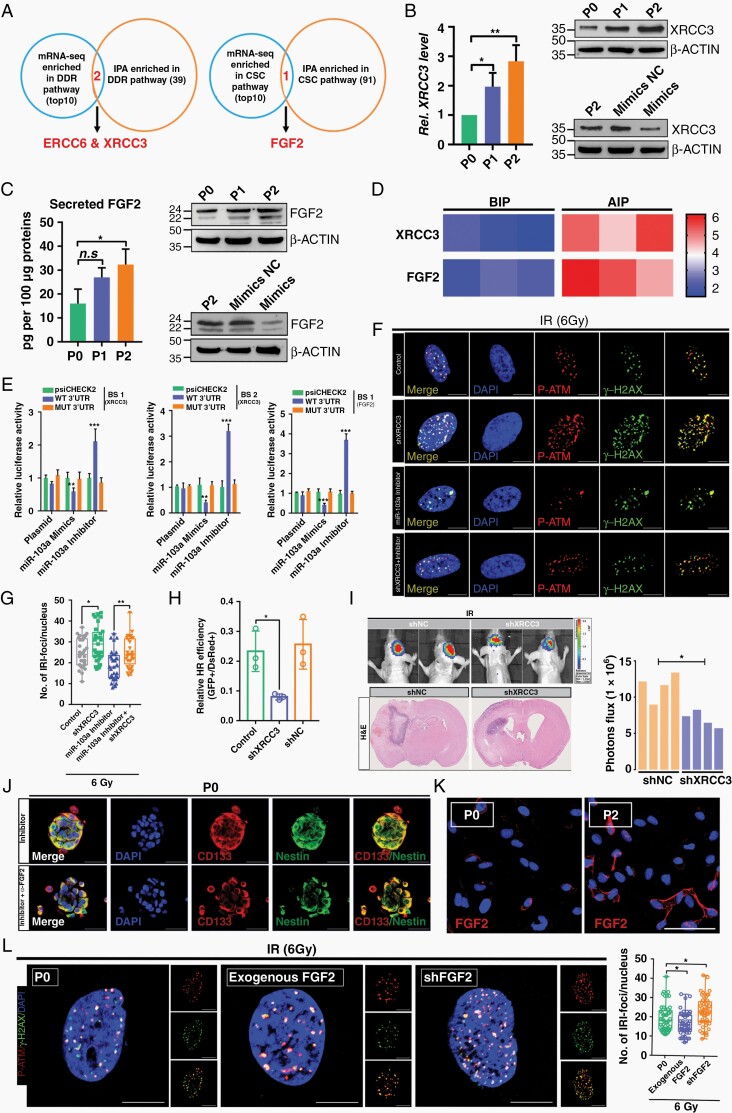
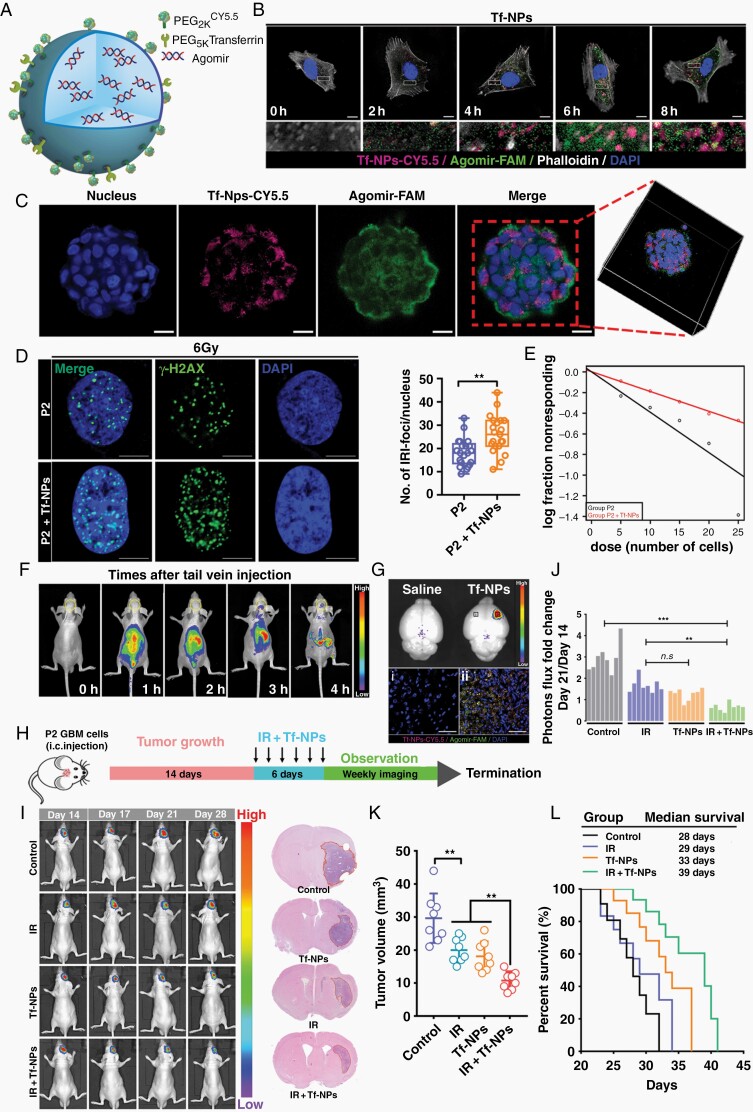
Methods: With this model, we performed a screen and identified a radiation-tolerant persister (RTP) subpopulation. RNA sequencing was performed on RTP and parental cells to obtain mRNA and miRNA expression profiles. The regulatory mechanisms among NF-κB, YY1, miR-103a, XRCC3, and FGF2 were investigated by transcription factor activation profiling array analysis, chromatin immunoprecipitation, western blot analysis, luciferase reporter assays, and the MirTrap system. Transferrin-functionalized nanoparticles (Tf-NPs) were employed to improve blood-brain barrier permeability and RTP targeting.

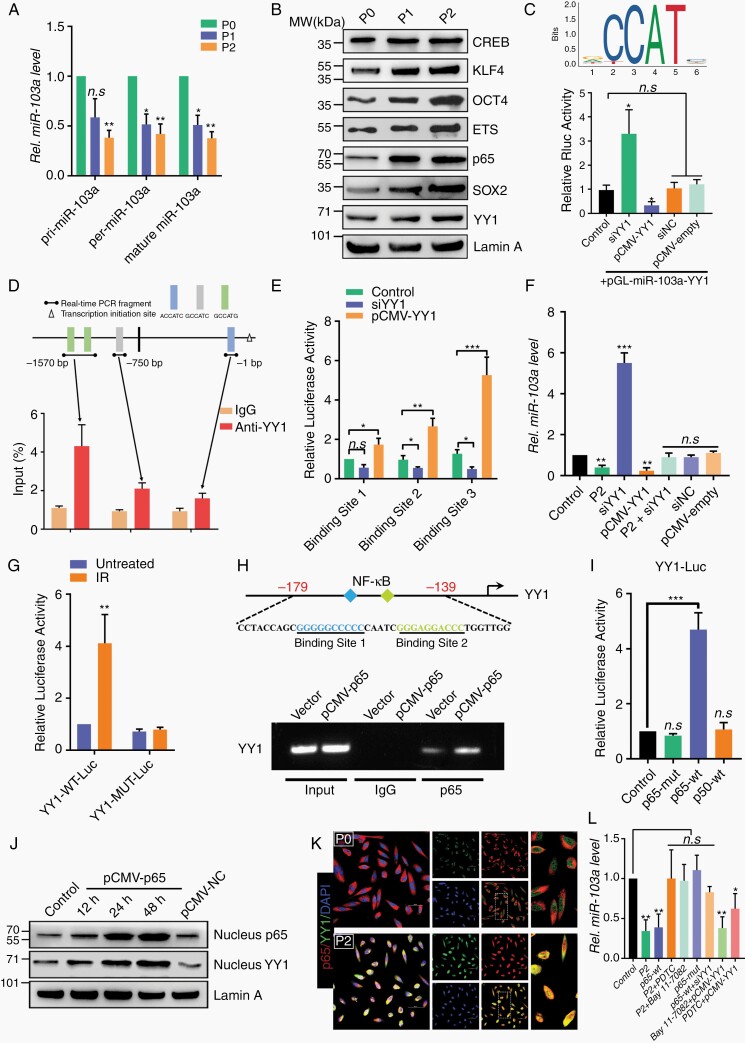
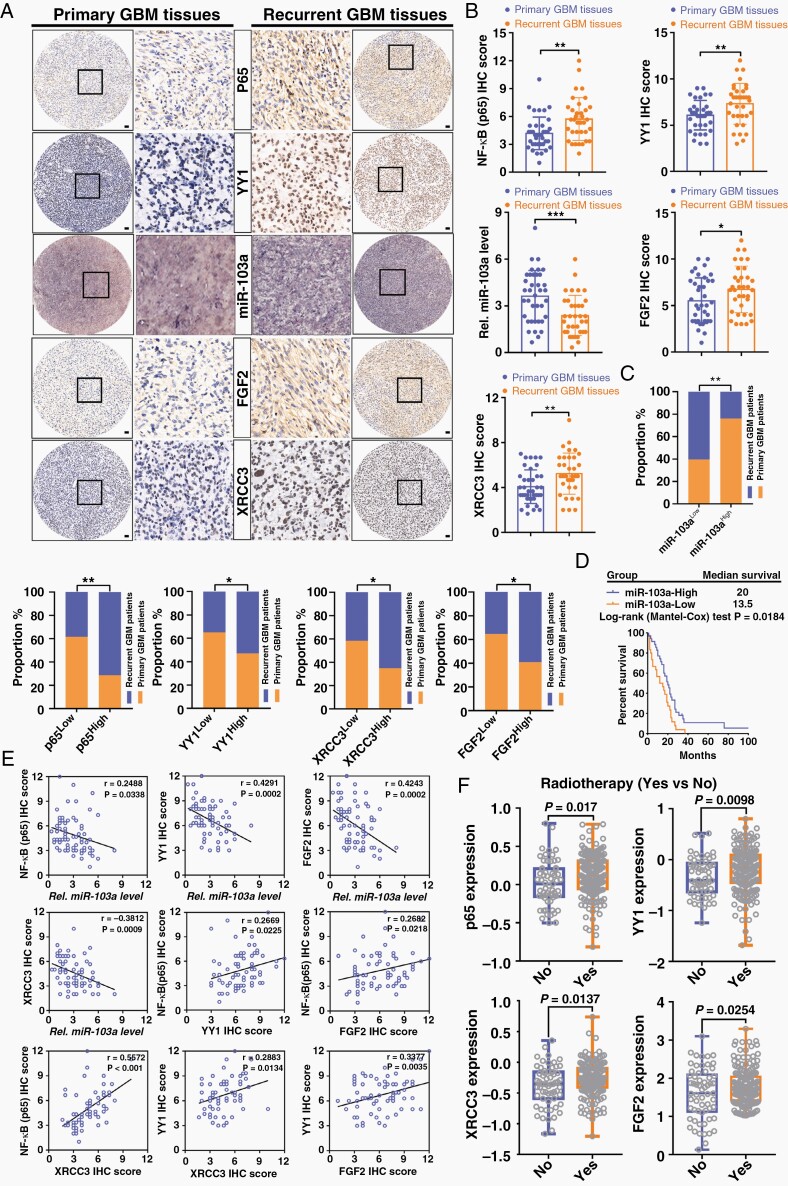
Results: RTP cells drive radioresistance by preferentially activating DNA damage repair and promoting stemness. Mechanistic investigations showed that continual radiation activates the NF-κB signaling cascade and promotes nuclear translocation of p65, leading to enhanced expression of YY1, the transcription factor that directly suppresses miR-103a transcription. Restoring miR-103a expression under these conditions suppressed the FGF2-XRCC3 axis and decreased the radioresistance capability. Moreover, Tf-NPs improved radiosensitivity and provided a significant survival benefit.

Conclusions: We suggest that the NF-κB-YY1-miR-103a regulatory axis is indispensable for the function of RTP cells in driving radioresistance and recurrence. Thus, our results identified a novel strategy for improving survival in patients with recurrent/refractory GBM.

Keywords: DNA damage repair; glioblastoma; glioma stem cell; radioresistance.


Figures

Graphical Abstract
Graphical Abstract
Fig. 1
Fig. 1
The preclinical radioresistant PDX model enabled the characterization of radioresistance associated with recurrence. (A) Establishment of the preclinical radioresistant PDX model by using X-ray irradiation. (B) Biological properties of RTP cells. (C) Gene ontology analysis of all genes specifically altered in RTP cells. (D) Colocalization of IR-induced (IRI) p-ATM/γ-H2AX-positive DNA damage foci 12 h after IR treatment. Scale bar: 10 μm. (E) Analysis of HR and NHEJ efficiency in P0, P1, and P2 cells by counting green versus red fluorescence puncta. (F) Immunofluorescence (IF) analysis of GSC spheroids cultured under stem cell conditions with the indicated antibodies. Scale bar: 50 μm. (G) Schematic diagram of P2 cell-derived xenografts. (H) Coronal sections of mouse brains were harvested on day 21 after injection. (I) IF staining of intracranial EGFP-labeled tumors for Ki-67 and DAPI to visualize the core and invasive areas. Scale bar: 100 μm. (J) 3D confocal microscopy of CD133 and γ-H2AX expression and distribution. (K) Kaplan–Meier survival curves of xenograft tumor-bearing mice.
Fig. 2
Fig. 2
miR-103a is closely linked with the GSC properties and radioresistance of RTP cells. (A) Hierarchical clustering of 20 differentially expressed miRNAs in P0 tumors and the corresponding P2 tumors. (B) Pie charts showing the distribution of miR-103aLow and miR-103aHigh expression in normal and GBM tissues. (C) qRT-PCR analysis of miR-103a expression in radioresistant models. (D) FACS analysis of γ-H2AX and cleaved PARP-1 staining in irradiated P2 cells. (E) Colocalization of IRI p-ATM/γ-H2AX-positive DNA damage foci. Scale bar: 10 μm. (F) The presence of DNA damage after exposure to 6 Gy IR was assessed by a single-cell gel electrophoresis comet assay. (G) Effects of miR-103a on HR and NHEJ. (H) Immunofluorescence analysis of GSC spheroids. Scale bar: 50 μm. (I) Representative H&E staining of coronal sections harvested 21 days after transplantation. (J) Statistical analysis of orthotopic tumor growth as measured by luciferase activity over time. (K) Quantification of tumor sizes. (L) Kaplan–Meier survival curves of mice bearing P0 cell-derived xenografts treated as indicated.
Fig. 3
Fig. 3
The miR-103a–XRCC3–FGF2 axis is functionally important for regulating DDR and GSC properties in RTP cells. (A) Target genes of miR-103a were identified by Ingenuity Pathway Analysis and RNA-seq. (B) Relative XRCC3 mRNA and protein expression in GBM cells subjected to different treatments. (C) Changes in the secretory FGF2 level in P2 cells compared to P0 cells, as evaluated by ELISA. The FGF2 protein level was assessed by WB analysis. (D) Heatmap represents fold enrichment before and after immunoprecipitation (BIP/AIP) using the RT2 profiler PCR array system. (E) Luciferase activity of psiCHECK2-XRCC3 and psiCHECK2-FGF2 in P0 cells after cotransfection with miR-103a. (F and G) p-ATM colocalized with γ-H2AX after DNA damage. Scale bar: 10 μm. (H) Efficiency of HR in P2 cells treated with or without shXRCC3. (I) Representative bioluminescence and H&E images of shNC- or shXRCC3-expressing P2 cells injected intracranially into nude mice. (J) Immunofluorescence (IF) analysis of GSC spheroids. Scale bar: 50 μm. (K) IF staining of FGF2 in P0 and P2 cells. Scale bar: 50 μm. (L) Quantification of IRI p-ATM/γ-H2AX-positive DNA damage foci treated with exogenous FGF2 or shFGF2. Scale bar: 10 μm.
Fig. 4
Fig. 4
The NF-κB–YY1 axis transcriptionally regulates miR-103a in RTP cells. (A) Expression profiles of pri-, pre-, and mature miR-103a in P0, P1, and P2 cells. (B) Western blot analysis of CREB, KLF4, OCT4, ETS, p65, YY1, LaminA, and SOX2. (C) The JASPAR database was used to predict the TF binding sites. P2 cells were transfected with the pGLmiR-103a-YY1 luciferase reporter vector. (D) Top: schematic diagrams of the regions amplified by the ChIP primers. Bottom: amounts of DNA precipitated by the anti-YY1 antibody and control IgG. (E) P2 cells were transfected with luciferase reporter vectors containing the miR-103a promoter region. (F) miR-103a expression level was determined by qRT-PCR. (G) P0 cells were transfected with luciferase reporter vectors containing the wild-type or mutant YY1 promoter region and were then treated with or without IR. (H) Schematic illustration of the YY1 promoter containing 2 putative NF-κB consensus binding sequences. ChIP analysis was used to detect the direct binding of p65 to the YY1 promoter. (I) P0 cells were transiently transfected with the YY1-Luc reporter plasmid alone or in combination with the indicated p65 or p50 expression plasmid. (J) P0 cells were transfected with pCMV-p65, and the expression levels of p65 and YY1 were determined by WB. (K) The distribution and expression of p65 and YY1 in P0 and P2 cells were evaluated by immunofluorescence staining. Scale bar: 50 μm. (L) The effect of the NF-kB–YY1 axis on miR-103a expression was detected by qRT-PCR.
Fig. 5
Fig. 5
The NF-κB–YY1–miR-103a axis is clinically associated with recurrence, worse prognosis, and radioresistance in GBM. (A) Immunohistochemical staining of p65, YY1, FGF2, and XRCC3 and in situ hybridization of miR-103a in primary and recurrent GBM tissues. Scale bars: 250 mm. (B) Immunohistochemical scores of p65, YY1, miR-103a, FGF2, and XRCC3 were compared between primary GBM (n = 38) and recurrent GBM (n = 35). (C) Histograms showing the correlations of high or low miR-103a, p65, YY1, XRCC3, and FGF2 expression levels with primary and recurrent GBM. (D) Kaplan–Meier analysis of patients represented in a GBM tissue microarray. (E) Pearson correlation analysis among p65, miR-103a, YY1, FGF2, and XRCC3 expression in 73 human GBM specimens. (F) GBM patients in the TCGA database were divided into 2 groups: with and without radiotherapy.
Fig. 6
Fig. 6
RTP-targeting Tf-modified nanoparticles reverse refractory GBM and improve radiosensitivity. (A) Schematic of a PEGylated agomir-loaded nanoparticles that can be functionalized to enhance transport across the BBB and target RTP cells. (B) Immunofluorescence staining demonstrating the time-dependent intracellular uptake of Tf-NPs in P2 cells. Scale bar: 10 μm. (C) Tf-NPs entering a GSC spheroid were monitored by 3D confocal laser microscopy Scale bar: 20 μm. (D) P2 cells were treated with IR in the presence or absence of Tf-NPs, and γ-H2AX foci formation was investigated. Scale bar = 10 μm. (E) In vitro limiting dilution assay. (F and G) In vivo real-time NIR fluorescence imaging of P2 tumor-bearing mice after administration of Tf-NPs for the indicated time periods. (H) Schematic diagram showing the experimental time course and details of the Tf-NP and IR treatment courses. (I) In vivo bioluminescence images of P2 tumor cells in orthotopic mice intravenously injected with Tf-NPs. (J) Statistical analysis of orthotopic tumor growth from P2 cells. (K) Quantification of tumor sizes. The data were obtained from H&E-stained brain sections of 8 mice per group. (L) Kaplan–Meier survival curves of mice intracranially injected with P2 cells.

Comment in

References

    1. Nagaraja S, Vitanza NA, Woo PJ, et al. . Transcriptional dependencies in diffuse intrinsic pontine glioma. Cancer Cell. 2017;31(5):635–652 e636. - PMC - PubMed
    1. Tirosh I, Suvà ML. Tackling the many facets of glioblastoma heterogeneity. Cell Stem Cell. 2020;26(3):303–304. - PubMed
    1. Sulman EP, Ismaila N, Armstrong TS, et al. . Radiation therapy for glioblastoma: American Society of Clinical Oncology Clinical Practice Guideline Endorsement of the American Society for Radiation Oncology Guideline. J Clin Oncol. 2017;35(3):361–369. - PubMed
    1. Echizenya S, Ishii Y, Kitazawa S, et al. . Discovery of a new pyrimidine synthesis inhibitor eradicating glioblastoma-initiating cells. Neuro Oncol. 2020;22(2):229–239. - PMC - PubMed
    1. Schaue D, McBride WH. Opportunities and challenges of radiotherapy for treating cancer. Nat Rev Clin Oncol. 2015;12(9):527–540. - PMC - PubMed

Publication types

MeSH terms