Review
. 2022 Apr;414(9):2841-2881.
doi: 10.1007/s00216-021-03806-6. Epub 2021 Dec 14.

Antigenic characterization of influenza and SARS-CoV-2 viruses

Affiliations
Review

Antigenic characterization of influenza and SARS-CoV-2 viruses

Yang Wang et al. Anal Bioanal Chem. 2022 Apr.

Abstract

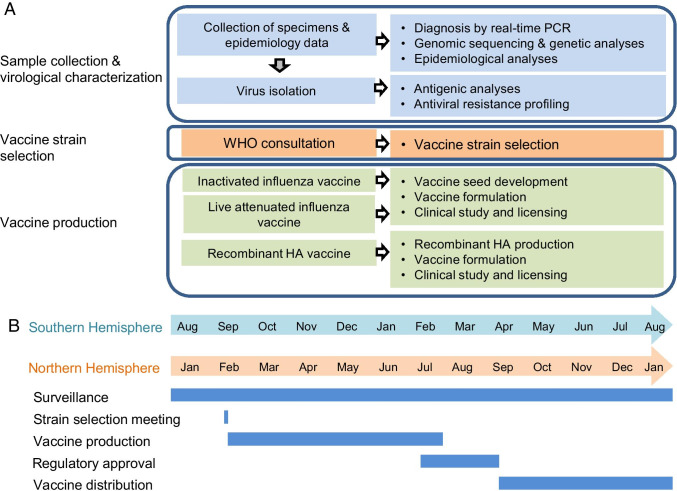
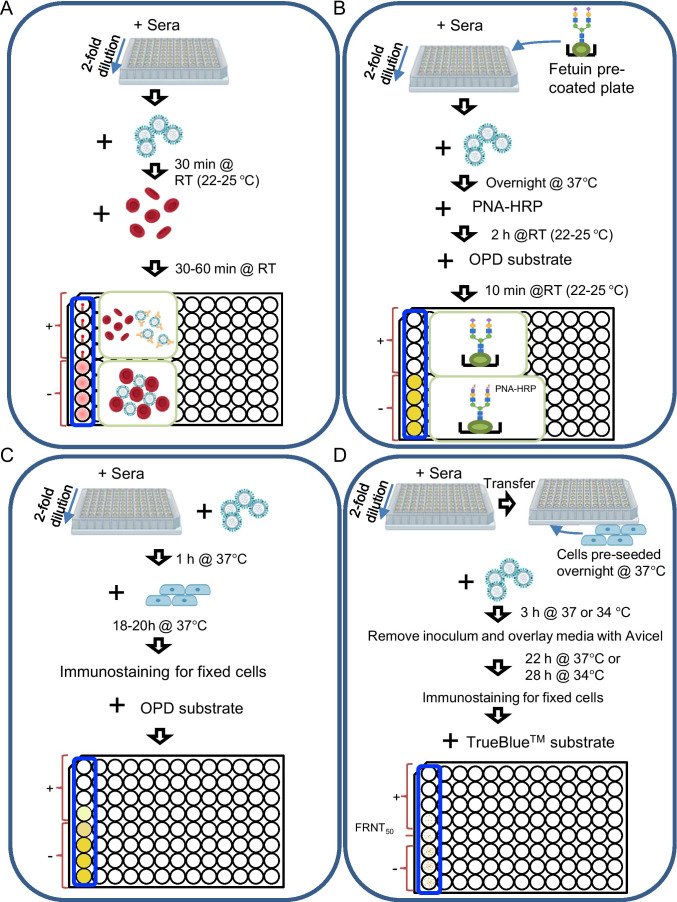
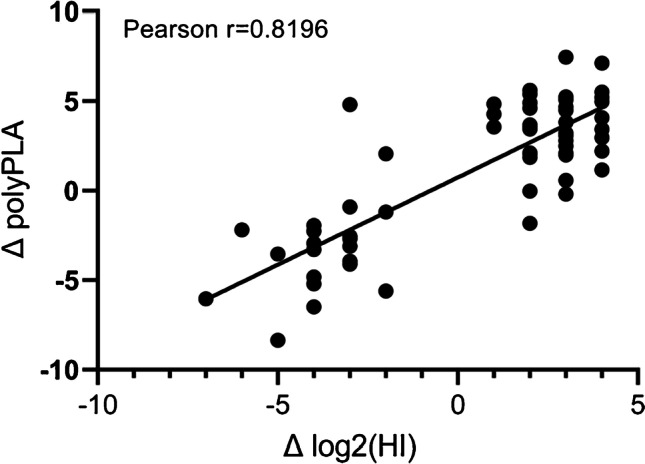
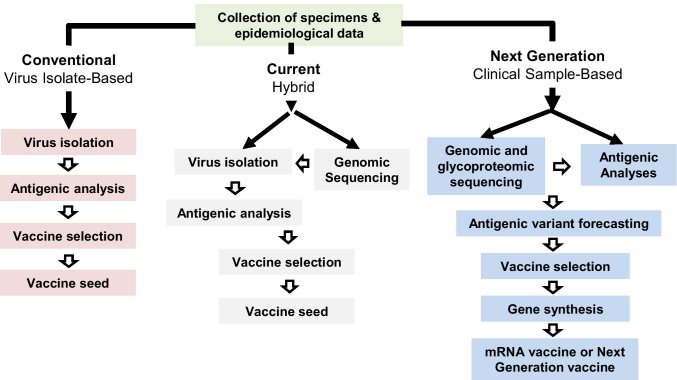
Antigenic characterization of emerging and re-emerging viruses is necessary for the prevention of and response to outbreaks, evaluation of infection mechanisms, understanding of virus evolution, and selection of strains for vaccine development. Primary analytic methods, including enzyme-linked immunosorbent/lectin assays, hemagglutination inhibition, neuraminidase inhibition, micro-neutralization assays, and antigenic cartography, have been widely used in the field of influenza research. These techniques have been improved upon over time for increased analytical capacity, and some have been mobilized for the rapid characterization of the SARS-CoV-2 virus as well as its variants, facilitating the development of highly effective vaccines within 1 year of the initially reported outbreak. While great strides have been made for evaluating the antigenic properties of these viruses, multiple challenges prevent efficient vaccine strain selection and accurate assessment. For influenza, these barriers include the requirement for a large virus quantity to perform the assays, more than what can typically be provided by the clinical samples alone, cell- or egg-adapted mutations that can cause antigenic mismatch between the vaccine strain and circulating viruses, and up to a 6-month duration of vaccine development after vaccine strain selection, which allows viruses to continue evolving with potential for antigenic drift and, thus, antigenic mismatch between the vaccine strain and the emerging epidemic strain. SARS-CoV-2 characterization has faced similar challenges with the additional barrier of the need for facilities with high biosafety levels due to its infectious nature. In this study, we review the primary analytic methods used for antigenic characterization of influenza and SARS-CoV-2 and discuss the barriers of these methods and current developments for addressing these challenges.

Keywords: Antigenic analysis; Antigenic characterization; Antigenic drift; Influenza; SARS-CoV-2; Vaccine strain selection.


Conflict of interest statement

The authors declare no competing interests.

Figures

Fig. 1
Fig. 1
Hemagglutinin (HA) structure and antigenic binding sites. (A) Structure of HA protein. (B) The five antigenic sites (i.e., Sa, Sb, Ca1, Ca2, and Cb) of H1 (A/California/04/2009; PDB 3UBE). (C) The five antigenic sites (i.e., A–E) of H3 (A/Aichi/2/1968; PDB 2YPG). (D) The four antigenic sites of influenza B viruses (B/Hong Kong/8/1973; PDB 3BT6)
Fig. 2
Fig. 2
Antigenic evolution of seasonal influenza viruses. (A) Timeline of influenza A and B virus pandemics and circulation in humans since 1918. There have been 4 pandemics during this period, which are indicated with arrows. The 1918 pandemic was caused by the H1N1pdm1918 virus, which circulated in humans until the 1957 H2N2 pandemic. The circulating H2N2 virus was then replaced by the 1968 H3N2 pandemic virus. In 1977, H1N1 reemerged was replaced by a reassortment H1N1pdm09 strain. H3N2 has been co-circulating with H1N1 since 1977. Influenza B viruses were first isolated in 1940 and have also been co-circulating in humans at least since 1987 as two antigenically distinct lineages, Victoria and Yamagata. (B) Antigenic cartography of 39,370 seasonal influenza A(H3N2) viruses (1968–2016) (adapted from Han et al. [71]). A total of 16 antigenic clusters were identified during this time period. Antigenic cartography of 13,591 human, swine, and avian influenza A(H1N1) viruses (adapted from Li et al. [72])
Fig. 3
Fig. 3
Schematic of the influenza surveillance, vaccine strain-selection, and vaccine production process. (A) The process by the Global Influenza Surveillance and Response System (GISRS) was detailed in [208]. (B) Timeline of influenza vaccine production. The GISRS vaccine strain selection, production, approval process, and distribution in both the Northern and Southern Hemispheres are shown with the corresponding time of year that each procedure is performed
Fig. 4
Fig. 4
Conventional of serological assays used in influenza antigenic analyses. (A) Hemagglutination inhibition (HI) assay. After mixing 4 hemagglutination (HA) units of virus and 2-fold serially diluted reference sera, red blood cells (RBCs) are added to the reaction. If the binding of viruses to RBCs is not inhibited by the antibody, the RBCs will agglutinate in the micro-titrate. Otherwise, the RBCs are not agglutinated, forming (1) a button or a halo when using avian RBCs or mammalian RBCs or (2) a floating pellet (when the plate is tilted) using avian RBCs. The pattern of non-agglutinated chicken and turkey RBCs are shown in the top four wells to the left column and that of agglutinated chicken and turkey RBCs are shown in the bottom four wells. (B) Enzyme-linked lectin assay (ELLA). The mixture of a predetermined amount of virus and serially diluted reference sera is added to 96-well plates coated with fetuin, a liver protein with sialic acid and galactose at the glycan terminal, and then incubated overnight at 37°C. Peanut agglutinin conjugated to peroxidase (PNA-HRP) is then added, and the PNA-HRP binds to the exposed galactose due to the removal of sialic acid by neuraminidase activity. Otherwise, the neuraminidase is inhibited by the reference antibody, and the PNA-HRP does not bind to the fetuin. Finally, the signal is detected by adding o-phenylenediamine dihydrochloride (OPD) substrate. (C) Micro-neutralization (MN) assay. Reference sera are diluted by twofold, and then mixed with viruses in a titer of 100 median tissue culture infectious dose (TCID50) per well. The mixtures are used to infect cells (e.g., MDCK cells or MDCK-SIAT cells). After 1 day of incubation at 37°C, an ELISA can be performed to detect the fixed cells using anti-NP antibodies [222]. (D) Focus reduction neutralization test (FRNT). Reference sera are diluted by twofold and added to MDCK or MDCK-SIAT cell pre-seeded plates, and viruses caused 20–85% infected cell population (ICP) are then added. After 3 h incubation at 37°C (influenza A virus) or 34°C (influenza B virus), the inoculum is removed, and the monolayers are overlaid with the culture medium containing 1.2% (w/v) Avicel (FMC BioPolymer) and 2 μg/mL TPCK-trypsin. After 22-h incubation at 37°C (influenza A) or 28-h incubation at 34°C (influenza B), an immunostaining is performed to detect the fixed cells using NP-specific antibodies, a peroxidase-conjugated secondary antibody and TrueBlue substrate. The infected cell population is imaged by flatbed scanner. The neutralization titer is expressed as the reciprocal of the antiserum dilution that reduces ICP by 80% [223]
Fig. 5
Fig. 5
A diagram illustrates polyPLA. PolyPLA quantifies antibody-antigen binding avidity. Reference polyclonal antiserum (for antigenic analyses) or anti-NP monoclonal antibody (mAb) (for normalization) is biotinylated and then labeled using sodium azide-linked oligonucleotide probes. The labeled polyclonal antiserum or monoclonal antibody is incubated using a reference (virus) or testing antigen and ligated with the two oligonucleotides linked to the antibodies are ligated followed by qPCR, which is used to determine the amplification signals and quantify antibody-antigen binding avidity. The resulting cycle threshold (Ct) values of the polyclonal antisera and antigens are normalized by those by anti-NP monoclonal antibody and antigens and then analyzed for antigenic differences, and the normalization will ensure the equal amount of antigens in antigenic analyses. This figure was adapted from Martin et al. [302]
Fig. 6
Fig. 6
Correlation between polyPLA and HI titers. The Pearson correlation coefficient analysis was performed on paired polyPLA and HI titers for 19 H3N2 viruses against three reference sera, which were adapted from Martin et al. [302]
Fig. 7
Fig. 7
Evolving analytic platform for vaccine strain selection and vaccine development. The conventional platform involves isolating viruses from clinical samples, and the viruses are used in antigenic analyses. Due to the labor intensiveness in laboratory efforts, typically only a small set of samples can be analyzed. In the past decade, the advances in genomic sequencing can allow us to quickly sequence viruses using clinical samples. To determine viral antigenicity, virus isolates are still needed. These sequences can be used to guide selection of samples in virus isolation and virological analyses. As a next-generation platform, we would sequence protein and glycans from clinical samples, and antigenicity would be determined by these sequences. The next-generation platform is expected to be higher throughput and can minimize sampling biases. The computational tools correlating antigenicity (and other vaccine strain required phenotypes) and these sequences would be available. Ideally, in this platform, the big data and artificial intelligence-based tool would be able to forecast antigenic evolution

References

    1. Iuliano AD, Roguski KM, Chang HH, Muscatello DJ, Palekar R, Tempia S, et al. Estimates of global seasonal influenza-associated respiratory mortality: a modelling study. Lancet. 2018;391(10127):1285–1300. doi: 10.1016/S0140-6736(17)33293-2. - DOI - PMC - PubMed
    1. Prevention CfDCa. Disease burden of influenza October 5, 2020 [Available from: https://www.cdc.gov/flu/about/burden/index.html.
    1. Valleron A-J, Cori A, Valtat S, Meurisse S, Carrat F, Boëlle P-Y. Transmissibility and geographic spread of the 1889 influenza pandemic. Proc Natl Acad Sci U S A. 2010;107(19):8778–8781. doi: 10.1073/pnas.1000886107. - DOI - PMC - PubMed
    1. Mills CE, Robins JM, Lipsitch M. Transmissibility of 1918 pandemic influenza. Nature. 2004;432(7019):904–906. doi: 10.1038/nature03063. - DOI - PMC - PubMed
    1. Taubenberger JK, Morens DM. 1918 Influenza: the mother of all pandemics. Emerg Infect Dis. 2006;12(1):15–22. doi: 10.3201/eid1209.05-0979. - DOI - PMC - PubMed

Substances