

Amyloid PET quantification using low-dose CT-guided anatomic standardization
- PMID: 34905145
- PMCID: PMC8671596
- DOI: 10.1186/s13550-021-00867-7
Amyloid PET quantification using low-dose CT-guided anatomic standardization
Abstract
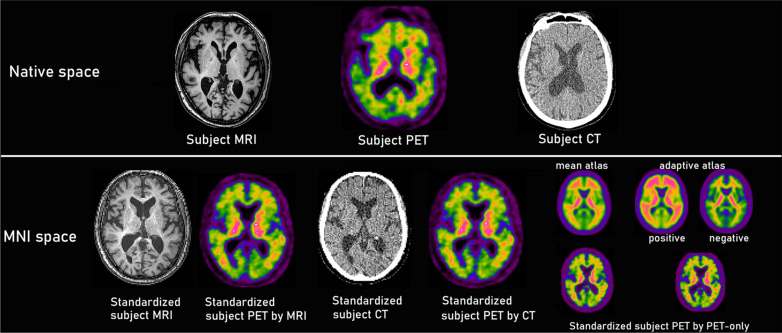
Background: Centiloid (CL) scaling has become a standardized quantitative measure in amyloid PET because it facilitates the direct comparison of results across institutions, even when different analytical methods or tracers are used. Standard volumes of interest must be used to calculate the CL scale after the anatomic standardization of amyloid PET images using coregistered MRI; if the MRI is unavailable, the CL scale cannot be accurately calculated. This study sought to determine the substitutability of low-dose CT, which is used to correct PET attenuation in PET/CT equipment, by evaluating the measurement accuracy when low-dose CT is used as an alternative to MRI in the calculation of the CL scale. Amyloid PET images obtained using 18F-flutemetamol from 24 patients with possible or probable Alzheimer's disease were processed to calculate the CL scale using 3D T1-weighted MRI and low-dose CT of PET/CT. CLMRI and CLCT were, respectively, defined as the use of MRI and CT for anatomic standardization and compared. Regional differences in the CT-based and MRI-based standardized anatomic images were also investigated.
Trial registration: Japan Registry of Clinical Trials, jRCTs031180321 (registered 18 March 2019, https://jrct.niph.go.jp/latest-detail/jRCTs031180321 ).
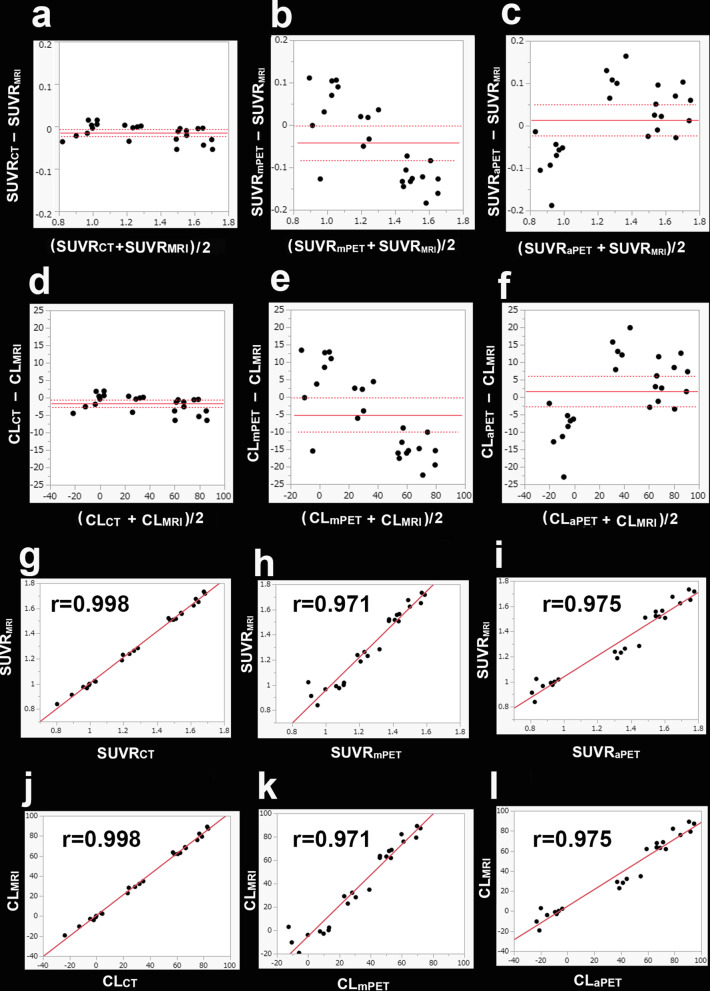
Results: A Bland-Altman plot showed that CLCT was slightly but significantly underestimated (mean ± standard deviation, - 1.7 ± 2.4; p < 0.002) compared with CLMRI. The 95% limits of agreement ranged from - 2.8 to - 0.7. Pearson correlation analysis showed a highly significant correlation of r = 0.998 between CLCT and CLMRI (p < 0.001). The linear regression equation was CLMRI = 1.027 × CLCT + 0.762. In a Bland-Altman plot, Spearman correlation analysis did not identify a significant association between the difference in CLMRI versus CLCT and CL load (ρ = - 0.389, p = 0.060). This slight underestimation of CLCT may derive from slightly higher uptake when the cerebellum is used as a reference area in CT-based anatomically standardized PET images versus MRI-based images.
Conclusions: Low-dose CT of PET/CT can substitute for MRI in the anatomic standardization used to calculate the CL scale from amyloid PET, although a slight underestimation occurs.
Keywords: Alzheimer’s disease; Amyloid imaging; Centiloid scale; Computed tomography; Magnetic resonance imaging; Positron emission tomography.
© 2021. The Author(s).
Conflict of interest statement
H. Matsuda has received a research grant from Nihon Medi-Physics Co., Ltd. All other authors declare that they have no competing interests.
Figures


Similar articles
-
Development of software for measuring brain amyloid accumulation using 18 F-florbetapir PET and calculating global Centiloid scale and regional Z-score values.Brain Behav. 2023 Jul;13(7):e3092. doi: 10.1002/brb3.3092. Epub 2023 Jun 7. Brain Behav. 2023. PMID: 37287410 Free PMC article.
-
Software development for quantitative analysis of brain amyloid PET.Brain Behav. 2022 Mar;12(3):e2499. doi: 10.1002/brb3.2499. Epub 2022 Feb 8. Brain Behav. 2022. PMID: 35134278 Free PMC article.
-
Differential centiloid scale normalization techniques: comparison between hybrid PET/MRI and independently acquired MRI.Ann Nucl Med. 2024 Oct;38(10):835-846. doi: 10.1007/s12149-024-01955-z. Epub 2024 Jun 20. Ann Nucl Med. 2024. PMID: 38902587
-
Quantitative Evaluation of 18F-Flutemetamol PET in Patients With Cognitive Impairment and Suspected Alzheimer's Disease: A Multicenter Study.Front Neurol. 2021 Jan 13;11:578753. doi: 10.3389/fneur.2020.578753. eCollection 2020. Front Neurol. 2021. PMID: 33519667 Free PMC article.
-
Centiloid scaling for quantification of brain amyloid with [18F]flutemetamol using multiple processing methods.EJNMMI Res. 2018 Dec 5;8(1):107. doi: 10.1186/s13550-018-0456-7. EJNMMI Res. 2018. PMID: 30519791 Free PMC article.
Cited by
-
Development of software for measuring brain amyloid accumulation using 18 F-florbetapir PET and calculating global Centiloid scale and regional Z-score values.Brain Behav. 2023 Jul;13(7):e3092. doi: 10.1002/brb3.3092. Epub 2023 Jun 7. Brain Behav. 2023. PMID: 37287410 Free PMC article.
-
Non-standard pipeline without MRI has replicability in computation of Centiloid scale values for PiB and 18F-labeled amyloid PET tracers.Neuroimage Rep. 2022 May 21;2(3):100101. doi: 10.1016/j.ynirp.2022.100101. eCollection 2022 Sep. Neuroimage Rep. 2022. PMID: 40567305 Free PMC article.
-
Comparison of consistency in centiloid scale among different analytical methods in amyloid PET: the CapAIBL, VIZCalc, and Amyquant methods.Ann Nucl Med. 2024 Jun;38(6):460-467. doi: 10.1007/s12149-024-01919-3. Epub 2024 Mar 21. Ann Nucl Med. 2024. PMID: 38512444 Free PMC article.
-
Deep Learning-Driven Estimation of Centiloid Scales from Amyloid PET Images with 11C-PiB and 18F-Labeled Tracers in Alzheimer's Disease.Brain Sci. 2024 Apr 21;14(4):406. doi: 10.3390/brainsci14040406. Brain Sci. 2024. PMID: 38672055 Free PMC article.
References
LinkOut - more resources
Full Text Sources
