

N-terminal prohormone B-type natriuretic peptide variability acts as a predictor of poor prognosis in patients with cardiorenal syndrome type 2
- PMID: 34905428
- PMCID: PMC8810077
- DOI: 10.1080/21655979.2021.2005219
N-terminal prohormone B-type natriuretic peptide variability acts as a predictor of poor prognosis in patients with cardiorenal syndrome type 2
Abstract
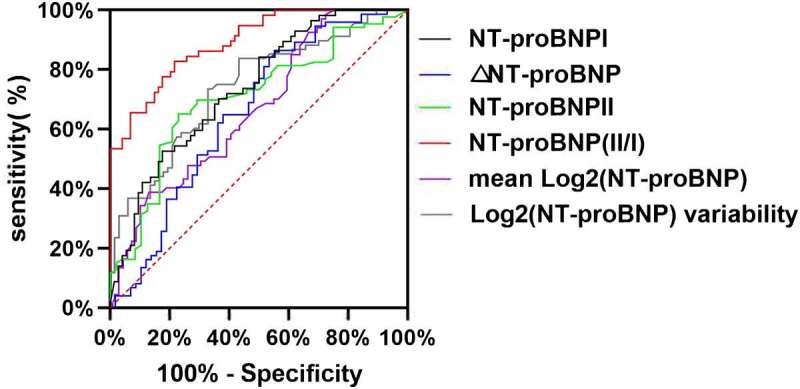
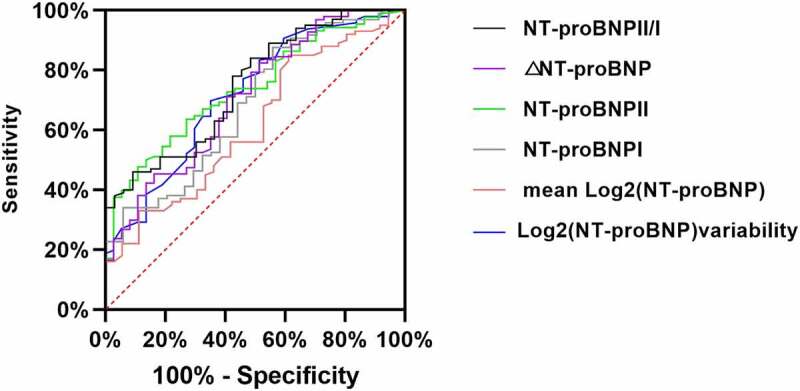
This study aims to explore the effect of N-terminal pro-brain natriuretic peptide (NT-proBNP) variability (mean absolute difference of the log2 NT-proBNP level measured in hospital) on the prognosis of patients with cardiorenal syndrome (CRS) type 2. Patients with CRS type 2 were retrospectively included. The varied NT-proBNP indications were analyzed. They were NT-proBNP I(pre-treatment), NT-proBNP II(post-treatment), NT-proBNP II/I, ΔNT-proBNP, log2 (NT-proBNP) variability and mean log2 (NT-proBNP). A logistic regression model and survival curves (Kaplan-Meier analysis) were built to identify independent predictors associated with poor prognosis. The primary outcomes were major adverse renal and cardiac events. The secondary outcome was all-cause mortality. From 2012 to 2016, 136 patients were included in this study with 69 (50.7%) had high log2 (NT-proBNP) variability level. The optimal cutoff level for each NT-proBNP indication that predicts poor prognosis was calculated, and the area under curves ranged from 0.668 to 0.891 with different indications. Kaplan-Meier analysis revealed that there was significantly correlated with prevalence of primary outcomes and NT-proBNP variability. The hazard ratios (HRs) ranged from 1.67 to 6.61 with different indications. The multivariate regression analyses also identified the risk of the primary outcomes were associated with elevated NT-proBNP values, except NT-proBNP I. The odds ratio (ORs) ranged from 1.83 to 6.61 with different indications. When analyzing the relationship between NT-proBNP variability and all-cause mortality, the results were the same. NT-proBNP variability might serve as an independent predictor for poor prognosis and all-cause mortality in patients with CRS type 2.
Keywords: NT-proBNP variability; adverse outcomes; cardiorenal syndrome.
Conflict of interest statement
No potential conflict of interest was reported by the author(s).
Figures


Similar articles
-
Prognostic value of N-terminal prohormone brain natriuretic peptide for in-hospital and long-term outcomes in patients with infective endocarditis.Eur J Prev Cardiol. 2017 May;24(7):676-684. doi: 10.1177/2047487316686436. Epub 2017 Jan 9. Eur J Prev Cardiol. 2017. PMID: 28067531
-
N-terminal pro-B-type natriuretic peptide-ratio predicts mortality after transcatheter aortic valve replacement.Catheter Cardiovasc Interv. 2015 Jun;85(7):1240-7. doi: 10.1002/ccd.25788. Epub 2015 Jan 19. Catheter Cardiovasc Interv. 2015. PMID: 25511571
-
The Molar Ratio of N-terminal pro-B-type Natriuretic Peptide/B-type Natriuretic Peptide for Heart Failure-related Events in Stable Outpatients with Cardiovascular Risk Factors.Intern Med. 2018 Sep 15;57(18):2621-2630. doi: 10.2169/internalmedicine.0471-17. Epub 2018 Apr 27. Intern Med. 2018. PMID: 29709934 Free PMC article.
-
Cardiorenal status using amino-terminal pro-brain natriuretic peptide and cystatin C on cardiac resynchronization therapy outcomes: From the BIOCRT Study.Heart Rhythm. 2019 Jun;16(6):928-935. doi: 10.1016/j.hrthm.2018.12.023. Epub 2018 Dec 24. Heart Rhythm. 2019. PMID: 30590191 Free PMC article.
-
Association of NT-proBNP and BNP With Future Clinical Outcomes in Patients With ESKD: A Systematic Review and Meta-analysis.Am J Kidney Dis. 2020 Aug;76(2):233-247. doi: 10.1053/j.ajkd.2019.12.017. Epub 2020 May 6. Am J Kidney Dis. 2020. PMID: 32387090
Cited by
-
Prognostic value of NT-proBNP and uric acid in acute ST-segment elevation myocardial infarction patients after complete revascularization.Am J Transl Res. 2024 Aug 15;16(8):4182-4189. doi: 10.62347/VQWS9174. eCollection 2024. Am J Transl Res. 2024. PMID: 39262692 Free PMC article.
-
The history and mystery of sacubitril/valsartan: From clinical trial to the real world.Front Cardiovasc Med. 2023 Mar 28;10:1102521. doi: 10.3389/fcvm.2023.1102521. eCollection 2023. Front Cardiovasc Med. 2023. PMID: 37057101 Free PMC article. Review.
-
Different doses of atorvastatin in the treatment of patients with cardiorenal syndrome Type-2: A retrospective cohort study.Pak J Med Sci. 2024 Mar-Apr;40(4):568-571. doi: 10.12669/pjms.40.4.8706. Pak J Med Sci. 2024. PMID: 38545029 Free PMC article.
-
Predictor and prognostic modeling in cardiorenal syndrome type 2: a retrospective study of multicenter.Biomark Med. 2025 Jun;19(12):491-499. doi: 10.1080/17520363.2025.2520738. Epub 2025 Jun 16. Biomark Med. 2025. PMID: 40521649
-
Atrial Cardiomyopathy Predicts the Functional Outcome and Mortality in Stroke Patients.J Atheroscler Thromb. 2024 Oct 1;31(10):1416-1426. doi: 10.5551/jat.64756. Epub 2024 Apr 19. J Atheroscler Thromb. 2024. PMID: 38644203 Free PMC article.
References
-
- Ponikowski P, Voors AA, Anker SD, et al. ESC guidelines for the diagnosis and treatment of acute and chronic heart failure: the task force for the diagnosis and treatment of acute and chronic heart failure of the European Society of Cardiology (ESC)developed with the special contribution of the Heart Failure Association (HFA) of the ESC. Eur Heart J. 2016. [2016];37(27):2129–2200. - PubMed
-
- Filippatos G, Farmakis D, Parissis J.. Renal dysfunction and heart failure: things are seldom what they seem. Eur Heart J. 2014;35(7):416–418. - PubMed
-
- Damman K, Valente MA, Voors AA, et al. Renal impairment, worsening renal function, and outcome in patients with heart failure: an updated meta-analysis. Eur Heart J. 2014;35(7):455–469. - PubMed
-
- Ronco C, Haapio M, House AA, et al. Cardiorenal syndrome. J Am Coll Cardiol. 2008;52(19):1527–1539. - PubMed
-
- Ronco C, Bellasi A, Di Lullo L.. Cardiorenal syndrome: an overview. Adv Chronic Kidney Dis. 2018;25(5):382–390. - PubMed
Publication types
MeSH terms
Substances
LinkOut - more resources
Full Text Sources
Other Literature Sources
Research Materials