. 2021 Dec 1;148(23):dev199465.
doi: 10.1242/dev.199465. Epub 2021 Dec 14.

DamID transcriptional profiling identifies the Snail/Scratch transcription factor Kahuli as an Alk target in the Drosophila visceral mesoderm

Affiliations

DamID transcriptional profiling identifies the Snail/Scratch transcription factor Kahuli as an Alk target in the Drosophila visceral mesoderm

Patricia Mendoza-Garcia et al. Development. .

Abstract

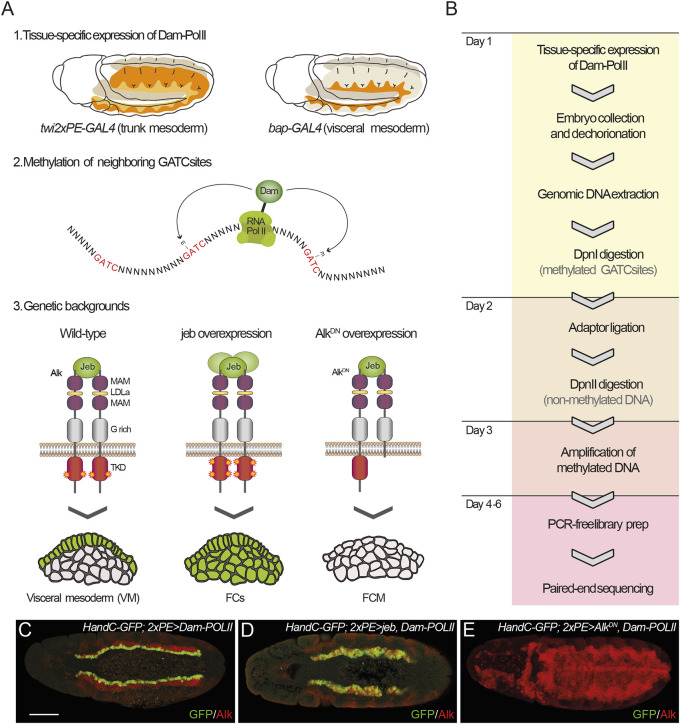
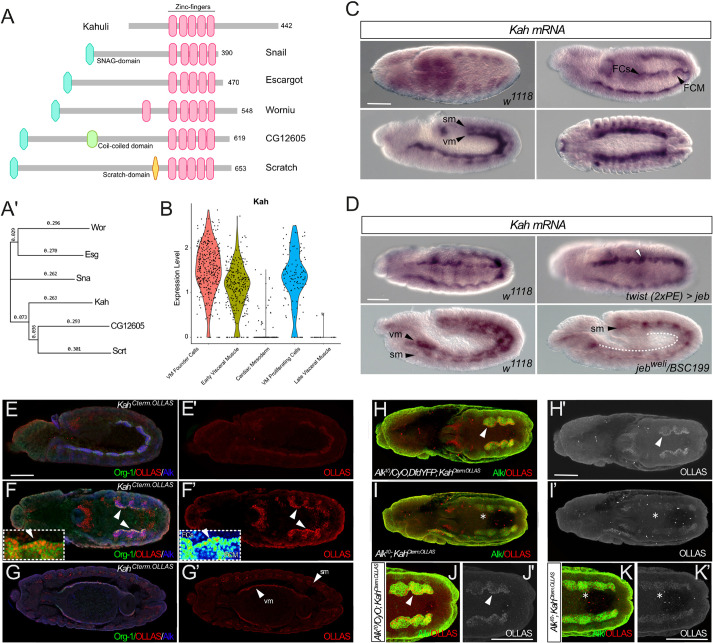
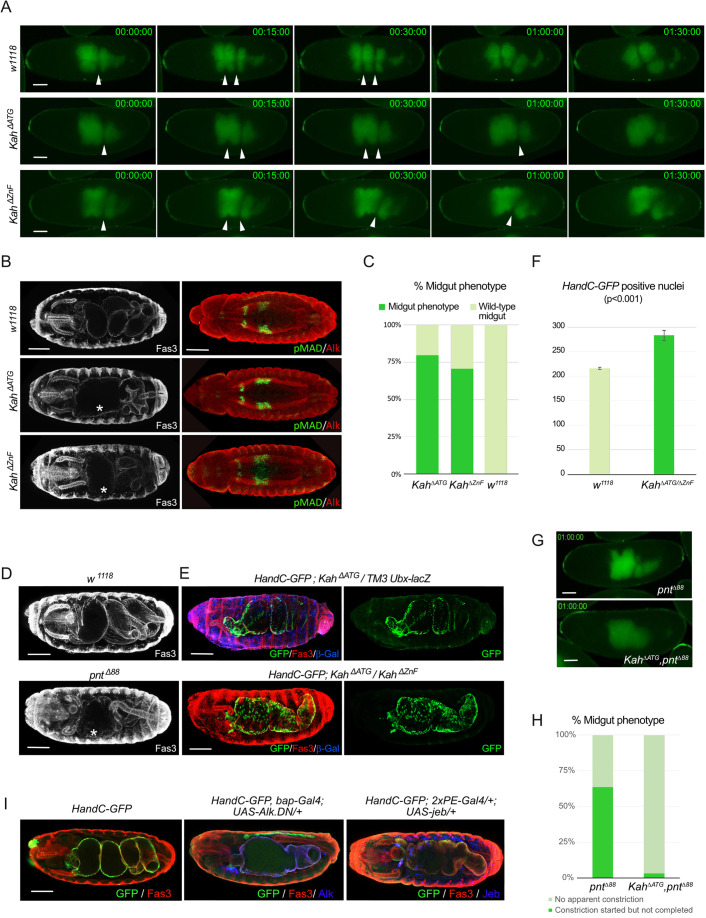
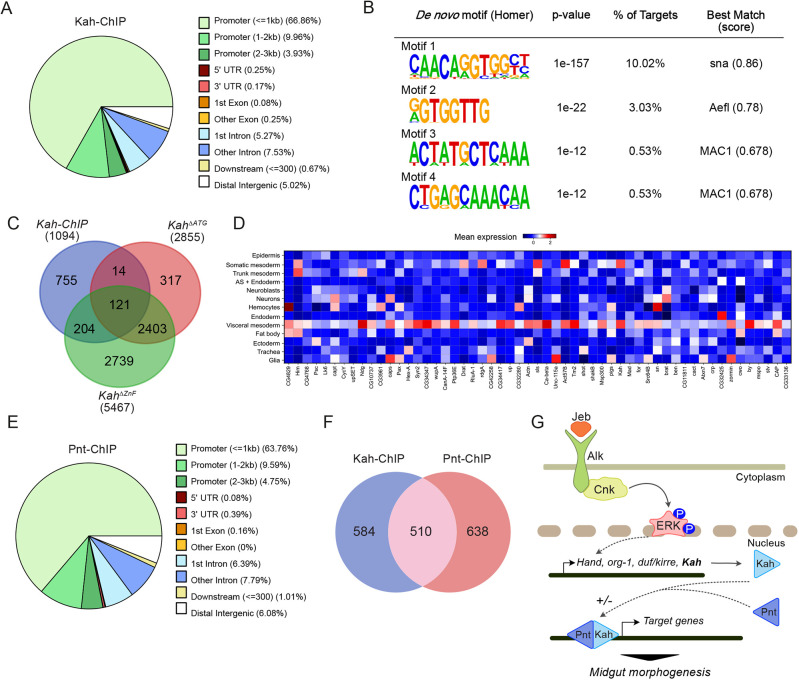
Development of the Drosophila visceral muscle depends on Anaplastic Lymphoma Kinase (Alk) receptor tyrosine kinase (RTK) signaling, which specifies founder cells (FCs) in the circular visceral mesoderm (VM). Although Alk activation by its ligand Jelly Belly (Jeb) is well characterized, few target molecules have been identified. Here, we used targeted DamID (TaDa) to identify Alk targets in embryos overexpressing Jeb versus embryos with abrogated Alk activity, revealing differentially expressed genes, including the Snail/Scratch family transcription factor Kahuli (Kah). We confirmed Kah mRNA and protein expression in the VM, and identified midgut constriction defects in Kah mutants similar to those of pointed (pnt). ChIP and RNA-Seq data analysis defined a Kah target-binding site similar to that of Snail, and identified a set of common target genes putatively regulated by Kah and Pnt during midgut constriction. Taken together, we report a rich dataset of Alk-responsive loci in the embryonic VM and functionally characterize the role of Kah in the regulation of embryonic midgut morphogenesis.

Keywords: ChIP; ETS; Jelly belly; Midgut constriction; Pointed; Signaling; Single cell; TaDa.


Conflict of interest statement

Competing interests The authors declare no competing or financial interests.

Figures

Fig. 1.
Fig. 1.
Transcriptional profiling of Alk targets in the VM by TaDa. (A) Schematic outlining the TaDa experimental approach. bap-GAL4 and twi.2xPE-GAL4 were used to drive tissue-specific expression of Dam-PolII (1), leading to methylation of GATC sequences throughout the genome (2). TaDa analyses were performed in conditions of wild-type, activated (via jeb overexpression) and inhibition of Alk signaling (via dominant-negative Alk.DN overexpression) (3). (B) Experimental flow-chart from TaDa expression to library preparation and sequencing. (C-E) HandC-GFP reporter gene expression in the genetic backgrounds outlined in A3 that were included in TaDa analyses. (C) Wild-type embryos exhibit HandC-GFP expression in the ventral-most FC row. (D) Expression of Jeb with twi2xPE-Gal4 leads to ectopic HandC-GFP expression in all VM cells. (E) HandC-GFP expression is non-detectable in VM of twi2xPE-Gal4>AlkDN embryos. Scale bar: 50 µm.
Fig. 2.
Fig. 2.
Significant peaks and associated genes identified by TaDa. (A-E) LogFC of reads mapped to GATCs obtained by comparing UAS-Alk.DN samples against Dam-Pol II samples separately for bap-GAL4 (Bap) and twi.2xPE-GAL4 (Twi) samples. Peaks were built by clustering GATC sites at median GATC fragment distance for the Drosophila genome. LogFC represents the mean logFC of all GATCs falling inside the peak. (A) Distribution of peaks formed by clustering, expressed as number of GATC sites per peak. (B) Each gene was assigned an overlapping peak with a minimum FDR value, and both logFC and FDR for the assigned peaks are shown as a volcano plot. Genes of interest and known Alk transcriptional targets, such as Hand, kirre, org-1 and dpp, are indicated. For details see Table S1. (C) Venn diagram indicating the number of genes associated with peaks at FDR<0.01 for bap-GAL4 (bap) and twi.2xPE-GAL4 (Twi) TaDa datasets. (D) Genes associated with Bap and Twi peaks (FDR<0.01) are enriched for TFs, compared with the remaining set of genes in both instances (Fisher test, P<2e-16). For details, see Table S1. (E) Enrichment of GO terms and KEGG pathways (FDR<0.05) for genes associated with significant peaks for bap-GAL4 (bap) and twi.2xPE-GAL4 (Twi) TaDa datasets.
Fig. 3.
Fig. 3.
Validation of selected TaDa-identified gene expression in the VM. (A-F) Dam-PolII occupancy of selected candidate loci using bap- and twi.2xPE-GAL4 drivers. Known Alk transcriptional targets, Hand (A) and org-1 (B), are shown together with TaDa candidates CG11658 (C), fax (D), Kah (E) and Sumo (F). Y-axes represent logFC between UAS-Dam-PolII (reference) and UAS-Dam-PolII, UAS-jeb or UAS-Dam-PolII, UAS-Alk.DN samples. (A′-F′) Expression patterns of candidate genes at stage 13. HandC-GFP expression (A′) and Org1 protein (B′) are shown, together with mRNA in situ of CG11658 (C′), fax (D′), Kah (E′) and Sumo (F′). Scale bars: 50 µm.
Fig. 4.
Fig. 4.
TaDa-identified Alk targets are enriched in the visceral mesoderm. (A) Schematic outline of embryonic scRNA-seq workflow. (B) UMAP plot displaying the cellular heterogeneity of whole embryo scRNA-seq as 13 cell clusters. (C) Dendrogram representing the relationship between the clusters. (D) Dot plot highlighting increased expression of factors involved in VM development, such as bin, bap, org-1, Hand and Fas3 in the VM cell population cluster. (E) UMAP projection representing the five clusters of HandC-GFP-positive, FACS-sorted cells. (F) Correlation between the clusters across the population of the HandC-GFP dataset (Pearson's). (G) Heatmap indicating relative expression of TaDa-identified targets downstream of Alk in HandC-GFP-positive cells, highlighting low expression within the cardiac mesoderm population. (H) Dot plot representing the top canonical markers for the HandC-GFP scRNA-seq dataset, highlighting VM, cell cycle, muscle and cardiac markers. Expression levels are visualized as mean expression (red gradient, key below), as well as the fraction of cells in a group (dot size, key below).
Fig. 5.
Fig. 5.
Kahuli is expressed in developing visceral and somatic mesoderm. (A) Schematic indicating domain structure of the Drosophila Snail/Scratch family members Kahuli, Snail, Escargot, Wornoi, CG12605 and Scratch. SNAIL/Gfi-1 (SNAG, blue), coiled-coil (green) and zinc-finger (pink) domains are shown. (A′) Phylogenetic tree indicating the relationship between Kah and Snail/Scratch family members in Drosophila. (B) Violin plots from scRNA-seq analysis of FACS-sorted Hand-GFP-expressing cells reveals expression of Kah mRNA in VM FC, early visceral muscle and VM proliferating cells, but not in cardiac mesoderm or late visceral muscle. (C) Kah transcripts are abundant in SM and VM during embryogenesis, with increased expression levels in the visceral FC row. FC, founder cell; FCM, fusion competent myoblasts; sm, somatic mesoderm; vm, visceral mesoderm. (D) twi.2xPE-GAL4-driven Jeb expression results in increased Kah expression in VM cells (white arrowhead). Conversely, animals devoid of Jeb/Alk signaling (jebweli mutants) lack the strong FC-specific Kah expression in the VM (dotted line), while SM expression remains unaltered. (E-G′) Endogenously tagged KahCterm.OLLAS is enriched in, but not exclusive to, visceral FCs (FCs marked by Org-1 in green, OLLAS in red, Alk in blue). (E,E′) KahCterm.OLLAS embryos, lateral view, stage 11/12. (F,F′) KahCterm.OLLAS embryos, dorsal view, stage 11/12. Insets depict higher magnification of KahOLLAS (F, KahOLLAS in red, Alk in green; F′, KahOLLAS in LUT colors). Arrowheads indicate the visceral FC row. (G,G′) KahCterm.OLLAS embryos, dorsal view, stage 13. KahCterm.OLLAS is present in both the visceral and somatic muscles (vm and sm, marked with arrowheads). (H-K′) Endogenously tagged KahCterm.OLLAS in Alk10 mutant background. OLLAS in red (H,I,J,K) or white (H′,I′,J′,K′), Alk in green. (H,H′) KahCterm.OLLAS protein is enriched in visceral FCs of controls (arrowheads in H,H′ and J,J′), higher magnification in J,J′. (I,I′) KahCterm.OLLAS protein is still detected in the VM of Alk10 mutants (asterisks in I,I′ and K,K′), although the enrichment observed in FCs of control embryos is not observed; higher magnification shown in K,K′. Scale bars: 50 µm.
Fig. 6.
Fig. 6.
RNA-seq analysis identifies Kah target genes. (A) Schematic overview of Kah alleles: KahCterm.OLLAS, KahΔATG, KahΔZnF and Kahf06749. Exon structure is depicted, highlighting protein coding regions (gray) and zinc-finger domains (red). (B) Dorsal views of stage 10–11 control [Df(3L)Exel6085/TM3,Ubx-lacZ] and Kah mutant [Kahf06749/Df(3L)Exel6085, KahΔATG and KahΔZnF] embryos stained with Alk (green), the FC-marker Org-1 (red), Fas3 (blue) and β-gal [blue, in control Df(3L)Exel6085/TM3,Ubx-lacZ]. (C,D) Volcano plots of differential gene expression measured in RNA-seq from KahΔATG and KahΔZnF mutant embryos. See Table S2 for detailed results. Dashed lines indicate differential gene expression thresholds [FC≥1.5 and ≤−1.5 (log2FC≥0.59 and ≤−0.59)] for up- and downregulated genes respectively (Padj≤0.05). Up- or downregulated genes are indicated in red or blue, respectively. A selection of differentially expressed genes are labeled. (E) Venn diagrams indicating the number of differentially expressed genes observed in KahΔATG and KahΔZnF mutants. Top panel, all significantly differentially expressed genes; lower left panel, significantly differentially expressed upregulated genes; lower right panel, significantly differentially expressed downregulated genes. (F) Correlation between the significantly differentially expressed genes (2524) observed in KahΔATG and KahΔZnf mutants. Thresholds used to determine differential expression are indicated by dashed lines [FC≥1.5 and ≤−1.5 (log2FC≥0.59 and ≤−0.59), and Padj≤0.05]. Pearson correlation coefficient is indicated in the lower right corner. (G) Heatmap detailing expression of genes in enriched pathways, such as Dpp, Toll, Notch and Hedgehog (Hh) in KahΔATG and KahΔZnf mutants, compared with controls (Ctrl). Color key indicates expression levels. Scale bar: 50 µm.
Fig. 7.
Fig. 7.
Kah mutants exhibit defects in midgut constriction. (A) Live imaging of control (w1118) embryos at stage 16 identifies three midgut constrictions, while Kah mutants (KahΔATG and KahΔZnF) fail to form the first midgut constriction (arrowheads indicate constrictions). Representative frames are shown (see Movies 5-7). (B) Midgut constriction defects in KahΔATG and KahΔZnF are not due to defective Mad signaling. Fas3 (white) highlights midgut structure at stage 16, while anti-pMAD (red) visualizes Mad signaling at stage 13/14; Alk identifies VM (green). Dorsal views. Asterisk indicates midgut constriction phenotype. (C) Quantification of the midgut constriction phenotype observed in KahΔATG (n=89) and KahΔZnF (n=109) mutants. (D) pntΔ88 mutants display a midgut constriction phenotype similar to that observed in Kah mutants. Fas3 (white) highlights midgut structure; dorsal views. Asterisk indicates midgut constriction phenotype. (E) Kah mutants display abnormal midgut musculature organization, visualized with HandC-GFP (green). Lateral views. (F) Quantification of HandC-GFP-positive nuclei present in wild-type (w1118, n=30) and KahΔATG/KahΔZnF (n=30) mutants, P<0.001. (G) Representative images from live imaging of pntΔ88 and KahΔATGpntΔ88 mutant embryos (see Movies 8 and 9). (H) Quantification of pntΔ88 (n=22) and KahΔATGpntΔ88 (n=31) mutant midgut constriction phenotypes, indicating the increased severity midgut constriction phenotypes observed in KahΔATGpntΔ88 double mutants. (I) Midgut morphology of representative stage 16 HandC-GFP control, HandC-GFP, bap3-Gal4; UAS-Alk.DN/+ and HandC-GFP; 2xPE-Gal4; UAS-jeb/+ embryos stained for Fas3 (red) and GFP (green). Transgene expression (blue) is revealed by Alk or Jeb antibody staining, as indicated. Scale bars: 50 µm.
Fig. 8.
Fig. 8.
ChIP analysis identifies a Kah putative binding site and putative common targets of Kah and Pnt. (A) Genomic location distribution in the Kah-ChIP dataset. Pie chart indicating different genomic regions statistically enriched in Kah-ChIP relative to promoter, UTR, intron/exon and other regions (see key). Promoter regions (≤1 kb) are heavily represented. Data were extracted from Roy et al. (2010). (B) Analysis of motif enrichments in regions of 50 bp around the peak center identifies a putative Kah-binding motif highly related to the Sna-binding motif. (C) Venn diagram showing the overlap between Kah-ChIP and Kah mutant RNA-seq datasets (details in Table S2). (D) Matrix-plot visualizing expression levels for genes common to Kah-ChIP, Pnt-ChIP and Kah mutant RNA-seq datasets that were represented in the whole embryo scRNA-seq dataset. (E) Pie-chart indicating Pnt ChIP-seq peak locations in the genome, relative to promoter, UTR, intron/exon and other regions (key at right). Promoter regions (≤1 kb) are heavily represented. Data extracted from Roy et al. (2010). (F) Venn diagram showing the proportion of overlapping genes between Kah- and Pnt-ChIP datasets. Details in Table S2. (G) Model for Alk-mediated regulation of embryonic VM development involving Kah and Pnt. Alk activation in the VM is driven by Jeb binding, which induces signaling and activates the transcription of FC-specific genes, including Hand, org-1, duf/kirre and Kah. Kah may work in concert with other transcriptional regulators, such as Pnt, to target genes involved in the formation of the first midgut constriction.

Similar articles

Cited by

References

    1. Abed, M., Bitman-Lotan, E. and Orian, A. (2018). The biology of SUMO-targeted ubiquitin ligases in Drosophila development, immunity, and cancer. J. Dev. Biol. 6, 2. 10.3390/jdb6010002 - DOI - PMC - PubMed
    1. Anders, S. and Huber, W. (2010). Differential expression analysis for sequence count data. Genome Biol. 11, R106. 10.1186/gb-2010-11-10-r106 - DOI - PMC - PubMed
    1. Aughey, G. N. and Southall, T. D. (2016). Dam it's good! DamID profiling of protein-DNA interactions. Wiley Interdiscip. Rev. Dev. Biol. 5, 25-37. 10.1002/wdev.205 - DOI - PMC - PubMed
    1. Barad, M., Erlebacher, A. and McGinnis, W. (1991). Despite expression in embryonic visceral mesoderm, H2.0 is not essential for Drosophila visceral muscle morphogenesis. Dev. Genet. 12, 206-211. 10.1002/dvg.1020120305 - DOI - PubMed
    1. Bazigou, E., Apitz, H., Johansson, J., Lorén, C. E., Hirst, E. M. A., Chen, P.-L., Palmer, R. H. and Salecker, I. (2007). Anterograde Jelly belly and Alk receptor tyrosine kinase signaling mediates retinal axon targeting in Drosophila. Cell 128, 961-975. 10.1016/j.cell.2007.02.024 - DOI - PubMed

Publication types

MeSH terms