. 2022 Jan 4;145(1):45-60.
doi: 10.1161/CIRCULATIONAHA.121.054976. Epub 2021 Dec 14.

Mechanisms of Sinoatrial Node Dysfunction in Heart Failure With Preserved Ejection Fraction

Affiliations

Mechanisms of Sinoatrial Node Dysfunction in Heart Failure With Preserved Ejection Fraction

Thassio Mesquita et al. Circulation. .

Abstract

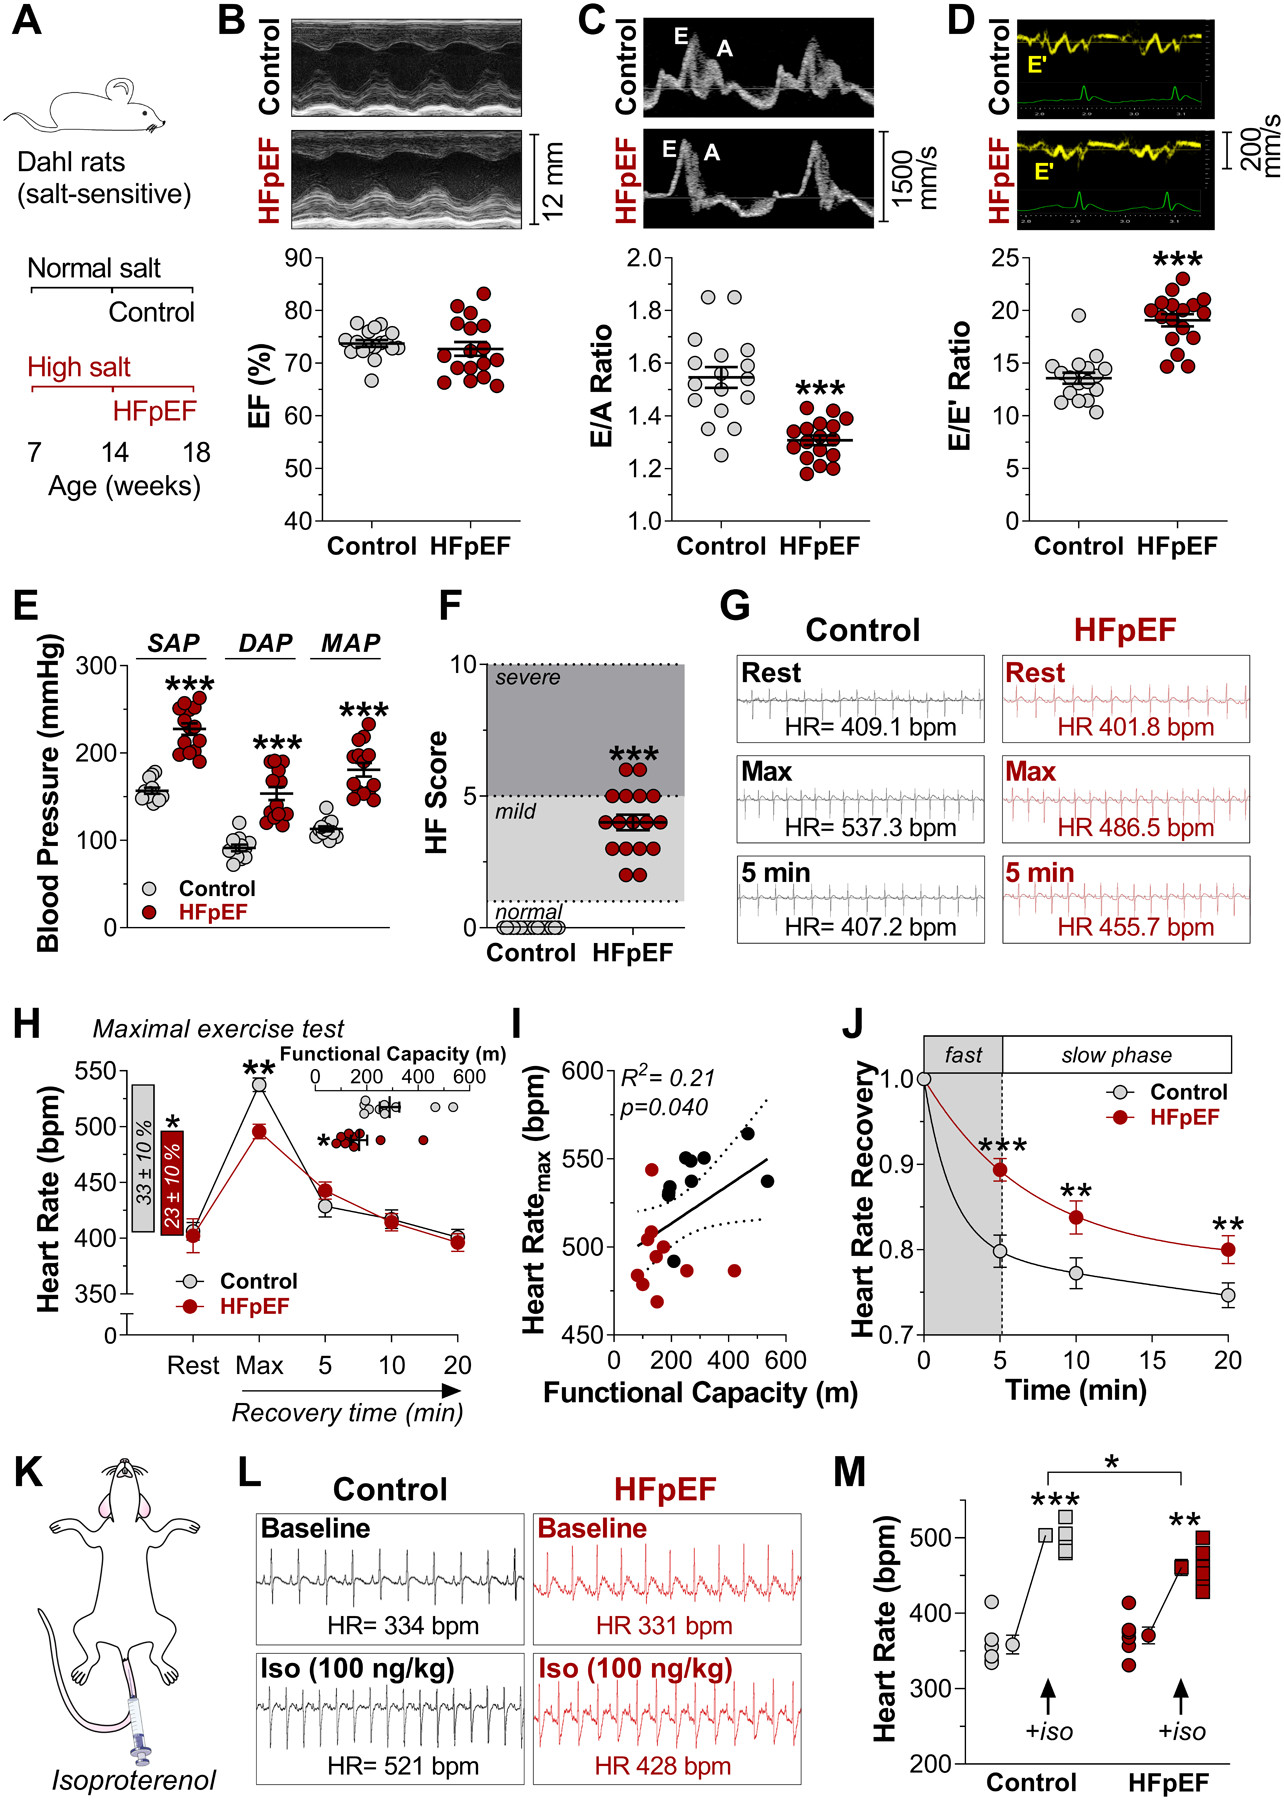
Background: The ability to increase heart rate during exercise and other stressors is a key homeostatic feature of the sinoatrial node (SAN). When the physiological heart rate response is blunted, chronotropic incompetence limits exercise capacity, a common problem in patients with heart failure with preserved ejection fraction (HFpEF). Despite its clinical relevance, the mechanisms of chronotropic incompetence remain unknown.

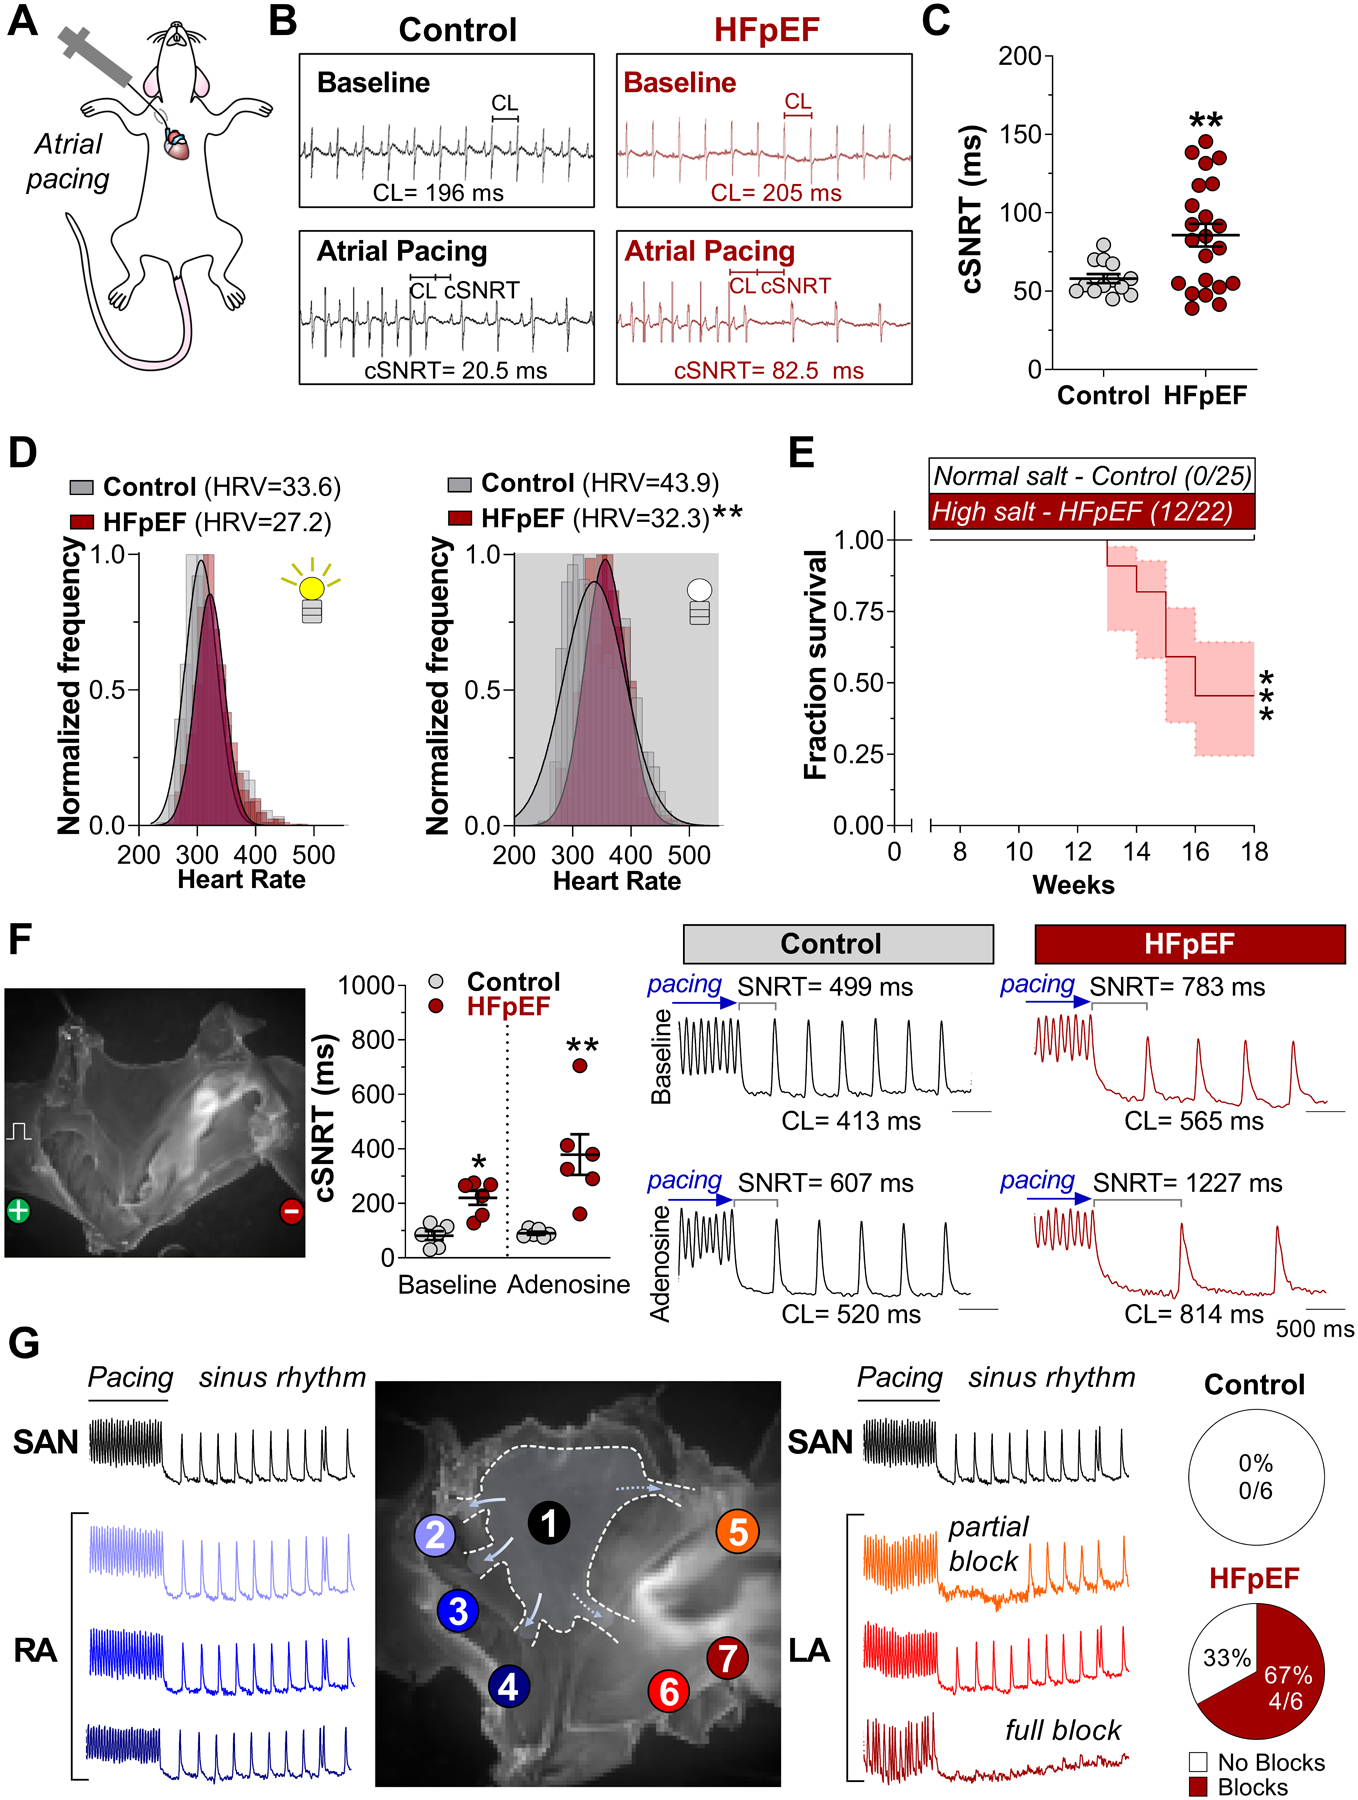
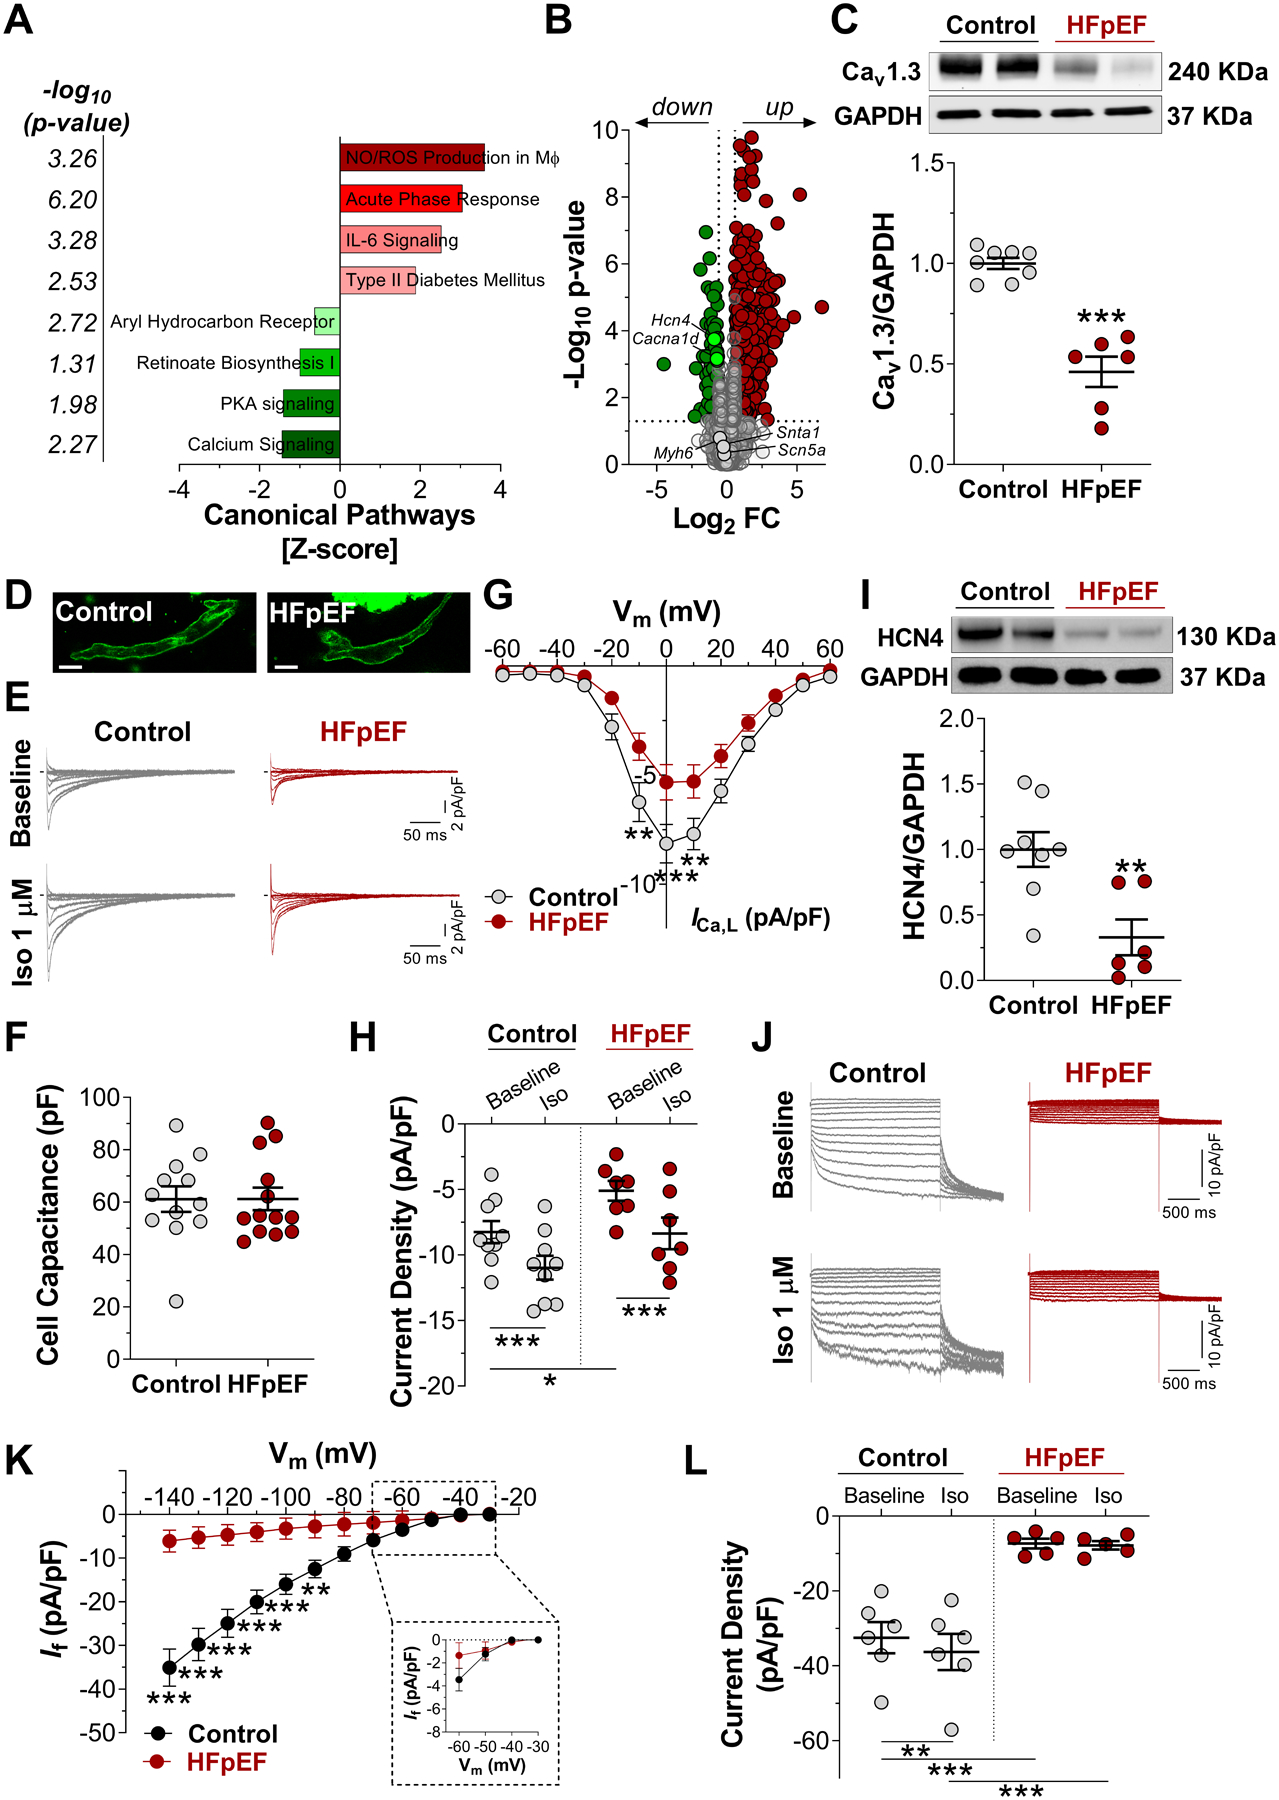
Methods: Dahl salt-sensitive rats fed a high-salt diet and C57Bl6 mice fed a high-fat diet and an inhibitor of constitutive nitric oxide synthase (Nω-nitro-L-arginine methyl ester [L-NAME]; 2-hit) were used as models of HFpEF. Myocardial infarction was created to induce HF with reduced ejection fraction. Rats and mice fed with a normal diet or those that had a sham surgery served as respective controls. A comprehensive characterization of SAN function and chronotropic response was conducted by in vivo, ex vivo, and single-cell electrophysiologic studies. RNA sequencing of SAN was performed to identify transcriptomic changes. Computational modeling of biophysically-detailed human HFpEF SAN was created.

Results: Rats with phenotypically-verified HFpEF exhibited limited chronotropic response associated with intrinsic SAN dysfunction, including impaired β-adrenergic responsiveness and an alternating leading pacemaker within the SAN. Prolonged SAN recovery time and reduced SAN sensitivity to isoproterenol were confirmed in the 2-hit mouse model. Adenosine challenge unmasked conduction blocks within the SAN, which were associated with structural remodeling. Chronotropic incompetence and SAN dysfunction were also found in rats with HF with reduced ejection fraction. Single-cell studies and transcriptomic profiling revealed HFpEF-related alterations in both the "membrane clock" (ion channels) and the "Ca2+ clock" (spontaneous Ca2+ release events). The physiologic impairments were reproduced in silico by empirically-constrained quantitative modeling of human SAN function.

Conclusions: Chronotropic incompetence and SAN dysfunction were seen in both models of HF. We identified that intrinsic abnormalities of SAN structure and function underlie the chronotropic response in HFpEF.

Keywords: arrhythmias, cardiac; heart failure; heart rate; sinoatrial node.


Figures

Figure 1.
Figure 1.. Cardinal exercise intolerance and chronotropic incompetence of HFpEF phenotyping are associated with lower β-AR responsiveness.
A: Experimental design. Dahl salt-sensitive rats were maintained on a normal salt (0.4%) or high salt (8%) dietary regimens from 7 weeks of age and HFpEF verified between 14–18 weeks old. B: Representative left ventricular M-mode echocardiographic images (top) of ejection fraction (EF) analysis (bottom). C: Representative images (top) of pulse-wave Doppler showing E (early filling)– and A (atrial filling)–wave changes (bottom). D: Representative images (top) of tissue Doppler describing E′- and A′-wave changes (bottom). E: Noninvasive blood pressure measurements. DAP = diastolic arterial pressure; MAP = mean arterial pressure; SAP = systolic arterial pressure. F: Heart failure (HF) score defined by the following parameters: appearance, breathing, mobility, edema, and weight. G: Representative telemetry ECG recordings. H: Resting, maximal, and recovery of heart rate in response to exercise test (inset, functional capacity measured as the total running distance). n = 10 animals in each group. I: Relationship between functional capacity and maximal heart rate response (Pearson coefficient). Data are fit by linear regression; dashed lines represent 95% confidence. J: Heart rate recovery time after the maximal exercise test, data are fit by two exponential decay. K: In vivo isoproterenol (Iso) stress testing was used to determine the chronotropic reserve. L: Representative ECG recordings. M: Quantification of β-adrenergic–induced heart rate (HR) increase. Data are expressed as mean ± SEM. Unpaired Student t-test (B-F, and H insets). RM-ANOVA followed by Bonferroni post hoc test (H, J, and M). *P < .05, **P < .01, and ***P < .001.
Figure 2.
Figure 2.. Impaired SAN β-AR responsiveness reveals uncoordinated recruitment of pacemaker clusters favoring rhythmic abnormalities.
A: Representative images of isochronal voltage maps under spontaneous sinus rhythm and isoproterenol stimulation. B: Spontaneous sinus rhythm and concentration-response curve for isoproterenol (Iso) were used to evaluate ex vivo beating rate. N = 7 animals in each group. C: Locations of the SAN leading pacemaker (dots), defined as the earliest activation site and the effects of β-adrenergic stimulation on the leading pacemaker site location. Each colored dot represents an estimated location from 5-sec recordings from an animal replicate replotted onto a schematic SAN region. D: Occurrence of abnormal sinus rhythm (SR) throughout the dose-response curve to Iso (left) and representative electrogram traces (right). E: Representative Masson’s trichrome–stained sections of SAN (left, CT = crista terminalis, Epi= epicardium, and Endo= endocardium) and quantification (right). F: Conduction velocity within the SAN region at spontaneous sinus rhythm and concentration-response curve for Iso. Data are expressed as mean ± SEM. Statistical significance was determined using RM-ANOVA followed by Bonferroni post hoc test (B and F). Fisher’s exact test (D). Unpaired Student t-test (E). *P < .05 and **P < .01.
Figure 3.
Figure 3.. Unmasked SAN dysfunction by adenosine challenge reveals conduction block.
A: Intracardiac electrophysiology study was used to determine the SAN function. Representative ECG recordings (B) and quantification of corrected SAN recovery time (cSNRT, corrected by intrinsic CL= cycle length) (C). D: Histogram of the circadian oscillation of heart rate during day (left) and night (right). Individual standard derivation of heart rate was used as a measure of heart rate variability (HRV). N = 10 animals in each group. E: Survival analysis of control and HFpEF rats until 18 weeks of age. F: Representative image of electrodes placement surrounding the ex vivo SAN/atrial tissue loaded with a voltage-sensitive dye (left). Overdriving suppression of SAN for assessing the cSNRT was achieved by rapid pacing from the right atrium (RA). cSNRT was quantified before (baseline) and after treatment with adenosine (1 μM) for 10 min (middle). Representative optical action potential traces during RA pacing and time taken to recover the sinus rhythm (right). G: Overview of HFpEF SAN maps uncover the presence of conduction blocks. Data are expressed as mean ± SEM. Unpaired Student t-test (C and D). Log-rank test (E). RM-ANOVA followed by Bonferroni post hoc test (F). Fisher’s exact test (G). *P < .05,**P < .01, and ***P < .001.
Figure 4.
Figure 4.. Transcriptome profiling of HFpEF SAN identifies multiple disease-associated mechanisms underpinning depressed membrane clock.
A: Enriched upregulated and downregulated canonical pathways. B: Volcano plot of fold change relative to control SAN. Highlighted genes indicate the potential genes related to human sick sinus syndrome, as predicted by in silico analysis. N = 4 samples each group. C: Representative western blot images (top) and quantification of Cav1.3 (encoded by Cacna1d) protein expression (bottom). D: Representative isolated SAN cells loaded with the voltage dye show the typical spindle shape of pacemaker cells with absent T-tubules (scale bar = 10 μm). E: Representative L-type Ca2+ channel currents recorded in isolated SAN cells. F: cell capacitance. G: Average peak current density–voltage relationship of ICa,L in control (n= 9 cells from 3 animals) and HFpEF (n= 7 cells from 3 animals); H: Peak current at 0 mV in the absence or presence of isoproterenol (Iso, 1 μM). I: Representative western blot images (top) and quantification of Hcn4 protein expression (bottom). J: Representative time courses of If funny current recorded in isolated SAN cells. K. Average peak current density-voltage relationship of If in control (n= 6 cells from 3 animals) and HFpEF (n= 5 cells from 3 animals) (bottom), inset highlights no difference in If current density between −60 to −30 mV. L: Peak current at −140 mV in the absence or presence of isoproterenol (Iso, 1 μM). Data are expressed as mean ± SEM. Statistical significance was determined using unpaired Student’s t-test (C, I, and F). Mixed-effect model with Bonferroni’s post hoc test (G). RM-ANOVA followed by Bonferroni post hoc test (H, K, and L). *P < .05, **P < .01, and ***P < .001.
Figure 5.
Figure 5.. Compromised intracellular Ca2+ transients in SAN of HFpEF.
A: Time series of 2D confocal images of pacemaker cells within the intact SAN (scale bar = 60 μm). B: A still frame from a 2D confocal image of Ca2+ fluorescence in a wide field of the explanted HFpEF SAN tissue, showing two neighbor cells, one under intrinsic sinus rhythm (marked by white dashed lines) and another with Ca2+ waves (marked by yellow dashed lines), scale bar = 20 μm. The right panel shows the differential oscillatory pattern. C: Membrane depolarization-induced global cytosolic Ca2+ transient (top) and representative Ca2+ transient in control and HFpEF SAN cells under baseline and isoproterenol (Iso) stimulation (bottom). D: Mean Ca2+ transient amplitude. E: Mean time constant of Ca2+ decay (Tau). F: Representative tracings of application of a caffeine solution after pacing to steady state at 1 Hz provided a measurement of caffeine-induced inward NCX current and sarcoplasmic reticulum (SR) load. G: Mean SR Ca2+ load. H: Mean peak NCX current (INCX). Mean values were obtained from control (n=10–12 cells from 3 animals) and HFpEF (n=15–18 cells from 3 animals). Data are expressed as mean ± SEM. Statistical significance was determined using RM-ANOVA followed by Bonferroni post hoc test (D and E) or unpaired Student’s t-test (G and H). *P < .05.
Figure 6.
Figure 6.. Computer simulations reveal the dominant role of HFpEF-associated membrane clock remodeling on the impaired SAN β-AR responsiveness.
A: Computer simulation workflow. Incorporation of ionic remodeling into biophysically-detailed human SAN membrane kinetic model (top). First, ionic remodeling of the membrane clock (MC: 80% and 34% reduction in funny current and L-type Ca2+ current conductances) was incorporated (pink). Subsequently, additional Ca2+ handling parameters (SERCA, RyR, L-type Ca2+) were tuned so that the resultant HFpEF models recapitulated changes in experimental Ca2+ transient dynamics. When testing for CI (bottom), models were challenged with a 40-sec pulse of 1 μM isoproterenol (ISO); maximal beating rate (BR), BR response (τon), and BR recovery (τoff) were quantified. B: Instantaneous BR plotted versus time for control (black) and HFpEF (red) models subject to a 40-sec 1 μM ISO pulse; representative action potentials (left) for control (black) and collection of HFpEF (red) SAN models with and without ISO (inset). Violin plots of (C) maximum BRs, and (D) BR response (τon, left), and BR recovery (τoff, right) of HFpEF models subject to 1 μM ISO pulse; black horizontal lines indicate corresponding control values. E and F: Contributions of MC and CC remodeling to CI. E: Steady-state BRs with and without ISO. F: BR response (τon, left) and BR recovery (τoff, right) of models with either MC remodeling (blue) or CC remodeling (green); horizontal black bars indicate control model dynamics. G: Bar graph of sensitivity coefficients of membrane and calcium clock parameters. The sensitivity coefficients represent how changes in each of these parameters affect BR.

References

    1. Borlaug BA, Melenovsky V, Russell SD, et al. Impaired chronotropic and vasodilator reserves limit exercise capacity in patients with heart failure and a preserved ejection fraction. Circulation. 2006;114:2138–2147. - PubMed
    1. Shah SJ, Borlaug BA, Kitzman DW, et al. Research Priorities for Heart Failure With Preserved Ejection Fraction: National Heart, Lung, and Blood Institute Working Group Summary. Circulation. 2020;141:1001–1026. - PMC - PubMed
    1. Sarma S, Stoller D, Hendrix J, et al. Mechanisms of Chronotropic Incompetence in Heart Failure With Preserved Ejection Fraction. Circ Heart Fail. 2020;13:e006331. - PMC - PubMed
    1. Borlaug BA, Kane GC, Melenovsky V, et al. Abnormal right ventricular-pulmonary artery coupling with exercise in heart failure with preserved ejection fraction. Eur Heart J. 2016;37:3293–3302. - PMC - PubMed
    1. Borlaug BA, Nishimura RA, Sorajja P, et al. Exercise hemodynamics enhance diagnosis of early heart failure with preserved ejection fraction. Circ Heart Fail. 2010;3:588–595. - PMC - PubMed

Publication types