. 2021 Dec 14;22(1):339.
doi: 10.1186/s13059-021-02552-3.

Benchmarking UMI-based single-cell RNA-seq preprocessing workflows

Affiliations

Benchmarking UMI-based single-cell RNA-seq preprocessing workflows

Yue You et al. Genome Biol. .

Abstract

Background: Single-cell RNA-sequencing (scRNA-seq) technologies and associated analysis methods have rapidly developed in recent years. This includes preprocessing methods, which assign sequencing reads to genes to create count matrices for downstream analysis. While several packaged preprocessing workflows have been developed to provide users with convenient tools for handling this process, how they compare to one another and how they influence downstream analysis have not been well studied.

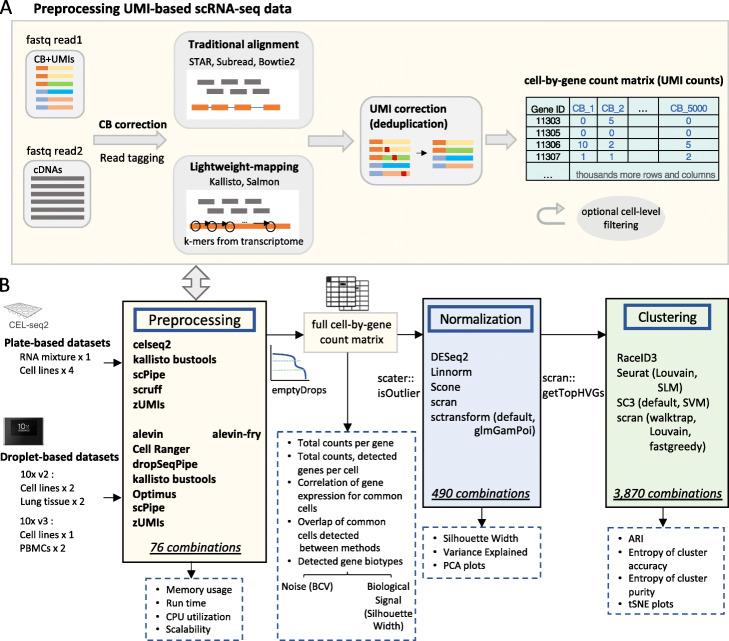
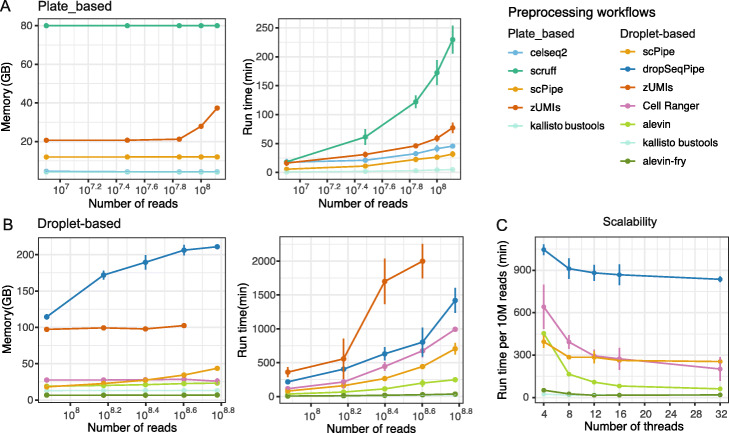
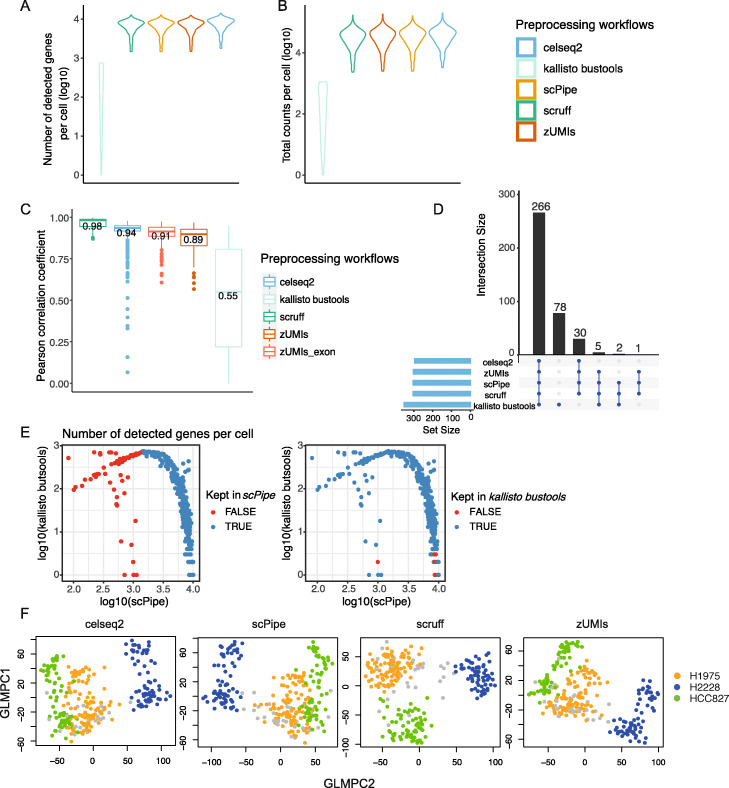
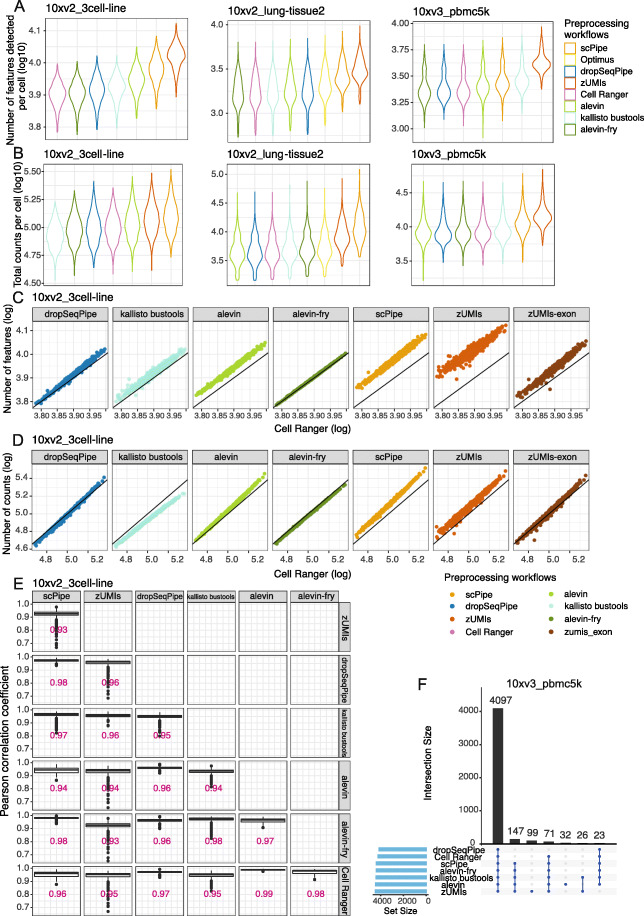
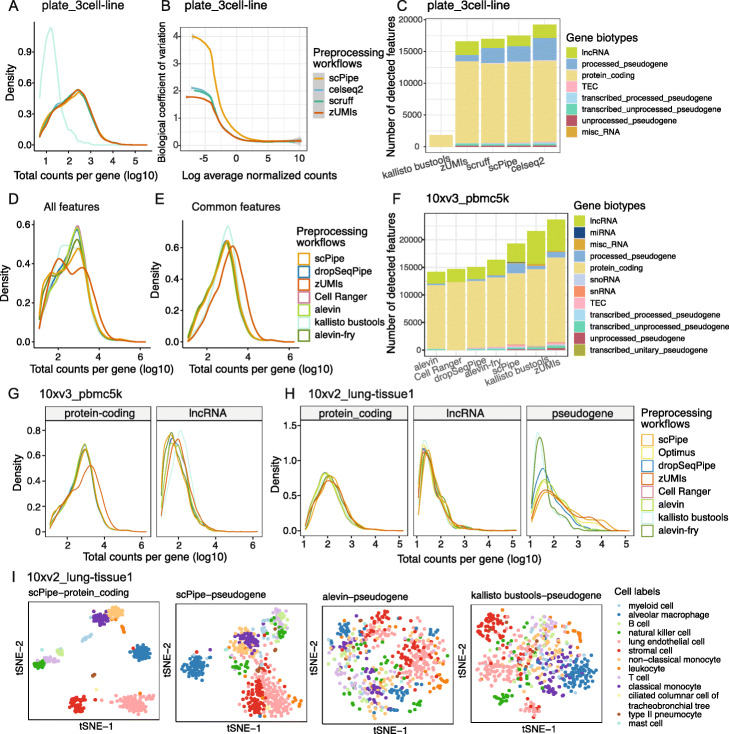
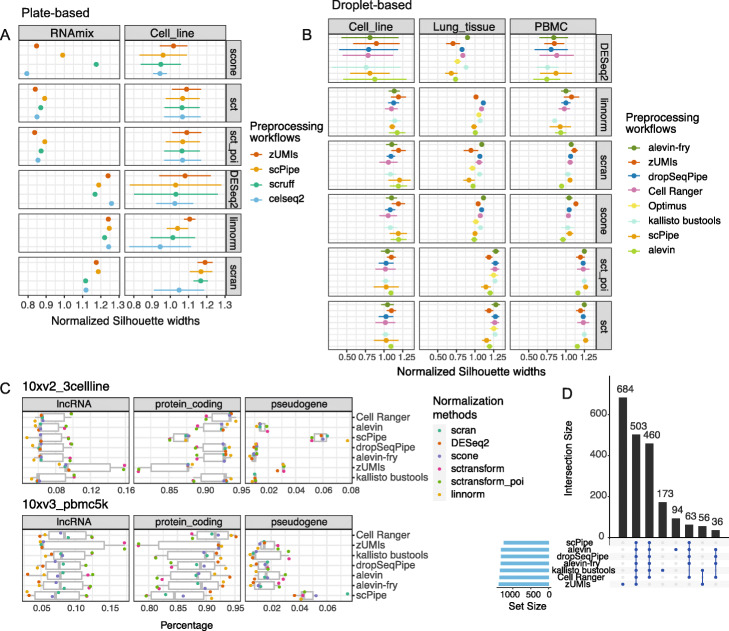
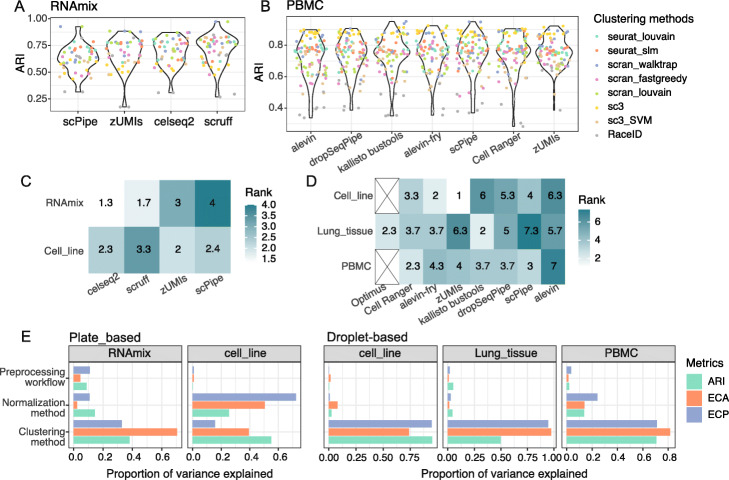
Results: Here, we systematically benchmark the performance of 10 end-to-end preprocessing workflows (Cell Ranger, Optimus, salmon alevin, alevin-fry, kallisto bustools, dropSeqPipe, scPipe, zUMIs, celseq2, and scruff) using datasets yielding different biological complexity levels generated by CEL-Seq2 and 10x Chromium platforms. We compare these workflows in terms of their quantification properties directly and their impact on normalization and clustering by evaluating the performance of different method combinations. While the scRNA-seq preprocessing workflows compared vary in their detection and quantification of genes across datasets, after downstream analysis with performant normalization and clustering methods, almost all combinations produce clustering results that agree well with the known cell type labels that provided the ground truth in our analysis.

Conclusions: In summary, the choice of preprocessing method was found to be less important than other steps in the scRNA-seq analysis process. Our study comprehensively compares common scRNA-seq preprocessing workflows and summarizes their characteristics to guide workflow users.

Keywords: Methods comparison; Preprocessing; Sequencing analysis; Transcriptomics; scRNA-seq.


Conflict of interest statement

The authors declare that they have no competing interests.

Figures

Fig. 1
Fig. 1
Overview of scRNA-seq preprocessing workflows and study design. (A) A typical preprocessing workflow begins with raw sequences in FASTQ files that are subject to cell barcode (CB) detection, alignment, UMI correction, count matrix generation, and quality control. (B) Summary of benchmarking study, showing the datasets analyzed, the selected preprocessing workflows and methods for normalization and clustering that were compared. Workflows and methods used in analysis are listed in boxes with solid borders, while evaluation metrics are shown in boxes with dashed borders. In total, 3870 combinations of datasets × preprocessing workflows × downstream analysis methods were generated in this study
Fig. 2
Fig. 2
Comparing the computational performance of different scRNA-seq preprocessing workflows. Maximum memory usage and run time for each preprocessing workflow are shown for A plate-based protocols and B droplet-based protocols. Run time versus the number of threads is shown in C, where run time is scaled by 10 million reads
Fig. 3
Fig. 3
Comparing gene expression quantification of different scRNA-seq preprocessing workflows on the plate-based 3 cell line mixture (plate_3cell-line) dataset. A The number of detected genes per cell and B total counts per cell (both on a log10-scale). C The Pearson correlation coefficients between the gene counts of scPipe and other preprocessing workflows. Median values of the correlation coefficients are labelled. D After filtering, an UpSet plot displays the overlap of retained cells across workflows. E The number of detected genes per cell from kallisto bustools and scPipe are plotted in a pairwise manner. Colors represent whether a cell was kept after filtering with scPipe (left panel) and kallisto bustools (right panel). F GLMPCA plots for each preprocessing workflow, with colors representing the different cell lines included in this dataset. Cells that were not common between workflows are colored in grey
Fig. 4
Fig. 4
Comparing gene expression quantification of different scRNA-seq preprocessing workflows on droplet-based datasets. A The number of detected genes per cell and B total counts per cell (both on a log10-scale) on the 10xv2_3cell-line, 10xv2_lung-tissue2, and 10xv3_pbmc5k datasets. C The number of detected genes per cell and D total counts per cell for common cells for different preprocessing workflows against Cell Ranger on the 10xv2_3cell-line dataset. The identity line (y=x) is plotted in black in each panel. E The Pearson correlation coefficients between the gene counts of different pairs of preprocessing workflows for the 10xv2_3cell-line dataset. Median values of the correlation coefficients are labelled. F An UpSet plot displays the overlap of retained cells across workflows on the 10xv3_pbmc5k dataset
Fig. 5
Fig. 5
Comparing gene biotype detection of different scRNA-seq preprocessing workflows. A Density of total counts per gene (on a log10-scale), B biological coefficient of variation (BCV) for each feature versus gene abundance, and C the number of detected features per gene biotype for different workflows for the plate_3cell-line dataset. D The density of total counts per gene of all features, E common features (both on a log10-scale), F the number of detected features per gene biotype, and G the density of total counts (log10-scale) for distinct gene biotypes (protein coding genes and lncRNAs) for different workflows on the 10xv3_pbmc5k dataset. H Density plot for distinct gene biotypes (protein coding genes, lncRNAs and pseudogenes) for different workflows on the 10xv2_lung-tissue1 dataset. I tSNE plots generated with protein coding genes and pseudogenes using scran normalized counts for the 10xv2_lung-tissue1 dataset. Colors represent different cell type labels
Fig. 6
Fig. 6
Comparing the performance of different scRNA-seq preprocessing workflows and normalization methods. A Dot plots (mean silhouette widths ± s.d) for plate-based datasets and B droplet-based datasets. Colors denote different preprocessing workflows. Silhouette widths are calculated based on known cell labels after applying different normalization methods and normalized against the silhouette widths obtained without any normalization. C The percentage of genes biotypes of lncRNAs, protein coding genes, and pseudogenes among HVGs on the 10xv2_3cell-line and 10xv3_pbmc5k datasets. D An UpSet plot displays the overlap in protein coding genes among the HVG list from different workflows obtained using scran normalized counts for the 10xv3_pbmc5k dataset
Fig. 7
Fig. 7
Comparing performance of different preprocessing, normalization, and clustering methods. A Violin plots of ARI for different preprocessing workflows on plate-based RNAmix dataset and B droplet-based PBMC datasets. Each point represents a method combination and is colored by the clustering method applied. C The preprocessing workflows’ influence on clustering results is summarized for plate-based data and D droplet-based data. Colors represent the rank of their average rank across evaluation metrics (ARI, ECA, ECP). Lighter color means better performance (i.e. higher rank). E Proportion of variance in ARI, ECA and ECP explained by the 3 major components of the analysis pipeline examined for plate-based (left) and droplet-based (right) datasets. Colors denote different performance metrics (ARI, ECA, and ECP) used as input to the ANOVA model (performance metric ∼preprocessing+normalization+clustering+experimental design)

References

    1. Zappia L, Phipson B, Oshlack A. Exploring the single-cell RNA-seq analysis landscape with the scRNA-tools database. PLoS Comput Biol. 2018;14(6):e1006245. - PMC - PubMed
    1. Svensson V, Vento-Tormo R, Teichmann S. Exponential scaling of single-cell RNA-seq in the past decade. Nat Protoc. 2018;13(4):599–604. - PubMed
    1. Duò A, Robinson M, Soneson C. A systematic performance evaluation of clustering methods for single-cell RNA-seq data. F1000Research. 2018;7:1141. - PMC - PubMed
    1. Saelens W, Cannoodt R, Todorov H, Saeys Y. A comparison of single-cell trajectory inference methods. Nat Biotechnol. 2019;37(5):547–54. - PubMed
    1. Tian L, Dong X, Freytag S, Lê Cao K, Su S, JalalAbadi A, Amann-Zalcenstein D, Weber T, Seidi A, Jabbari J, Naik S, Ritchie M. Benchmarking single cell RNA-sequencing analysis pipelines using mixture control experiments. Nat Methods. 2019;16(6):479–87. - PubMed

Publication types