. 2021 Dec 14;12(1):7268.
doi: 10.1038/s41467-021-27197-5.

Interleukin-7 receptor α mutational activation can initiate precursor B-cell acute lymphoblastic leukemia

Affiliations

Interleukin-7 receptor α mutational activation can initiate precursor B-cell acute lymphoblastic leukemia

Afonso R M Almeida et al. Nat Commun. .

Abstract

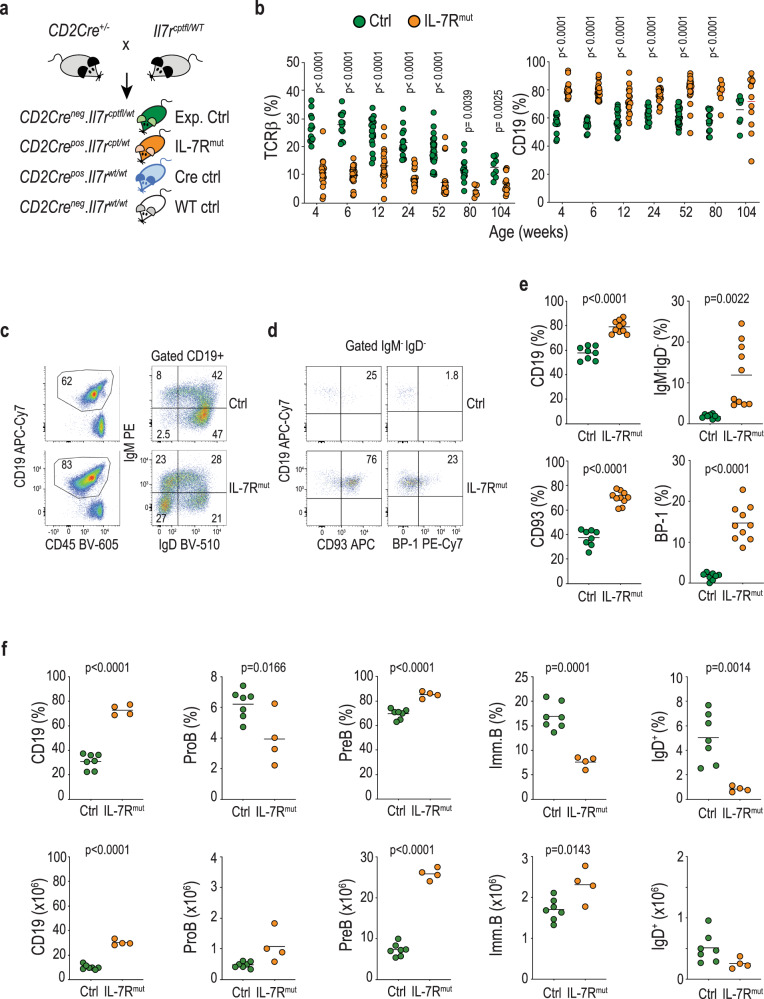
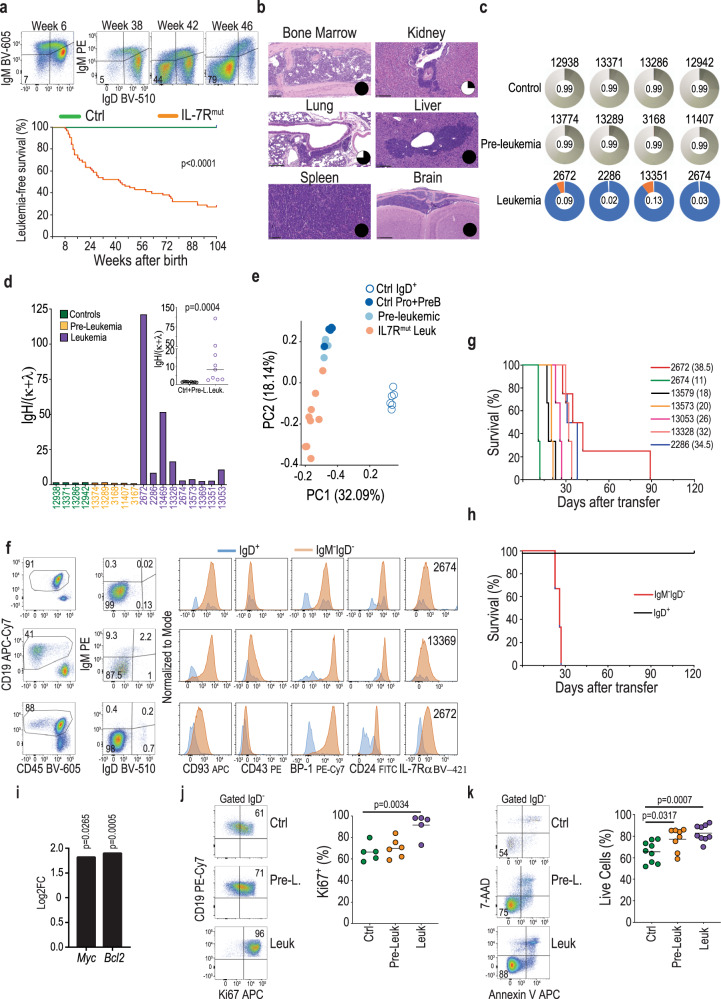
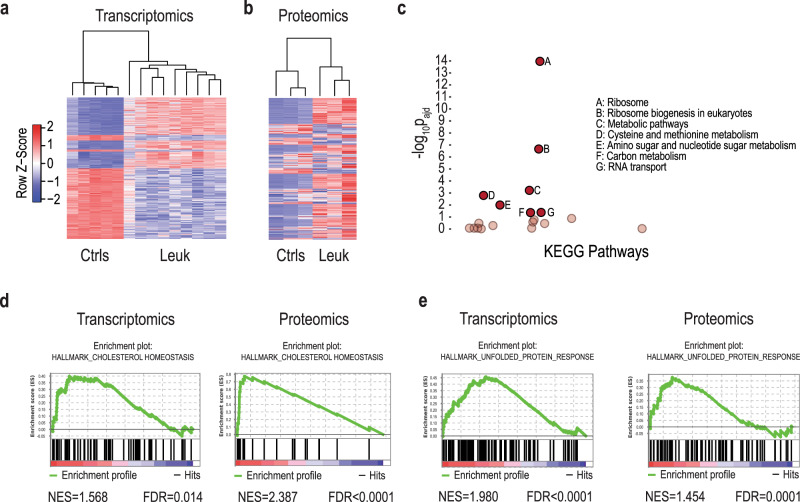
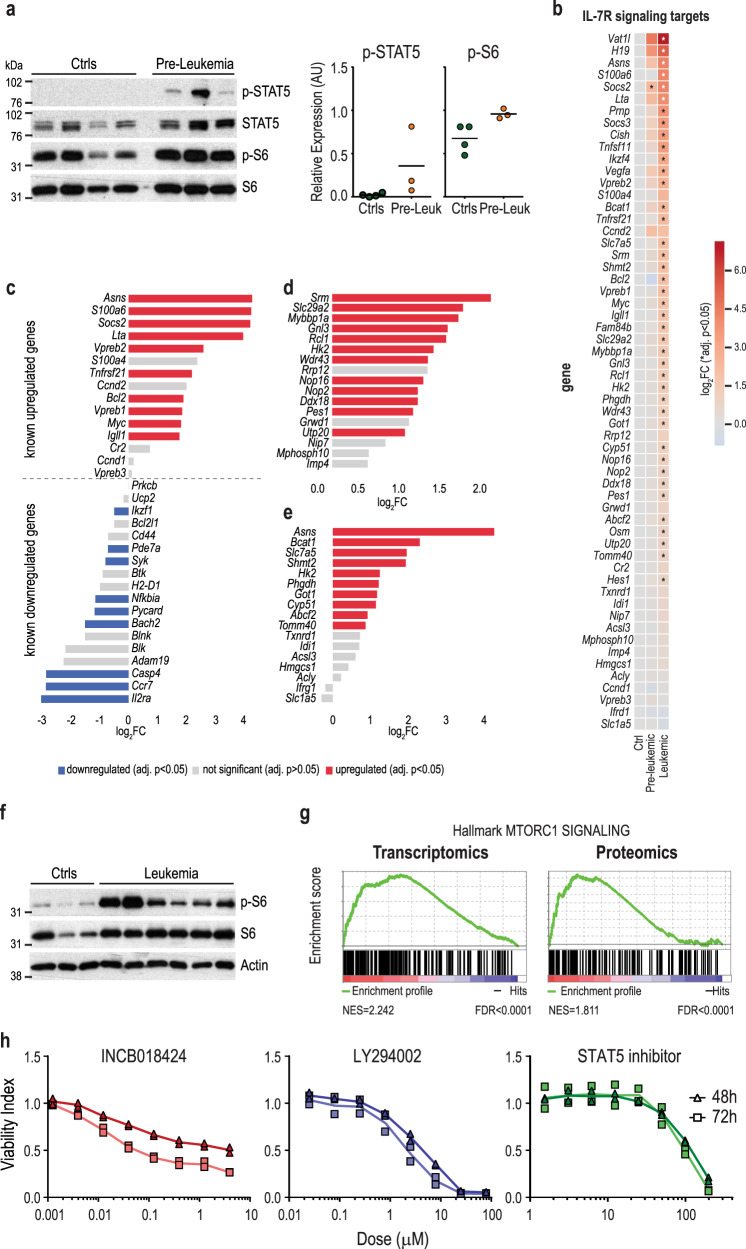
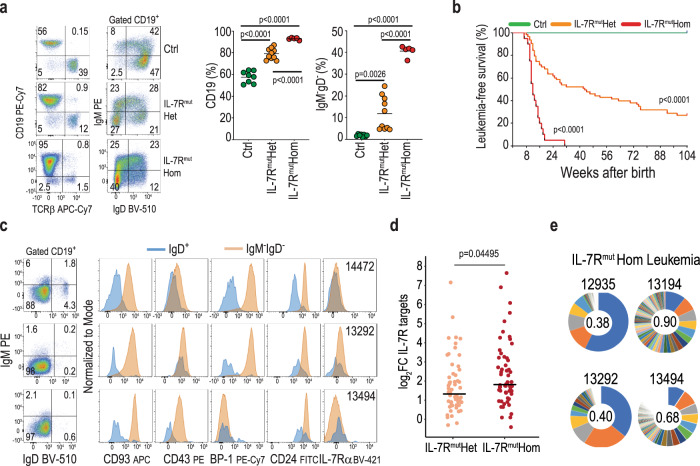
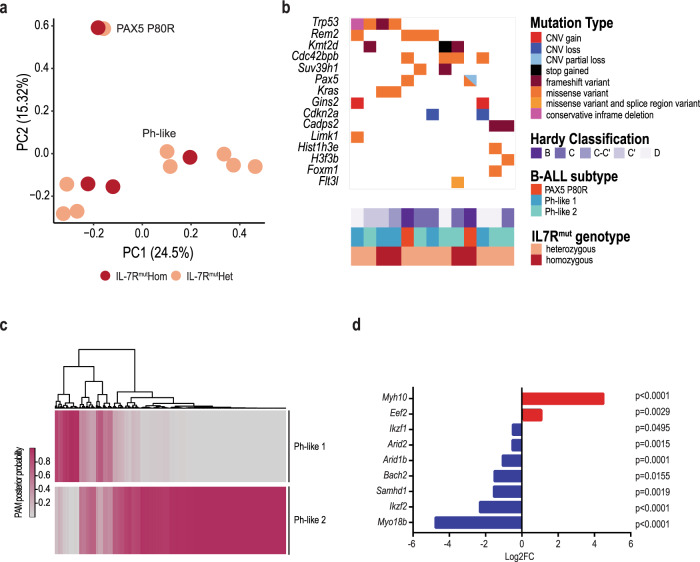
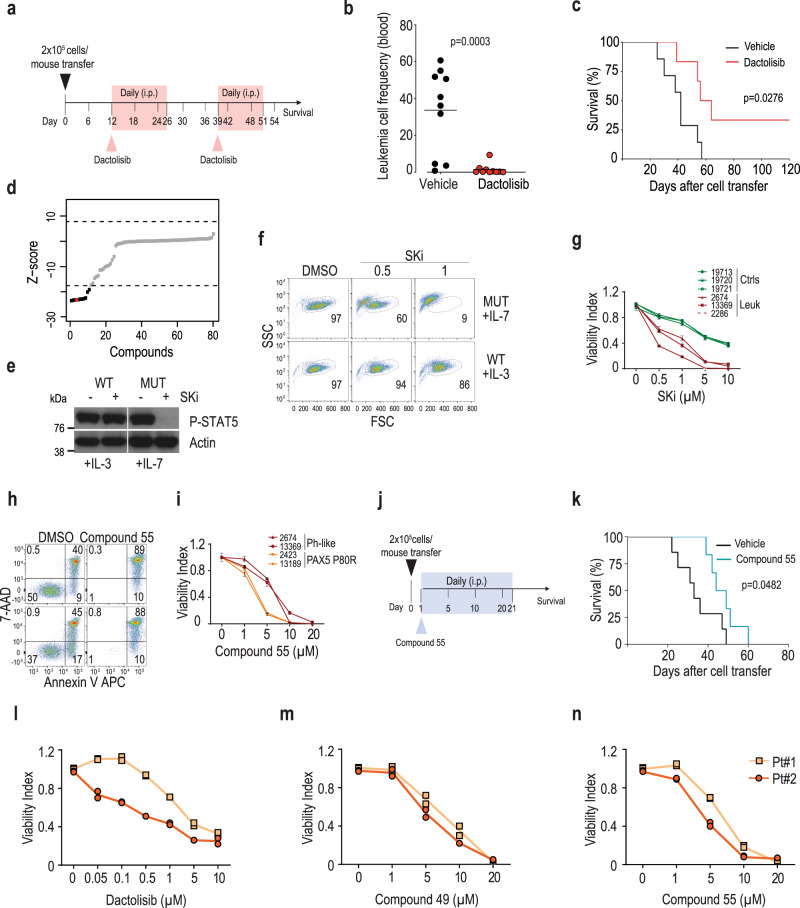
Interleukin-7 receptor α (encoded by IL7R) is essential for lymphoid development. Whether acute lymphoblastic leukemia (ALL)-related IL7R gain-of-function mutations can trigger leukemogenesis remains unclear. Here, we demonstrate that lymphoid-restricted mutant IL7R, expressed at physiological levels in conditional knock-in mice, establishes a pre-leukemic stage in which B-cell precursors display self-renewal ability, initiating leukemia resembling PAX5 P80R or Ph-like human B-ALL. Full transformation associates with transcriptional upregulation of oncogenes such as Myc or Bcl2, downregulation of tumor suppressors such as Ikzf1 or Arid2, and major IL-7R signaling upregulation (involving JAK/STAT5 and PI3K/mTOR), required for leukemia cell viability. Accordingly, maximal signaling drives full penetrance and early leukemia onset in homozygous IL7R mutant animals. Notably, we identify 2 transcriptional subgroups in mouse and human Ph-like ALL, and show that dactolisib and sphingosine-kinase inhibitors are potential treatment avenues for IL-7R-related cases. Our model, a resource to explore the pathophysiology and therapeutic vulnerabilities of B-ALL, demonstrates that IL7R can initiate this malignancy.


Conflict of interest statement

The authors declare no competing interests.

Figures

Fig. 1
Fig. 1. Physiological levels of heterozygous mutant IL-7Rα expression consistently originate a B cell precursor pre-leukemic stage.
a Scheme of experimental cross, depicting genotype of progeny. Green (controls) and orange (IL-7Rmut) animals were bled from week 4 and monitored up to week 104, unless disease ensued. A cohort of Cre-toxicity controls (blue) was also monitored that presented no disease. b TCRβ and CD19 fractions within CD45-positive cells in blood from control and IL-7Rmut animals. Each dot denotes an animal and mean value is shown. Two-tailed unpaired t-test. c CD19 fraction (left) and IgM versus IgD subpopulations within CD19 (right) in the blood of one representative animal from each group at 6 weeks of age. Numbers indicate frequencies of each quadrant or region. d CD93 and BP-1 expression within IgMIgD cells in the blood from the same animals than in c. e Scatter plots summarizing data from all animals analyzed as in c and d. Ctrls: n = 8; IL-7Rmut: n = 10. Each dot denotes an animal and mean value is shown. Two-tailed unpaired t-test. f Scatter plots showing fractions (top) and absolute numbers (bottom) in BM for the indicated populations in 4-week-old animals from Ctrl (n = 7) and IL-7Rmut (n = 4) animals. Two-tailed unpaired t-test. Source data are provided as a Source Data file.
Fig. 2
Fig. 2. IL-7Rα mutant mice develop precursor B-ALL.
a Example of IgMIgD cell frequency evolution in a mouse that developed leukemia (top). Kaplan–Meier leukemia-free survival curves of control (Ctrl; n = 40) and IL7R mutant (IL7Rmut; n = 63) animals (bottom). All mice died with precursor B-ALL. Log-rank Mantel–Cox test (b) Histologies (H&E) of organs infiltrated with leukemia cells. Pie chart inserts represent fraction of analyzed animals (n = 4) with leukemia involvement (in black) in the respective organ. Scale bar indicates 100 μm (bone marrow, spleen), 250 μm (kidney, lung, liver), or 500 μm (brain). c Clonality pie charts based on IgH sequencing. Each colored slice corresponds to a clone, indicative of clonality. Gray areas correspond to many rare clones, indicative of polyclonality. Equitability values (ranging from 0, for monoclonality, to 1, for a balanced repertoire) are shown in the center of the pie charts. Samples are bone marrow pro+pre-B cells from control, pre-leukemic, or leukemic mice. d Ig heavy chain (H) over light chain (κ and λ) ratios to evaluate, at the population level, the presence of the pro-B cell rearrangement signature (heavy chain expression in the absence of light chain expression). Two-tailed Mann–Whitney test performed. e Principal component analysis of normal (Ctrl Pro+Pre-B) and pre-leukemic (Pre-leukemic) pro- and pre-B cell precursors, mature splenic B cells (Ctrl IgD+) and leukemia cells (IL7Rmut Leuk). f Immunophenotypic analysis of three representative BM leukemia samples. Numbers inside dot plots indicate frequency in each quadrant or region. g, h Kaplan–Meier leukemia-free survival curves of mice transplanted with g bulk primary leukemias or h sorted IgD+ versus IgMIgD leukemia cells. i Myc and Bcl2 transcript upregulation (log2 fold change) in leukemia samples (n = 9) as compared to normal controls (n = 5). Moderated t-test performed. j Frequency of Ki67-positive cells in controls (n = 5), pre-leukemia (n = 5), and leukemia samples (n = 5). Dot plots are representative of each condition. k Frequency of annexin V/7AAD-negative (viable) cells in controls (n = 9) pre-leukemia (n = 8) and leukemia samples (n = 9). Dot plots are representative of each condition. j, k Two-tailed unpaired t-test. Source data are provided as a Source Data file.
Fig. 3
Fig. 3. Transcriptomics and proteomics characterization of mutant IL7R leukemias.
a Heatmap representation and hierarchical clustering of control and leukemia samples based on the 1000 most significant (adj. p value) differentially expressed genes. b Heatmap representation of samples based on the 500 most significant (nominal p value) differentially expressed proteins between control and leukemia samples. c g:Profiler KEGG pathway functional enrichment analysis for significant and concordantly upregulated genes and proteins in leukemia samples. Significantly enriched pathways (A–G, adj. p < 0.05. Cumulative hypergeometric test) are represented in full opacity. Pathways below the significance threshold are represented in low opacity. Pathways where p = 1 are not featured. d, e Gene set enrichment analysis (GSEA)-enrichment plot of differential gene and protein expression between leukemias and controls showing a significant upregulation of the d cholesterol homeostasis and the e unfolded protein response (UPR) hallmark gene sets (normalized enrichment score (NES) > 1, FDR < 0.05). Source data are provided as a Source Data file.
Fig. 4
Fig. 4. Leukemia cells rely on IL-7R signaling, which boosts upon transformation.
a Immunoblot analysis of phosphorylated STAT5 and S6 levels in sorted pro+pre-B cells from control (n = 4) and pre-leukemic (n = 3) mice, IL-7-deprived for 12 h. Graphs represent densitometry values for P-STAT5 and P-S6 normalized to respective total protein. b Differential gene expression of known IL-7R signaling targets in pre-leukemia and leukemia samples compared to controls (reference category). Moderate t-test performed. ce Differential expression of (c) STAT5, (d) MYC, and (e) mTOR targets in leukemia versus control samples. Significantly upregulated and downregulated genes (adj. p < 0.05; moderate t-test) are shown in red and in blue, respectively. f Immunoblot analysis of phosphorylated S6 levels in control (n = 3) and leukemia (n = 6) samples analyzed ex vivo. g Transcriptomic and proteomic gene set enrichment analysis (GSEA) showing a significant enrichment of the mTOR signaling hallmark gene set in leukemias versus controls. h Leukemia cells were cultured in the presence or absence of pharmacological inhibitors of JAK1/2 (INCB018424; ruxolitinib), STAT5 (STAT5 inhibitor), and PI3K (LY294002) at the indicated doses, and viability was evaluated at 48 and 72 h. Results from a representative mouse (n = 3). Lines represent average of duplicates that are shown. Source data are provided as a Source Data file.
Fig. 5
Fig. 5. Homozygous expression of mutant IL7R leads to maximal IL-7R signaling hyperactivation and rapidly fatal leukemia.
a Dot plots of CD19 by TCRβ to identify T and B cell lymphocytes in blood at 6 weeks of age in representative animals of indicated genotypes (left) and graphs summarizing data from all animals analyzed (right). Ctrls: n = 8; IL-7RmutHet: n = 10; IL-7RmutHom: n = 5. Each dot denotes an animal and mean value is shown. Numbers in dot plots indicate frequency in each quadrant. One-way ANOVA. b Kaplan–Meier leukemia-free survival curves of control (n = 40), IL-7RmutHet (n = 63), and IL-7RmutHom (n = 20) mutant animals. Log-rank (Mantel–Cox) test. All mice died with precursor B-ALL. c Immunophenotypic analysis of three representative BM IL-7RmutHom leukemia samples. Numbers inside dot plots indicate frequency in each quadrant or region. d Comparison of IL-7R “signaling strength” between IL-7RmutHet and IL-7RmutHom leukemia samples, as measured by the levels of differential gene expression over control samples. Each dot represents log2 fold change (FC) of an IL-7R signaling target gene (see Fig. 4b). Means are indicated. Unpaired two-tailed t-test. e Clonality pie charts based on IgH sequencing (see Fig. 2c for further details). Source data are provided as a Source Data file.
Fig. 6
Fig. 6. Mouse mutant IL7R leukemias resemble Ph-like and PAX5 P80R human B-ALL.
a Principal component analysis (PCA) plot of gene expression profiles from mouse leukemia samples. b Mutational burden map of copy number variants (CNVs), single nucleotide variants (SNVs), and indel variants with predicted high and moderate impact in genes of interest. c Heatmap of PAM posterior probabilities classification of human Ph-like samples (from ref. ) into the two apparent Ph-like subgroups observed in IL7R mutant leukemic mice. d Oncogenes and tumor suppressor genes significantly (adj. p < 0.05; moderate t-test) up- and downregulated, respectively, in leukemic samples as compared to controls. Log2 fold-changes (FC) are indicated for each gene. Source data are provided as a Source Data file.
Fig. 7
Fig. 7. Mutant IL7R B-ALLs are sensitive to PI3K/mTOR and SK pharmacological inhibition.
a Dactolisib in vivo administration scheme. Leukemic cells (2 × 105) were transferred into Rag−/−γc−/− hosts. b Leukemia cell frequency detected in blood 6 days after treatment (n = 10). Two-tailed, unpaired t-test. c Kaplan–Meier survival curves, and respective log-rank p value, of animals (n = 7 control; n = 6 dactolisib) treated with vehicle or dactolisib (30 mg/kg). d Z-score values of chemical screen library for kinase inhibitors tested in IL-3-dependent Ba/F3 cells stably transduced with mutant IL7R and cultured in the absence of IL-3. Each compound is represented by one dot. SKi is denoted in red. Dotted lines represent Z-score cut-off. e Immunoblot analysis of STAT5 phosphorylation in Ba/F3 cells pre-treated with SKi (10 µM) or DMSO for 2 h and then stimulated with either IL-3 (IL7R WT cells) or IL-7 (IL7R mutant cells). IL7R WT-transduced cells were used merely as transduction controls for IL7R mutant cells but express IL-3R and respond to IL-3. IL-7 was used in IL7R mutant cells to reinforce IL-7R signaling while keeping the same period (30′) of cytokine stimulation as in IL-3-stimulated cells. This experiment was repeated once with identical results. f Viability, evaluated by FSC × SSC flow cytometry discrimination, of IL-3-cultured IL7R WT cells or IL-7-cultured IL7R mutant Ba/F3 cells treated with SKi or DMSO for 72 h. g Viability of leukemia cells from three independent mice, as compared to healthy B cell precursor controls in the presence of IL-7, cultured with increasing concentrations of SKi for 12 h. Viability index is normalized to the control condition (DMSO). Average ± s.e.m. is shown for each concentration. h Viability (Annexin V/7AAD expression) of representative leukemia cells incubated with SK2 inhibitor Compound 55 (20 µM) or DMSO for 12 h. i Dose-dependent effect of Compound 55 on leukemia cell viability (n = 4; 2 PAX5 P80R and 2 Ph-like). j Compound 55 in vivo administration scheme. Leukemic cells (2 × 105) were transferred into Rag−/−γc−/− hosts. k Kaplan–Meier survival curves and respective log-rank p value of animals treated with vehicle (n = 7) or Compound 55 (n = 6; 5 mg/kg). ln Viability of mutant IL7R human PAX5 P80R primary B-ALL cells cultured with increasing concentrations of (l) Dactolisib, (m) Compound 49, or (n) Compound 55 for 48 h. Viability index is normalized to the control condition (DMSO). Lines represent average of the duplicates, which are shown, for each patient sample. Source data are provided as a Source Data file.

References

    1. Inaba H, Greaves M, Mullighan CG. Acute lymphoblastic leukaemia. Lancet. 2013;381:1943–1955. - PMC - PubMed
    1. Yeh, J. M. et al. Life expectancy of adult survivors of childhood cancer over 3 decades. JAMA Oncol. 6, 350–357 (2020). - PMC - PubMed
    1. Terwilliger T, Abdul-Hay M. Acute lymphoblastic leukemia: a comprehensive review and 2017 update. Blood Cancer J. 2017;7:e577. - PMC - PubMed
    1. von Freeden-Jeffry U, et al. Lymphopenia in interleukin (IL)-7 gene-deleted mice identifies IL-7 as a nonredundant cytokine. J. Exp. Med. 1995;181:1519–1526. - PMC - PubMed
    1. Peschon JJ, et al. Early lymphocyte expansion is severely impaired in interleukin 7 receptor-deficient mice. J. Exp. Med. 1994;180:1955–1960. - PMC - PubMed

Publication types

MeSH terms

Substances

LinkOut - more resources