Clinical Trial
. 2021 Dec 14;12(1):7280.
doi: 10.1038/s41467-021-27574-0.

Depletion of central memory CD8+ T cells might impede the antitumor therapeutic effect of Mogamulizumab

Affiliations
Clinical Trial

Depletion of central memory CD8+ T cells might impede the antitumor therapeutic effect of Mogamulizumab

Yuka Maeda et al. Nat Commun. .

Abstract

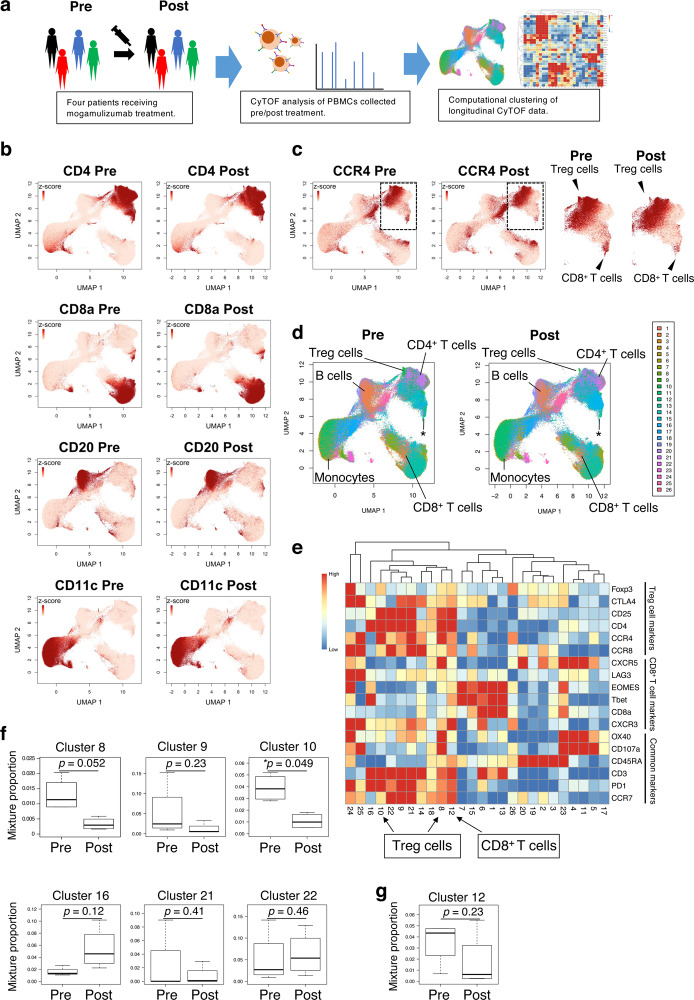
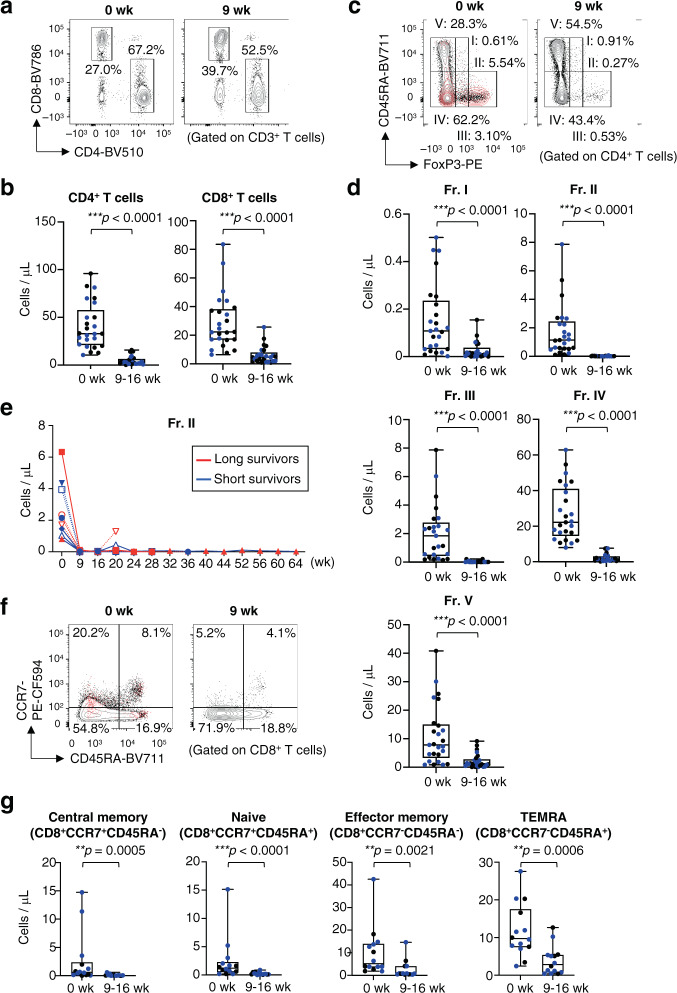
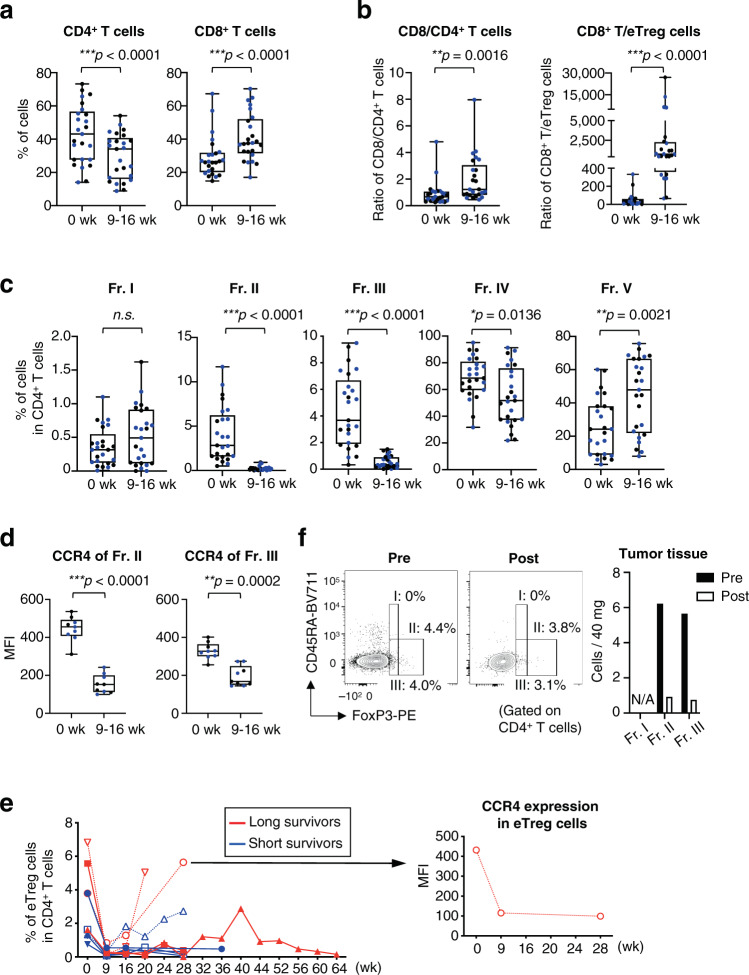
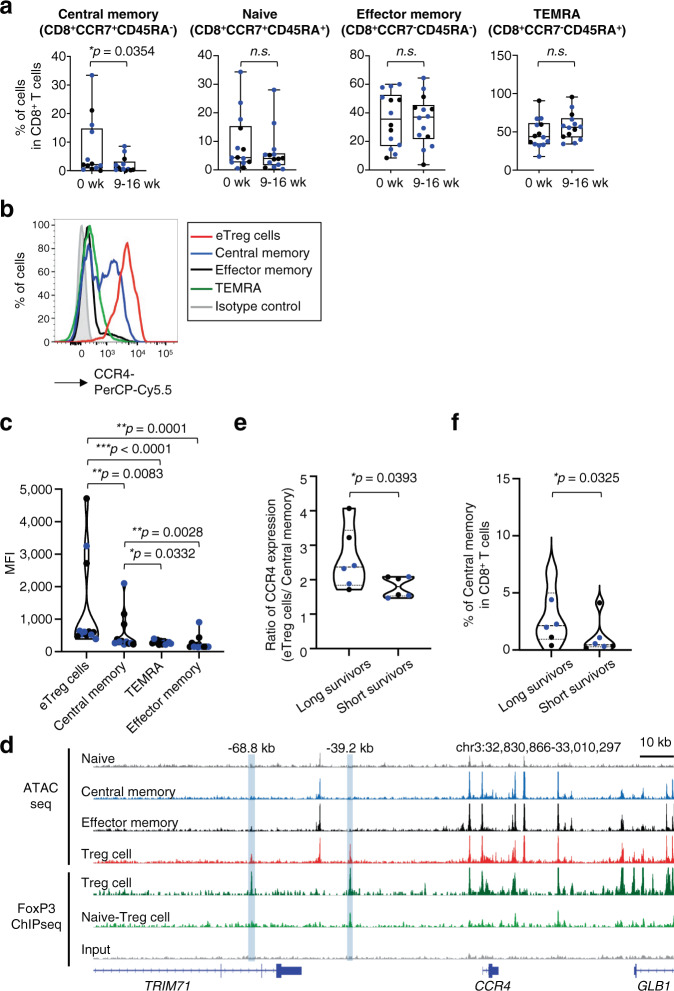
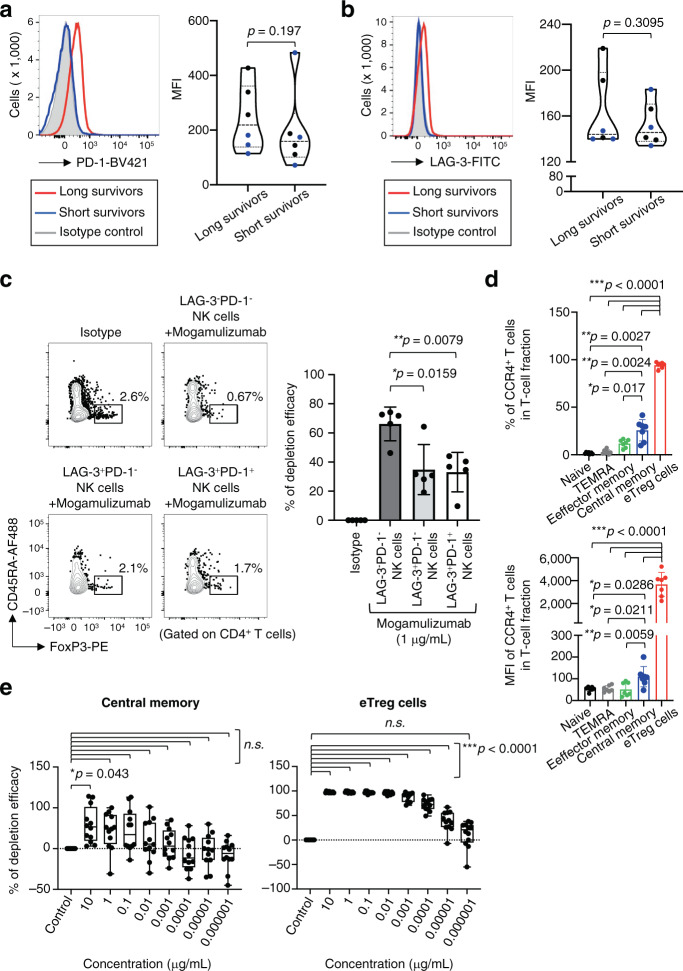
Regulatory T (Treg) cells are important negative regulators of immune homeostasis, but in cancers they tone down the anti-tumor immune response. They are distinguished by high expression levels of the chemokine receptor CCR4, hence their targeting by the anti-CCR4 monoclonal antibody mogamulizumab holds therapeutic promise. Here we show that despite a significant reduction in peripheral effector Treg cells, clinical responses are minimal in a cohort of patients with advanced CCR4-negative solid cancer in a phase Ib study (NCT01929486). Comprehensive immune-monitoring reveals that the abundance of CCR4-expressing central memory CD8+ T cells that are known to play roles in the antitumor immune response is reduced. In long survivors, characterised by lower CCR4 expression in their central memory CD8+ T cells possessed and/or NK cells with an exhausted phenotype, cell numbers are eventually maintained. Our study thus shows that mogamulizumab doses that are currently administered to patients in clinical studies may not differentiate between targeting effector Treg cells and central memory CD8+ T cells, and dosage refinement might be necessary to avoid depletion of effector components during immune therapy.


Conflict of interest statement

H.W. received research funding from Ono Pharmaceutical and Kyowa Kirin, and honoraria from Ono Pharmaceutical, Chugai Pharmaceutical, MSD and Bristol-Myers Squibb outside of this study. Department of Clinical Research in Tumor Immunology, Osaka University Graduate School of Medicine is a joint research laboratory with Shionogi & Co., Ltd. K.T. received honoraria and research funding from Ono Pharmaceutical, MSD, Shionogi, Bristol-Myers Squibb, Chugai Pharmaceutical, Amgen, Astellas Pharmaceutical, Oncolys BioPharma, Parexel and Merck Serono outside of this study. K.K. received research funding from TAKARA BIO and MSD outside of this study. Department of Immunotherapeutics, The University of Tokyo Hospital is endowed by TAKARA BIO. T.F. received research funding from Ono Pharmaceutical outside of this study. S.I. received honoraria and research funding from Ono Pharmaceutical, Takeda, Sanofi, Bristol-Myers Squibb, Janssen, Celgene and Daichi-Sankyo, and research funding from Kyowa Kirin, Abbvie, Chugai Pharmaceutical, MSD and Gilead outside of this study. M.O. received research funding from Thyas, Sysmex and Pole Star outside of this study. T.D. received honoraria and research funding from Lilly, Kyowa Kirin, MSD, Daiichi-Sankyo, Sumitomo Dainippon Pharma, Taiho Pharmaceutical, Novartis, Boehringer Ingelheim, Chugai Pharmaceutical, Bristol-Myers Squibb, Abbvie, and research funding from Merck Serono, Janssen Pharma, Pfizer, Quintiles, Eisai, and honoraria from Amgen, Takeda, Bayer, Rakuten Medical, Ono Pharmaceutical, Astellas Pharmaceutical, Oncolys BioPharma outside of this study. Y.D. received honoraria and research funding from Ono Pharmaceutical, Taiho Pharmaceutical, and research funding from Chugai Pharmaceutical, Covidien Japan, Jhonson & Jhonson and honoraria from Otsuka Pharmaceutical outside of this study. R.U. received research funding from Ono Pharmaceutical, Chugai Pharmaceutical and Kyowa Kirin outside of this study. H.N. received honoraria and research funding from Ono Pharmaceutical, Chugai Pharmaceutical, MSD and Bristol-Myers Squibb, and research funding from Taiho Pharmaceutical, Daiichi-Sankyo, Kyowa Kirin, Zenyaku Kogyo, Oncolys BioPharma, Debiopharma, Asahi-Kasei, Sysmex, Fujifilm, SRL, Astellas Pharmaceutical, Sumitomo Dainippon Pharma and BD Japan outside of this study. All other authors declare no competing interests.

Figures

Fig. 1
Fig. 1. A comprehensive immunological landscape is uncovered by longitudinal CyTOF data obtained from patients treated with mogamulizumab.
a Schematic overview of the CyTOF analyses. PBMCs (n = 4) obtained from pre- and post-mogamulizumab treatment were subjected to CyTOF. b UMAP projection of cells from pre- and post-mogamulizumab treatment samples is colored according to their scaled expression levels of markers for different cell populations: CD4+ T cells, CD8+ T cells, FoxP3+ T cells, CD20 for B cells, CD11c for monocytes. c The UMAP projection is colored according to the scaled expression levels of CCR4. The panels on the right represent the enlarged CD4+ cell populations to clearly show the changes in the expression levels of CCR4 pre- and post-mogamulizumab treatment samples. Black arrowheads represent Treg cells and CD8+ T cells. Each dot represents a single cell. Colors were saturated at z-cores 1 and 0 for visualization. d The UMAP projection is colored according to the cluster assignment by CYBERTRACK2.0. e. Heatmap generated by CYBERTRACK2.0. The rows and columns represent markers and clusters, respectively. Black arrowheads represent Treg cells and CD8+ T cells as in (c). f Boxplots representing the proportions of CD4+ clusters (clusters 8, p = 0.052; 9, p = 0.23; 10, *p = 0.049; 16, p = 0.12; 21, p = 0.41 and 22, p = 0.46) at pre- and post-mogamulizumab treatment (n = 4). g Boxplot representing the proportions of cluster 12 (p = 0.23), which contains CD8+ T cell populations at pre- and post-mogamulizumab treatment (n = 4). The center line indicates the median, and the box limits indicate the 1st and 3rd quartiles. Whiskers extend to the 1.5x interquartile range. In (f) and (g), two-sided paired Student’s t-test was used. *p < 0.05. Source data are provided as a Source Data file.
Fig. 2
Fig. 2. Mogamulizumab treatment reduces all T cell subsets in the peripheral blood.
a, b Representative flow cytometry staining for CD4 and CD8 in CD3+ T cells (a) and summaries for the absolute number of CD4+ T cells (***p < 0.0001) and CD8+ T cells (***p < 0.0001) at pre- and post-mogamulizumab treatment (b) are shown. PBMCs (n = 25) obtained from pre- and post-mogamulizumab treatment. Pre-treatment samples were collected within two weeks before the initial mogamulizumab administration, and post-treatment samples were collected at 9-16 weeks after mogamulizumab administration and were subjected to flow cytometry. c Representative flow cytometry staining for CD45RA and FoxP3 in CD4+ T cells. Red dots, CCR4+ cells; black dots, CD4+ T cells. d Summaries for the absolute number of each CD4+ T cell fraction (Fr. I, ***p < 0.0001; Fr. II, ***p < 0.0001; Fr. III, ***p < 0.0001; Fr. IV, ***p < 0.0001 and Fr. V, ***p < 0.0001) as depicted in (c) at pre- and post-mogamulizumab treatment are shown (n = 25). e. Longitudinal changes in the absolute number of Treg cells (Fr. II) in CD4+ T cells at pre- and post-mogamulizumab treatment are shown. Red lines, long survivors; blue lines, short survivors. f, g. Representative flow cytometry staining for CD45RA and CCR7 in CD8+ T cells (f) and summaries for the absolute number of each CD8+ T cell fraction (Central memory, **p = 0.0005; Naive, ***p < 0.0001; Effector memory, *p = 0.0021 and TEMRA, **p = 0.0006) as depicted in (f) at pre- and post-mogamulizumab treatment (g) are shown (n = 14). Red dots, CCR4+ cells; black dots, CCR4- cells. In (b, d and g), black dots, patients who received 1.0 mg/kg mogamulizumab; blue dots, patients who received 0.1 mg/kg mogamulizumab and two-sided Mann–Whitney test was used. In (b, d and g), the center line indicates the median, and the box limits indicate the 1st and 3rd quartiles. The whiskers go down to the smallest value and up to the largest. week: wk, naive CD8+ T cells: Naive, central memory CD8+ T cells: Central memory, effector-memory CD8+ T cells: Effector memory, TEMRA CD8+ T cells: TEMRA, *p < 0.01, **p < 0.001, ***p < 0.0001. Source data are provided as a Source Data file.
Fig. 3
Fig. 3. Mogamulizumab efficiently depletes eTreg cells in both peripheral blood and tumor tissues.
a Summaries for the frequencies of CD4+ T cells (***p < 0.0001) and CD8+ T cells (***p < 0.0001) at pre- and post-mogamulizumab treatment are shown. PBMCs (n = 25) obtained from pre- and post-mogamulizumab treatment as in Fig. 2 and were subjected to flow cytometry. b The ratio of CD8+ T cells to CD4+ T cells (**p = 0.0016) or eTreg cells (***p < 0.0001) with the absolute number of the cells at pre- and post-mogamulizumab treatment is shown. c Summaries for the frequencies of each CD4+ T cell fraction (Fr. II, ***p < 0.0001; Fr. III, ***p < 0.0001; Fr. IV, *p = 0.0136 and Fr. V, **p = 0.0021) as depicted in Fig. 2c at pre- and post-mogamulizumab treatment are shown. PBMC samples (n = 25) as in (a) were subjected to flow cytometry in (b and c). d Changes in CCR4 expression levels of CCR4+CD4+ T cells (Fr. II, ***p < 0.0001 and Fr. III, **p = 0.0002) according to the mean fluorescence intensity (MFI) at pre- and post-mogamulizumab treatment are shown (n = 9). e Longitudinal changes in the frequencies of Treg cells (Fr. II) in CD4+ T cells at pre- and post-mogamulizumab treatment are shown (n = 9). Red lines, long survivors; blue lines, short survivors. f Fresh tumor samples (10 mg / approximately 4 ×4 x 4 mm3) obtained from a gastric cancer patient by endoscopic biopsy at pre- and post-mogamulizumab administration were subjected to flow cytometry. Flow cytometry staining for CD45RA and FoxP3 in CD4+ T cells (left) and changes of the absolute number of each FoxP3+ T cell fraction (right) are shown. In (a–d), black dots, patients who received 1.0 mg/kg mogamulizumab; blue dots, patients who received 0.1 mg/kg mogamulizumab and two-sided Mann–Whitney test was used. In a–d, the center line indicates the median, and the box limits indicate the 1st and 3rd quartiles. The whiskers go down to the smallest value and up to the largest. week: wk. *p < 0.05, **p < 0.005, ***p < 0.0001. Source data are provided as a Source Data file.
Fig. 4
Fig. 4. Central memory CD8+ T cells with CCR4 expression are decreased after mogamulizumab treatment.
a Summaries for the frequencies of each CD8+ T cell fraction (central memory CD8+ T cells, *p = 0.0354) as depicted in Fig. 2f at pre- and post-mogamulizumab treatment are shown. PBMC samples (n = 14), as in Fig. 2, were subjected to flow cytometry. b, c Representative flow cytometry staining for CCR4 in each CD8+ T cell fraction in comparison with that in eTreg cells (b) and summary for the CCR4 expression levels (MFI) in central memory CD8+ T cells (to eTreg cells, **p = 0.0083), effector-memory CD8+ T cells (to eTreg cells, **p = 0.0001 and to central memory CD8+ T cells, **p = 0.0028), TEMRA CD8+ T cells (to eTreg cells, ***p < 0.0001 and to central memory CD8+ T cells, *p = 0.0332) and eTreg cells (c) are shown (n = 12). Red line, eTreg cells; blue line, central memory CD8+ T cells; black line, effector-memory CD8+ T cells; green line, TEMRA CD8+ T cells; filled gray area, control staining. d Sequencing tracks of ATAC-seq regarding four T cell subsets (naive CD8+ T cells, central memory CD8+ T cells, effector-memory CD8+ T cells and Treg cells) and FoxP3 ChIP-seq about Treg cells around the CCR4 gene locus. The normalized ATAC-seq and ChIP-seq read coverage were used to visualize the tracks. ATAC seq about each T cell subset (gray: naive CD8+ T cells, blue: central memory CD8+ T cells, black: effector-memory CD8+ T cells, red: Treg cells) and FoxP3 ChIP-seq about Treg cells (green: Treg cells, light green: naive Treg cells, grey: IP control) are shown. e Ratio of CCR4 expression levels (mean fluorescence intensity: MFI) in central memory CD8+ T cells to eTreg cells (*p = 0.0393) in long survivors (≥1 year, n = 6) and short survivors (< 1 year, n = 6) is shown. f The frequency of central memory CD8+ T cells in CD8+ T cells after mogamulizumab treatment (*p = 0.0325) in long survivors and short survivors is shown (n = 6). In (a, c, e and f), black dots, patients who received 1.0 mg/kg mogamulizumab; blue dots, patients who received 0.1 mg/kg mogamulizumab. In (a and c), two-sided, (e and f), one-sided Mann–Whitney test was used. In a, the center line indicates the median, and the box limits indicate the 1st and 3rd quartiles. The whiskers go down to the smallest value and up to the largest. week: wk, naive CD8+ T cells: Naive, central memory CD8+ T cells: Central memory, effector-memory CD8+ T cells: Effector memory, TEMRA CD8+ T cells: TEMRA. *p < 0.05, **p < 0.005, ***p < 0.0001. Source data are provided as a Source Data file.
Fig. 5
Fig. 5. NK cells exhibit an exhausted phenotype in long survivors.
a, b Representative flow cytometry staining (left) for PD-1 (a) and LAG-3 (b) in NK cells and summaries (right) for the frequencies of NK cells at pre-mogamulizumab treatment (PD-1, p = 0.197 and LAG-3, p = 0.3095) in long survivors (≥1 year) and short survivors (< 1 year) are shown. PBMC samples (long survivors: n = 6, short survivors: n = 6), as in Fig. 4, were subjected to flow cytometry. c The distinct ADCC activity by exhausted NK cells. LAG-3-PD-1-, LAG-3+PD-1- and LAG-3+PD-1+ NK cells derived from PBMCs of healthy individuals (n = 5) were co-cultured with CD4+ T cells in the presence of mogamulizumab, and reduction of eTreg cells was examined. Representative flow cytometry data (left) and summary for depletion efficacy of eTreg cells (LAG-3+PD-1- NK cells, *p = 0.0159 and LAG-3+PD-1+ NK cells, **p = 0.0079) are shown (right). d The frequencies of CCR4-expressing cells (top) and expression levels (mean fluorescence intensity: MFI) of CCR4 (bottom) in each CD8+ T cell fraction and eTreg cells in PBMCs from healthy individuals (n = 7). The differences between each CD8+ T cell fraction and eTreg cells were ***p < 0.0001 in the frequencies and the expression levels. The differences between central memory CD8+ T cells and Naive CD8+ T cells, and effector memory CD8+ T cells, and TEMRA CD8+ T cells were **p = 0.0027, *p = 0.017 and **p = 0.0024, respectively in the frequencies of CCR4-expressing cells; were *p = 0.0286, **p = 0.0059 and *p = 0.0211, respectively in the expression levels of CCR4. e Reduction of central memory CD8+ T cells (left) and eTreg cells (right) after mogamulizumab treatment. PBMC samples from healthy individuals (n = 12) were cultured with the indicated dose of mogamulizumab. Changes in each T cell fraction were examined (10 µg/mL, *p = 0.043 in central memory CD8+ T cells and 10–0.00001 µg/mL, ***p < 0.0001 in eTreg cells). In (a and b), black dots, patients who received 1.0 mg/kg mogamulizumab; blue dots patients who received 0.1 mg/kg mogamulizumab. Naive CD8+ T cells: Naive, central memory CD8+ T cells: Central memory, effector-memory CD8+ T cells: Effector memory, TEMRA CD8+ T cells: TEMRA. In (a and b), one-sided Mann–Whitney test was used. In (c), two-sided Mann–Whitney test was used. In (d and e), two-sided Dunnett test was used. In (e), the center line indicates the median, and the box limits indicate the 1st and 3rd quartiles. The whiskers go down to the smallest value and up to the largest. *p < 0.05, **p < 0.005, ***p < 0.0001. Source data are provided as a Source Data file.

References

    1. Hanahan D, Weinberg RA. Hallmarks of cancer: the next generation. Cell. 2011;144:646–674. - PubMed
    1. Borghaei H, et al. Nivolumab versus docetaxel in advanced nonsquamous non-small-cell lung cancer. N. Engl. J. Med. 2015;373:1627–1639. - PMC - PubMed
    1. Rizvi NA, et al. Cancer immunology. Mutational landscape determines sensitivity to PD-1 blockade in non-small cell lung cancer. Science. 2015;348:124–128. - PMC - PubMed
    1. Schreiber RD, Old LJ, Smyth MJ. Cancer immunoediting: integrating immunity’s roles in cancer suppression and promotion. Science. 2011;331:1565–1570. - PubMed
    1. Sharma P, Allison JP. Immune checkpoint targeting in cancer therapy: toward combination strategies with curative potential. Cell. 2015;161:205–214. - PMC - PubMed

Publication types

MeSH terms

Associated data