. 2021 Dec 14;12(1):7272.
doi: 10.1038/s41467-021-27532-w.

The effect of COVID-19 vaccination in Italy and perspectives for living with the virus

Affiliations

The effect of COVID-19 vaccination in Italy and perspectives for living with the virus

Valentina Marziano et al. Nat Commun. .

Abstract

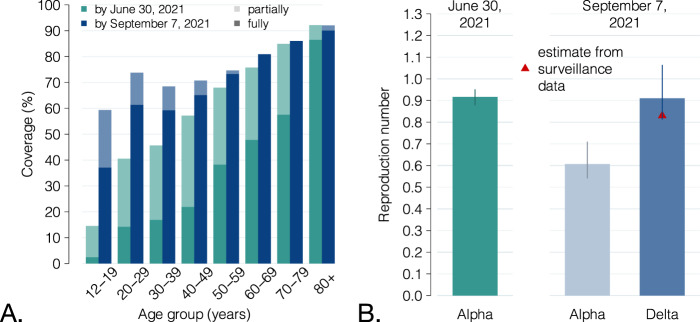
COVID-19 vaccination is allowing a progressive release of restrictions worldwide. Using a mathematical model, we assess the impact of vaccination in Italy since December 27, 2020 and evaluate prospects for societal reopening after emergence of the Delta variant. We estimate that by June 30, 2021, COVID-19 vaccination allowed the resumption of about half of pre-pandemic social contacts. In absence of vaccination, the same number of cases is obtained by resuming only about one third of pre-pandemic contacts, with about 12,100 (95% CI: 6,600-21,000) extra deaths (+27%; 95% CI: 15-47%). Vaccination offset the effect of the Delta variant in summer 2021. The future epidemic trend is surrounded by substantial uncertainty. Should a pediatric vaccine (for ages 5 and older) be licensed and a coverage >90% be achieved in all age classes, a return to pre-pandemic society could be envisioned. Increasing vaccination coverage will allow further reopening even in absence of a pediatric vaccine.


Conflict of interest statement

M.A. has received research funding from Seqirus. The funding is not related to COVID-19. All other authors declare no competing interest.

Figures

Fig. 1
Fig. 1. Characteristics of the COVID-19 epidemic in Italy during the first half of 2021.
A Weekly incidence per 100,000 population of SARS-CoV-2 confirmed cases (the x axis reports the starting day of the considered week); bars: data from the Italian Integrated Surveillance System; line and shaded area: mean and 95% CI of the model estimates; n = 300 stochastic model realizations. B Total number of COVID-19 deaths over the study period (in thousands) among vaccinated (partially or fully) and unvaccinated individuals. Green: mean (bar) and 95% CI (vertical lines) of the model estimates (n = 300 stochastic model realizations); red: data from the Italian Integrated Surveillance System. C Weekly percentage of confirmed SARS-CoV-2 cases occurring in fully vaccinated individuals over the total. The fraction of cases in completely vaccinated individuals increases over time because of the progressive increase in the vaccinated population. Green: mean (bar) and 95% CI (vertical lines) of the model estimates (n = 300 stochastic model realizations); red: data from the Italian Integrated Surveillance System. D Mean estimates of the immunity profile of the Italian population, overall and by age groups, on June 30, 2021 (n = 300 stochastic model realizations). Individuals who have been infected after being vaccinated or who have been vaccinated despite still having a protection from infection are counted under the natural protection bar; individuals who have never been infected or who have lost their natural protection and were vaccinated (partially or fully) are included under the vaccine-induced protection bar; individuals who were never vaccinated nor infected, or who were infected but lost their natural protection, or who were vaccinated but lost their vaccine-induced protection are included under the fully susceptible bar.
Fig. 2
Fig. 2. Impact of the vaccination program during the first half of 2021.
A Estimated active social contacts on June 30, 2021, as a proportion of pre-pandemic contacts, with and without a vaccination program, under the constraint that the two scenarios reproduce the same observed epidemic trajectory. Bars: mean estimates; vertical lines: 95% CI; n = 300 stochastic model realizations. B Number of additional COVID-19 deaths between December 27, 2020, and June 30, 2021, total and by age group, under a no-vaccination scenario. Bars: mean estimates; vertical lines: 95% CI; n = 300 stochastic model realizations. C Effective reproduction number (i.e., under complete resumption of pre-pandemic contacts) on June 30, 2021, with and without vaccination. Bars: mean estimates; vertical lines: 95% CI; n = 300 stochastic model realizations.
Fig. 3
Fig. 3. Vaccination coverage by June 30 and September 7, 2021, and effect of the replacement of the Alpha variant by the Delta variant.
A Comparison between the fraction of the Italian population that was partially and fully vaccinated by June 30, 2021, and by September 7, 2021, by age group. B Green: net reproduction number on June 30, 2021, when the Alpha variant was still largely dominant. Mean and 95% CI as reported in. Light blue: estimated value of the reproduction number, given the progression of the vaccination program until September 7 and under the assumption that the Alpha variant remained dominant; bars: mean estimates; vertical lines: 95% CI; n = 300 stochastic model realizations. Dark blue: the same effect under the assumption of a 50% increase in transmissibility to reproduce the replacement of the Alpha variant with the Delta, occurred during the summer of 2021–,; bars: mean estimates; vertical lines: 95% CI; n = 300 stochastic model realizations. Red triangle: value of the reproduction number as estimated from surveillance data; for this estimate, the 95% CI is not visible at the scale of the plot.
Fig. 4
Fig. 4. Scenarios for the expansion of vaccination coverage.
A Schematic of simulated scenarios. All age classes with coverage below a given value Ω are assumed to progress to Ω; all age classes above Ω will remain at the coverage level achieved on Sep 7. B Proportion of pre-pandemic contacts corresponding to a reproduction number of 1 for three selected vaccination scenarios; levels estimated to be active on June 30, 2021 (with and without vaccination) are reported for comparison. Bars: mean estimates; vertical lines: 95% CI; n = 300 stochastic model realizations. C Heatmap of the mean estimated reproduction number for different vaccination scenarios (x axis) and different levels of social activity (y axis); n = 300 stochastic model realizations. Contour lines discriminate different values of the reproduction number. The thicker contour line represents the epidemic threshold of 1. D As C, but assuming that coverage Ω is achieved also in pediatric age groups (5–11 years).
Fig. 5
Fig. 5. Sensitivity analysis with respect to the transmissibility increase of the Delta with respect to the Alpha variant.
Heatmap of the mean projected reproduction number for different vaccination scenarios (x axis) and different levels of social activity (y axis), n = 300 stochastic model realizations, under a transmissibility increased by A) 25% and B) 75%, compared to the Alpha variant.

References

    1. WHO coronavirus (COVID-19) dashboard. Available at https://covid19.who.int/. Accessed on Mar 15, 2021.
    1. Trentini, F. et al. Pressure on the Health-Care System and Intensive Care Utilization During the COVID-19 Outbreak in the Lombardy Region of Italy: A Retrospective Observational Study in 43,538 Hospitalized Patients. Am. J. Epidemiol. kwab252 (2021). - PMC - PubMed
    1. McKibbin, W. & Fernando, R. The economic impact of COVID-19. Economics in the Time of COVID-19, 45 (2020).
    1. Pfefferbaum B, North CS. Mental health and the Covid-19 pandemic. N. Engl. J. Med. 2020;383:510–512. doi: 10.1056/NEJMp2008017. - DOI - PubMed
    1. Our world in data. COVID-19 Data Explorer. Available at https://ourworldindata.org/explorers/coronavirus-data-explorer. Accessed on Oct 15, 2021.

Publication types

Substances

Supplementary concepts