. 2021 Dec 14;11(1):23935.
doi: 10.1038/s41598-021-03442-1.

Optimised techniques for high-throughput screening of differentiated SH-SY5Y cells and application for neurite outgrowth assays

Affiliations

Optimised techniques for high-throughput screening of differentiated SH-SY5Y cells and application for neurite outgrowth assays

Anusha Dravid et al. Sci Rep. .

Abstract

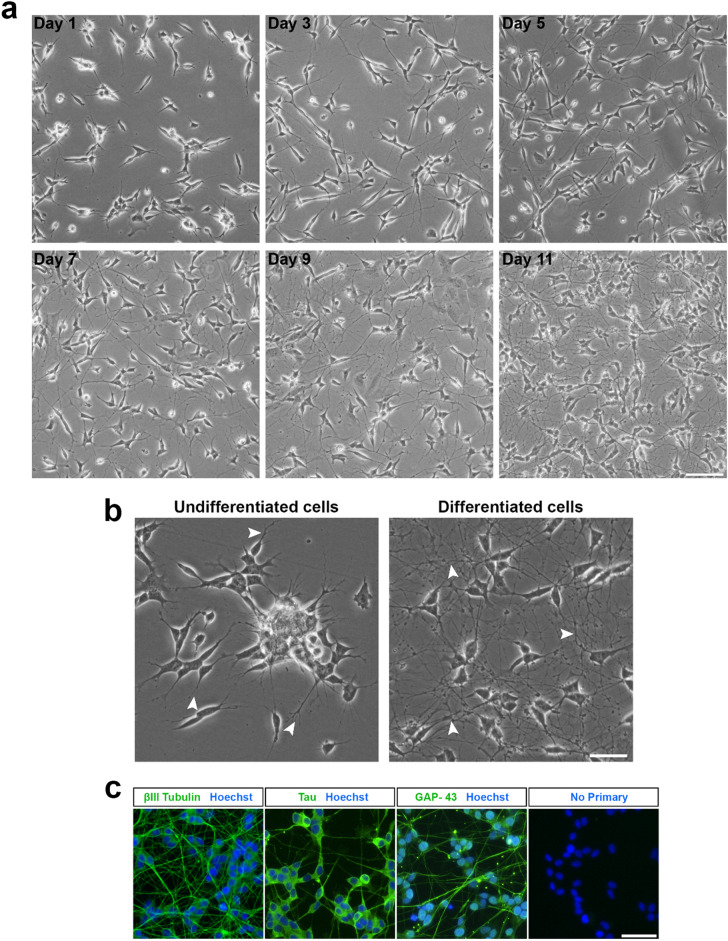
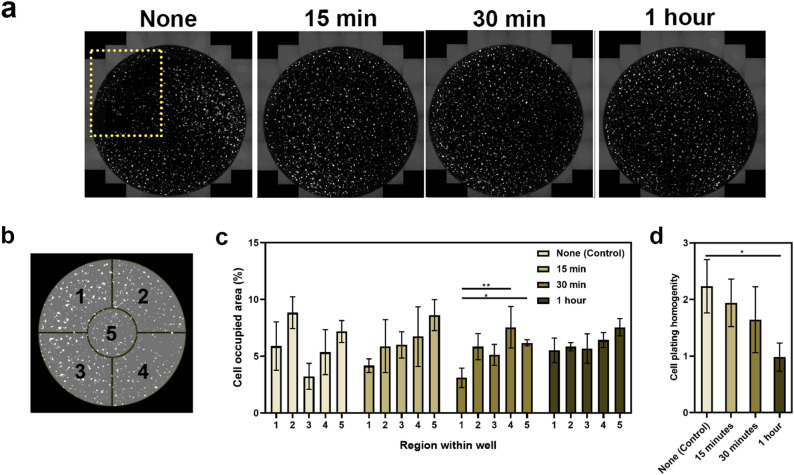
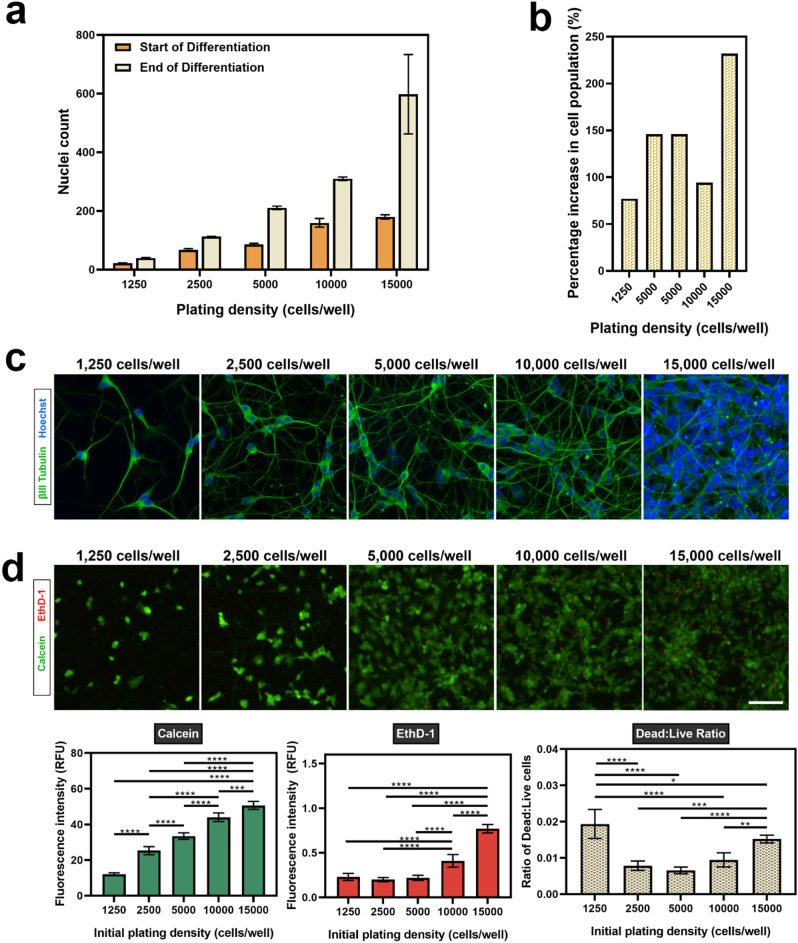
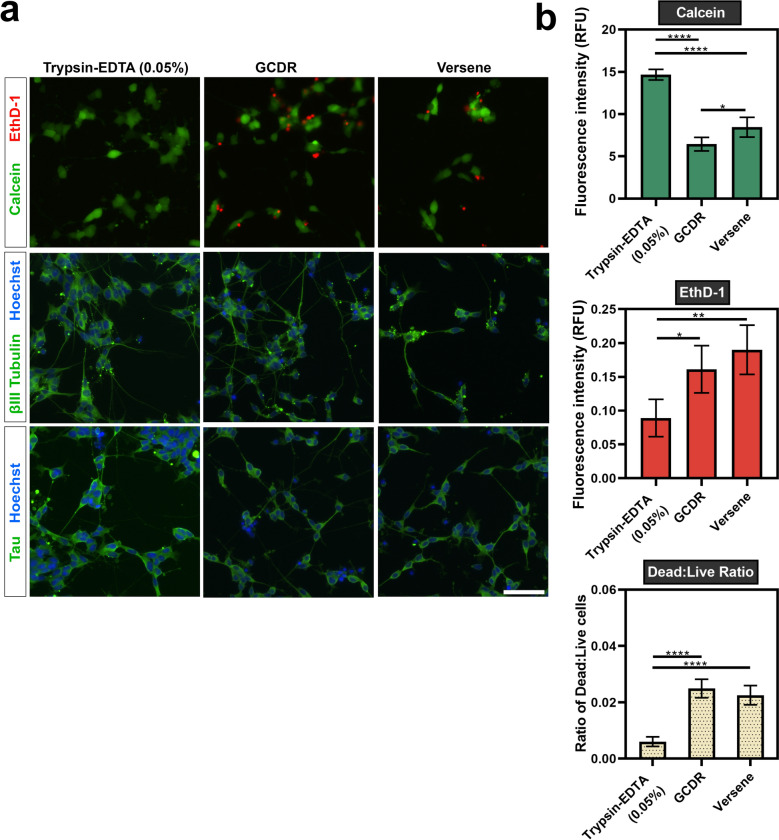
Neuronal models are a crucial tool in neuroscientific research, helping to elucidate the molecular and cellular processes involved in disorders of the nervous system. Adapting these models to a high-throughput format enables simultaneous screening of multiple agents within a single assay. SH-SY5Y cells have been widely used as a neuronal model, yet commonly in an undifferentiated state that is not representative of mature neurons. Differentiation of the SH-SY5Y cells is a necessary step to obtain cells that express mature neuronal markers. Despite this understanding, the absence of a standardised protocol has limited the use of differentiated SH-SY5Y cells in high-throughput assay formats. Here, we describe techniques to differentiate and re-plate SH-SY5Y cells within a 96-well plate for high-throughput screening. SH-SY5Y cells seeded at an initial density of 2,500 cells/well in a 96-well plate provide sufficient space for neurites to extend, without impacting cell viability. Room temperature pre-incubation for 1 h improved the plating homogeneity within the well and the ability to analyse neurites. We then demonstrated the efficacy of our techniques by optimising it further for neurite outgrowth analysis. The presented methods achieve homogenously distributed differentiated SH-SY5Y cells, useful for researchers using these cells in high-throughput screening assays.


Conflict of interest statement

The authors declare no competing interests.

Figures

Figure 1
Figure 1
Differentiation of the SH-SY5Y cell line into a neuronal phenotype. (a) Phase contrast images of SH-SY5Y cells at various stages of the differentiation process. Cells were treated with RA (10 µM) for five days, followed by BDNF (50 ng/mL) for an additional five days to achieve terminal differentiation by Day 11. Images were acquired using an EVOS FL microscope at ×10 magnification and 43% brightness (scale bar = 50 μm). (b) Undifferentiated SH-SY5Y cells possess few short projections and cluster together, while differentiated cells are observed to have many extensive projections. Images were acquired at ×20 magnification and 60% brightness using an EVOS FL microscope (scale bar = 25 μm). βIII-tubulin images were acquired using the GFP filter (excitation 482/25 nm; emission 524/24 nm; exposure 110 ms), while Hoechst nuclei images were acquired using the DAPI filter (excitation 357/44 nm; emission 447/60 nm; exposure 19 ms). White arrowheads point towards neurite extensions. (c) Expression of mature neuronal markers by differentiated cells. Fluorescence images were acquired at ×20 magnification using an EVOS FL Auto microscope (scale bar = 25 μm).
Figure 2
Figure 2
Different room temperature pre-incubation periods affect cell plating homogeneity across the well in 96-well plates. (a) Full well scan acquired using the full-well scan function on the EVOS FL Auto microscope with a ×10 objective lens. Yellow box indicates the region where cells are sparsely distributed. (b) Schematic illustration of well divisions into five regions for analysis. (c) Cell plating homogeneity was determined as the standard deviation between each region. This was used to evaluate the efficacy of pre-incubation for different time periods. Each bar represents the mean (n = 3) ± SD. (d) Cell plating homogeneity defined as the standard deviation between each region was used to evaluate the efficacy of pre-incubation for different time periods. Each bar represents the mean (n = 5) ± SD. A one-way ANOVA test and Tukey’s post-hoc analysis was performed to evaluate statistical significance where **p < 0.01 and *p < 0.05.
Figure 3
Figure 3
Cell density of plated SH-SY5Y cells increases during the differentiation period. (a) The nuclei was counted in four regions across each well at day 1 (start) and day 11 (end) of differentiation. (b) Percentage increase in cell population was derived from the nuclei count at day 1 (start) and day 11 (end) of differentiation. Each data point represents the mean (n = 3) ± SD. (c) Representative images of terminally differentiated SH-SY5Y cells at varying initial plating densities. As cells proliferate in culture, initial plating densities impact neurite analysis after terminal differentiation. (d) The viability of terminally differentiated SH-SY5Y cells was evaluated using a LIVE/DEAD assay and fluorescence intensity measurements used to determine viability. Images were acquired using an EVOS FL Auto microscope at ×20 magnification (scale bar = 25 µm). βIII-tubulin images were acquired using the GFP filter (excitation 482/25 nm; emission 524/24 nm; exposure 110 ms), while Hoechst nuclei images were acquired using the DAPI filter (excitation 357/44 nm; emission 447/60 nm; exposure 19 ms). Each bar represents the mean (n = 5) ± SD. A one-way ANOVA test and Tukey’s post-hoc analysis was performed to evaluate statistical significance where ****p < 0.0001, ***p < 0.001, **p < 0.01 and *p < 0.05.
Figure 4
Figure 4
Detachment and re-plating of differentiated SH-SY5Y cells. Terminally differentiated SH-SY5Y cells were re-plated using trypsin–EDTA (0.05%), GCDR or versene and assessed for viability and expression of neuronal markers 48 h after re-plating. (a) Microscopic images of calcein (live) and EthD-1 (dead) labelled cells. Images were acquired using an EVOS FL Auto microscope with a ×20 objective lens (scale bar = 100 µm). βIII-tubulin images were acquired using the GFP filter (excitation 482/25 nm; emission 524/24 nm; exposure 110 ms), while Hoechst nuclei images were acquired using the DAPI filter (excitation 357/44 nm; emission 447/60 nm; exposure 19 ms). (b) Fluorescence emission of calcein and EthD-1 was measured to evaluate viability after re-plating. A one-way ANOVA test and Tukey’s post-hoc analysis was performed to evaluate statistical significance where ****p < 0.0001, ***p < 0.001, **p < 0.01 and *p < 0.05.
Figure 5
Figure 5
Image acquisition for neurite outgrowth analysis. (a) Comparison of images at ×10 (left) and ×20 (right) magnification (scale bars = 25 µm). Differentiated SH-SY5Y cells were labelled with βIII-tubulin and a Hoechst nuclear counterstain. βIII-tubulin images were acquired using the GFP filter (excitation 482/25 nm; emission 524/24 nm), while Hoechst nuclei images were acquired using the DAPI filter (excitation 357/44 nm; emission 447/60 nm). Although the ×10 objective increases the number of cells in the field of view, it is more difficult to visualise finer neurite processes. The ×20 objective acquires images with a higher resolution to distinguish these features. (b) Differences in mean fluorescence intensity of βIII tubulin between the soma, neurites and background. Analysis was performed on images acquired using a ×20 objective. Each bar represents the mean (n = 250 points) ± SD. A one-way ANOVA test and Tukey’s post-hoc analysis was performed to evaluate statistical significance where ****p < 0.0001.
Figure 6
Figure 6
Neurite outgrowth quantification in response to treatment with NGF, BDNF or NT-3. (a) Terminally differentiated cells incubated with neurotrophin medium for 24 h and (b) Terminally differentiated cells incubated with neurotrophin medium for 48 h. (c) Terminally differentiated cells incubated with neurotrophin medium and 10 µg/mL CSPG for 24 h. (d) Terminally differentiated cells incubated with neurotrophin medium and 10 µg/mL CSPG for 48 h. (e) Terminally differentiated cells re-plated with trypsin–EDTA (0.05%) and incubated with neurotrophin medium and 10 µg/mL CSPG for 48 h. Each bar represents the mean ± SD. A one-way ANOVA test and Tukey’s post-hoc analysis was performed to evaluate statistical significance where ****p < 0.0001, ***p < 0.001, **p < 0.01 and *p < 0.05.

References

    1. Azari H, Reynolds BA. In vitro models for neurogenesis. Cold Spring Harbor Perspect. Biol. 2016 doi: 10.1101/cshperspect.a021279. - DOI - PMC - PubMed
    1. Al-Ali H, Beckerman SR, Bixby JL, Lemmon VP. In vitro models of axon regeneration. Exp. Neurol. 2017;287:423–434. doi: 10.1016/j.expneurol.2016.01.020. - DOI - PMC - PubMed
    1. Slanzi A, Iannoto G, Rossi B, Zenaro E, Constantin G. In vitro models of neurodegenerative diseases. Front. Cell Dev. Biol. 2020 doi: 10.3389/fcell.2020.00328. - DOI - PMC - PubMed
    1. Pool M, Thiemann J, Bar-Or A, Fournier AE. NeuriteTracer: A novel ImageJ plugin for automated quantification of neurite outgrowth. J. Neurosci. Methods. 2008;168:134–139. doi: 10.1016/j.jneumeth.2007.08.029. - DOI - PubMed
    1. Yeyeodu ST, Witherspoon SM, Gilyazova N, Ibeanu GC. A rapid, inexpensive high throughput screen method for neurite outgrowth. Curr. Chem. Genomics. 2010;4:74–83. doi: 10.2174/1875397301004010074. - DOI - PMC - PubMed

Publication types

LinkOut - more resources