. 2021 Dec 14;11(1):23933.
doi: 10.1038/s41598-021-03418-1.

Uncovering drug repurposing candidates for head and neck cancers: insights from systematic pharmacogenomics data analysis

Affiliations

Uncovering drug repurposing candidates for head and neck cancers: insights from systematic pharmacogenomics data analysis

Annie Wai Yeeng Chai et al. Sci Rep. .

Abstract

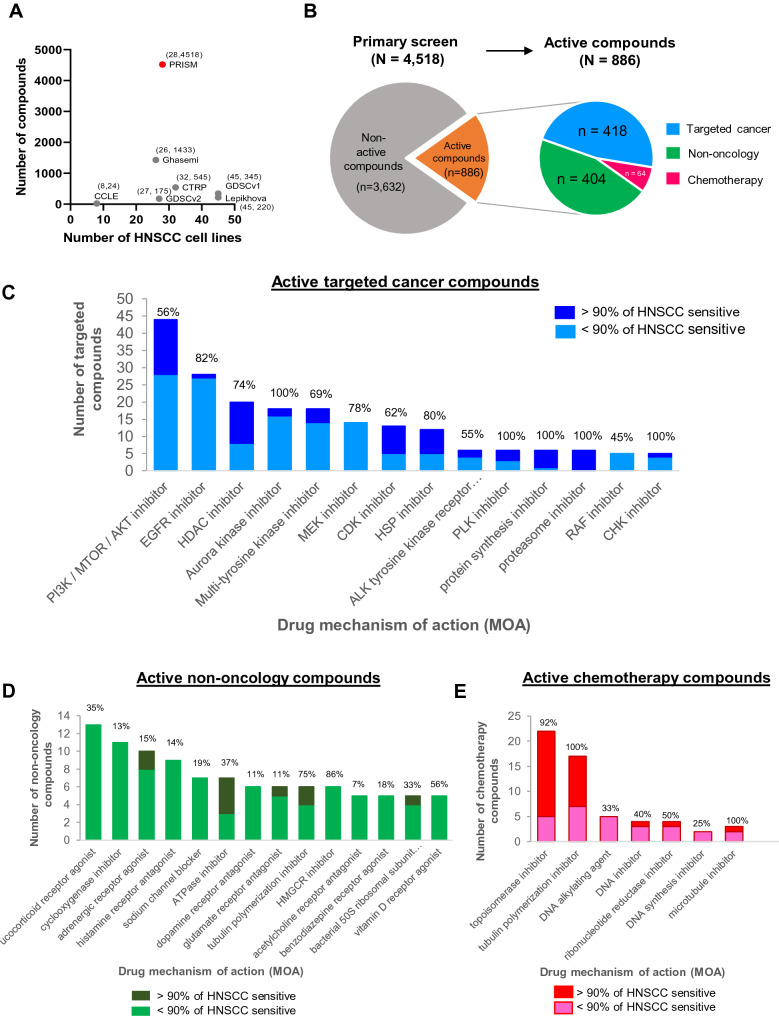
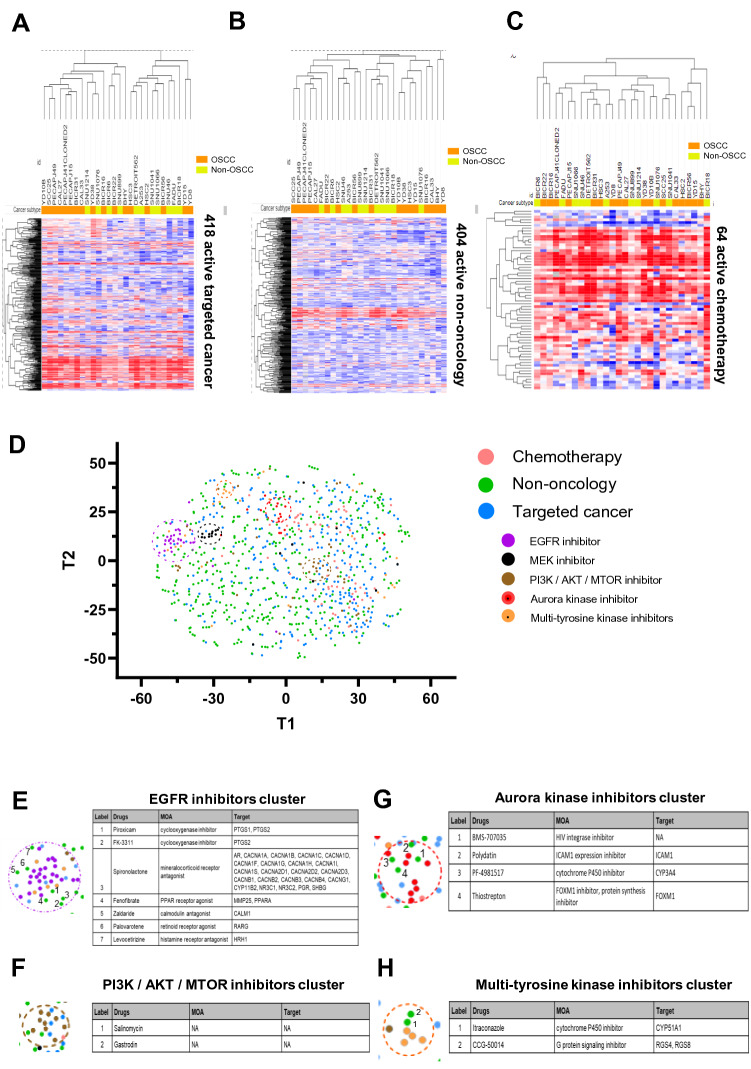
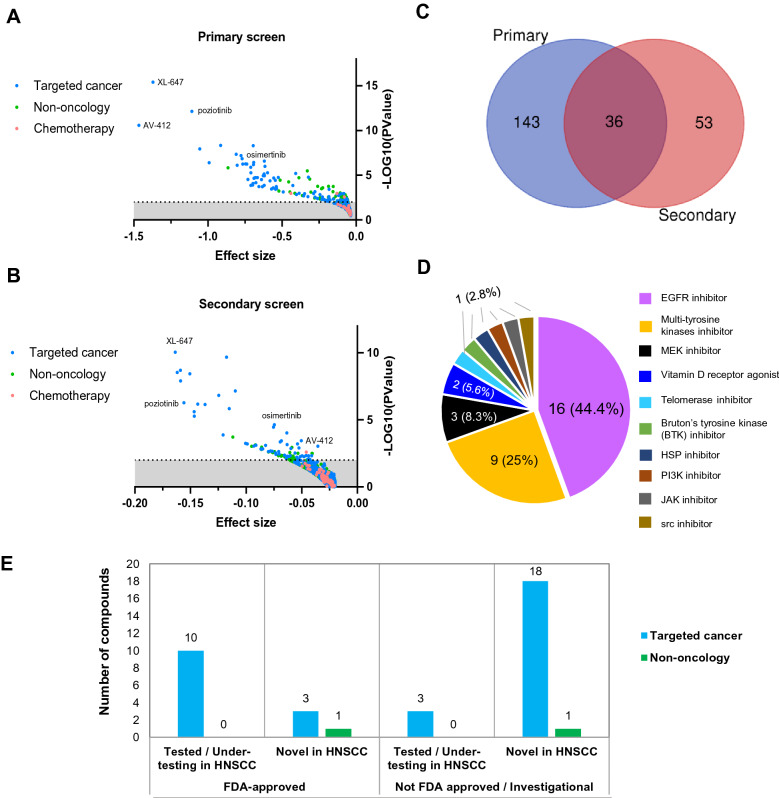
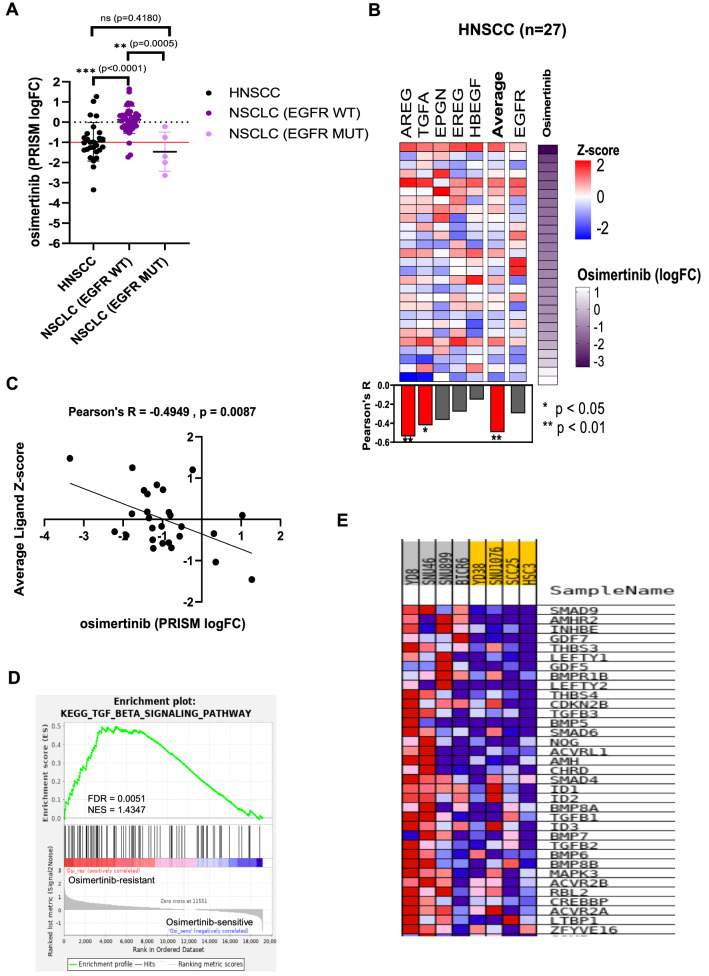
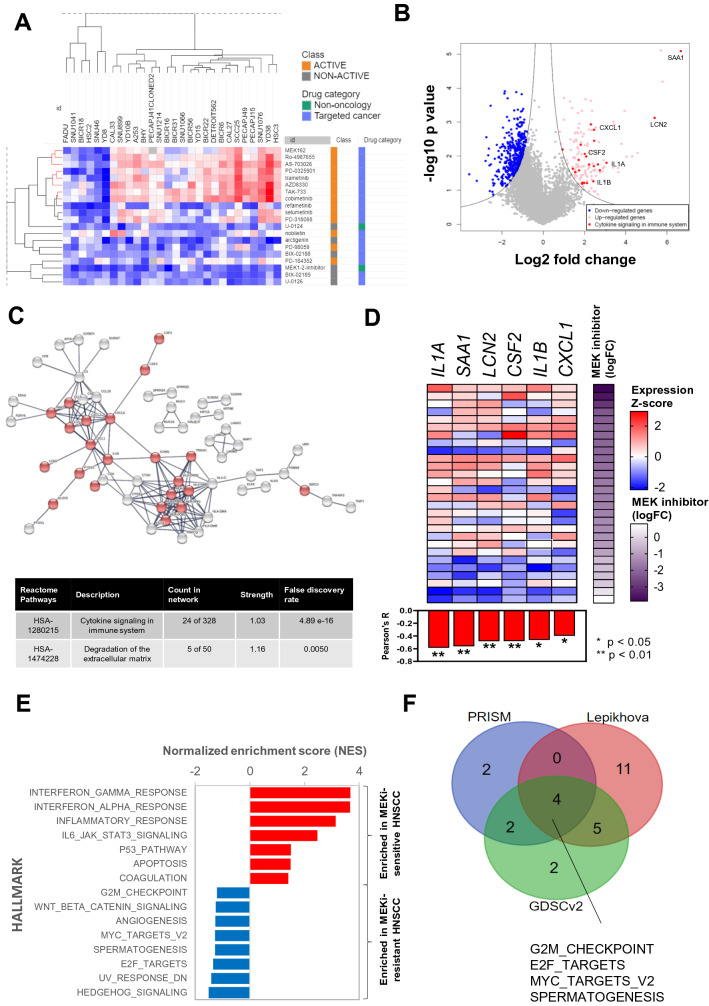
Effective treatment options for head and neck squamous cell carcinoma (HNSCC) are currently lacking. We exploited the drug response and genomic data of the 28 HNSCC cell lines, screened with 4,518 compounds, from the PRISM repurposing dataset to uncover repurposing drug candidates for HNSCC. A total of 886 active compounds, comprising of 418 targeted cancer, 404 non-oncology, and 64 chemotherapy compounds were identified for HNSCC. Top classes of mechanism of action amongst targeted cancer compounds included PI3K/AKT/MTOR, EGFR, and HDAC inhibitors. We have shortlisted 36 compounds with enriched killing activities for repurposing in HNSCC. The integrative analysis confirmed that the average expression of EGFR ligands (AREG, EREG, HBEGF, TGFA, and EPGN) is associated with osimertinib sensitivity. Novel putative biomarkers of response including those involved in immune signalling and cell cycle were found to be associated with sensitivity and resistance to MEK inhibitors respectively. We have also developed an RShiny webpage facilitating interactive visualization to fuel further hypothesis generation for drug repurposing in HNSCC. Our study provides a rich reference database of HNSCC drug sensitivity profiles, affording an opportunity to explore potential biomarkers of response in prioritized drug candidates. Our approach could also reveal insights for drug repurposing in other cancers.


Conflict of interest statement

The authors declare no competing interests.

Figures

Figure 1
Figure 1
Analysis of large-scale drug screening conducted on HNSCC cell lines reveals drug mechanism of action (MOA) of active compounds. (A) Scale of high-throughput drug screening conducted on HNSCC cell lines. The recent PRISM repurposing dataset from the Broad Institute (Corsello et al. 2020) contains the largest number of compounds screened (n = 4,518), including non-oncology compounds (n = 3,466, 77%), that are not covered by other studies. Each dataset is annotated with the number of HNSCC cell lines, x and number of drugs screened, y-(x, y). (B) Using a pre-defined cutoff of -1 log fold change to identify sensitive cell lines to a particular drug, we identified 886 active compounds which have at least three sensitive HNSCC cell lines (> 10%). Among these 886 compounds, 418 were targeted cancer drugs, 404 non-oncology drugs and 64 were chemotherapy drugs. (C) The landscape of the active targeted cancer compounds, grouped according to their mechanisms of action (MOA), displaying only the top MOAs with at least five compounds. (D) The landscape of the top MOAs of active non-oncology compounds, displaying only the top MOAs with at least three compounds (E) The landscape of the top MOAs of active chemotherapy compounds, displaying only the top MOAs with at least five active compounds. For (C)–(E), the percentages indicated on each bar refer to the % of compounds defined as active over the total number of compounds tested on HNSCC lines for the respective MOAs. Different shades of colour depicting > or < 90% of sensitive cell lines for each MOA indicates drug selectivity where a large proportion of drugs with > 90% HNSCC sensitivity shows that drugs with that particular MOA is less selective.
Figure 2
Figure 2
Visualization of drug response data using heatmap with hierarchical clustering and t-distributed stochastic neighbour embedding (tsne) analysis. Heatmap of drug response data from the PRISM primary screen on the 28 HNSCC cell lines, for (A) 418 active targeted cancer compounds; (B) 404 active non-oncology compounds; (C) 64 active chemotherapies. Heatmaps were plotted using Morpheus tool: https://software.broadinstitute.org/morpheus/. (D) High-dimensional reduction of drug response data of 886 active drugs in HNSCC was performed using tsne analysis (perplexity 30, iterations 100). Targeted cancer compounds that belong to the same top MOA classes such as PI3K/AKT/MTOR inhibitors, EGFR inhibitors, MEK inhibitors and Aurora kinase inhibitors cluster closely together. While generally the non-oncology compounds are very scattered across the plot, reflecting the likely diversity of MOAs. (E)–(H) Non-oncology compounds that consistently fall into the (E) EGFR inhibitor cluster, (F) PI3K/AKT/MTOR inhibitor cluster, (G) Aurora kinase inhibitor cluster and (H) Multi-tyrosine kinase inhibitor clusters.
Figure 3
Figure 3
Identification of compounds that are selectively enriched in killing activity in HNSCC. (A) Using the “two-class comparison” function of the DepMap, differential analysis was conducted to compare drug response between HNSCC and non-HNSCC cell lines. Drug response data from the PRISM primary screen was used. Compounds that showed lower mean logFC in HNSCC (negative effect size) are plotted. P value < 0.01 or -log10(pvalue) > 2 is considered statistically significant. The top three most significant compounds that show preferential killing activity among HNSCC are XL-647, AV-412 and poziotinib. (B) Compounds with preferential sensitivity in HNSCC, based on PRISM secondary screen data. (C) Venn diagram of significantly selective compounds identified from primary and secondary screen shortlisted 36 common compounds (D) Of the 36 shortlisted compounds, mainly are EGFR inhibitors (n = 16, 44.4%), multi-tyrosine kinase inhibitors (n = 9, 25%) and MEK inhibitors (n = 3, 8.3%). (E) Classification of the 36 compounds based on their drug category, FDA approval status and novelty. Among these, ten targeted cancer compounds had been tested in HNSCC, including several EGFR inhibitors such as afatinib and gefitinib, as well as MEK inhibitors such as trametinib and cobimetinib. On the other hand, three targeted cancer compounds (osimertinib, neratinib and bosutinib) are potentially good novel candidates for drug repurposing as these are FDA-approved, but have yet to be tested on HNSCC in clinical trials. The majority of the compounds fall into the category of non-FDA approved and have never been tested in HNSCC (n = 18 targeted therapy and n = 1 non-oncology).
Figure 4
Figure 4
Identification of biomarker of response for osimertinib. (A) The mean logFC from the PRISM primary screen for osimertinib in HNSCC is comparable with NSCLC with EGFR mutations (P = 0.4180). Both the clinically responsive subset (NSCLC with EGFR mutation) (P = 0.0005) and unselected HNSCC (P < 0.0001) have mean logFC that are significantly lower than the subset of NSCLC without EGFR mutation. (B) Pearson’s correlation of EGFR ligands (AREG, TGFA, EPGN, EREG and HBEGF) or EGFR gene expression with osimertinib sensitivity in 28 HNSCC cell lines (each row is a cell line). (C) Average EGFR ligands expression (Z-score) is significantly correlated with osimertinib sensitivity (logFC) (Pearson’s R = -0.4949, P = 0.0087). (D) Gene set enrichment analysis (GSEA) reveal significant upregulation of the TGF-beta signalling pathway among the osimertinib-resistant cell lines. (E) Gene expression heatmap from GSEA, showing the up-regulated genes within the TGF-beta signalling pathway. (A) to (C) were plotted using GraphPad Prism software 8.0.2. (D) and (E) were figures generated from running the GSEA modules from GenePattern 2 (https://www.genepattern.org/).
Figure 5
Figure 5
Uncovering candidate biomarkers of response and possible mechanism of intrinsic resistance towards MEKi. (A) Heatmap (generated using Morpheus tool: https://software.broadinstitute.org/morpheus/) with hierarchical clustering showing the drug sensitivity profile of 28 HNSCC cell lines towards all 20 MEKi. Some subclusters (in red) consisting of eight MEK inhibitors showed a largely similar pattern of sensitivity. (B) Volcano plot of differentially expressed genes between MEKi-sensitive and MEKi-resistant HNSCC. (C) STRING network analysis of 136 significantly upregulated genes among the MEKi-sensitive cell lines, revealed enrichment of REACTOME pathway (HSA-1280215-“Cytokines signalling in immune system” [highlighted in red]. A total of 24 genes were in this Reactome pathway (unconnected nodes are hidden). (D) Pearson’s correlation between the gene expression of six cytokines (IL1A, SAA1, LCN2, CSF2, IL1B and CXCL1) with significant correlation with the average potential drug sensitivity against MEKi (n = 28). Graph was plotted using GraphPad Prism software 8.0.2. (E) GSEA analysis of MEKi-sensitive and MEKi-resistant cell lines, with immune-related hallmark pathways being enriched among MEKi-sensitive HNSCC; While in MEKi-resistant HNSCC, hallmarks that are enriched are proliferation or cell cycle-related pathways. (F) Comparison of enriched hallmarks among the MEKi-resistant HNSCC, from GDSCv2 and Lepikhova datasets. The hallmarks of E2F_Targets, MYC_Targets_V2, G2M_checkpoint and spermatogenesis are consistently associated with MEKi resistance.

References

    1. Sung H, et al. Global cancer statistics 2020: GLOBOCAN estimates of incidence and mortality worldwide for 36 cancers in 185 countries. CA Cancer J. Clin. 2021 doi: 10.3322/caac.21660. - DOI - PubMed
    1. Barretina J, et al. The cancer cell line encyclopedia enables predictive modelling of anticancer drug sensitivity. Nature. 2012;483:603–607. doi: 10.1038/nature11003. - DOI - PMC - PubMed
    1. Basu A, et al. An interactive resource to identify cancer genetic and lineage dependencies targeted by small molecules. Cell. 2013;154:1151–1161. doi: 10.1016/j.cell.2013.08.003. - DOI - PMC - PubMed
    1. Yang W, et al. Genomics of drug sensitivity in cancer (GDSC): a resource for therapeutic biomarker discovery in cancer cells. Nucleic Acids Res. 2013;41:D955–961. doi: 10.1093/nar/gks1111. - DOI - PMC - PubMed
    1. Iorio F, et al. A landscape of pharmacogenomic interactions in cancer. Cell. 2016;166:740–754. doi: 10.1016/j.cell.2016.06.017. - DOI - PMC - PubMed

Publication types

MeSH terms

Substances