Meta-Analysis
. 2021 Dec 14;11(1):24007.
doi: 10.1038/s41598-021-03533-z.

The minor T allele of the MUC5B promoter rs35705950 associated with susceptibility to idiopathic pulmonary fibrosis: a meta-analysis

Affiliations
Meta-Analysis

The minor T allele of the MUC5B promoter rs35705950 associated with susceptibility to idiopathic pulmonary fibrosis: a meta-analysis

Xiaozheng Wu et al. Sci Rep. .

Abstract

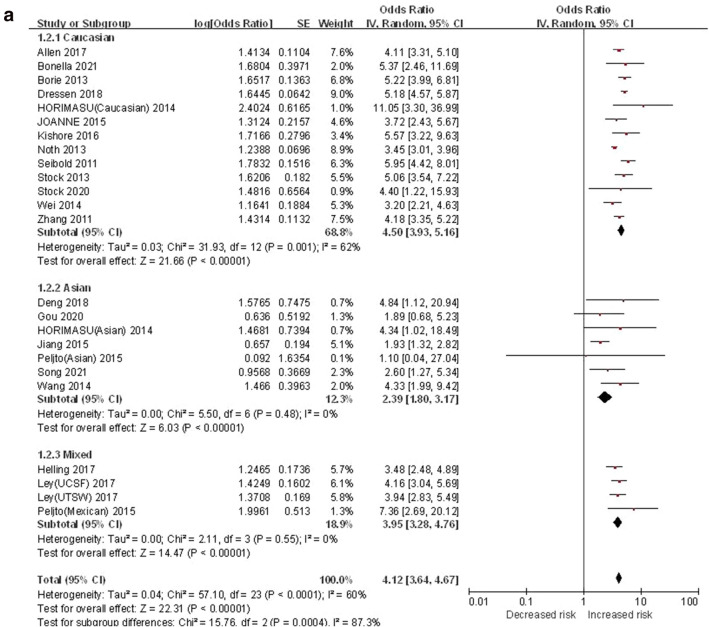
MUC5B promoter rs35705950 T/G gene polymorphism has been associated with the risk of IPF, but the influence of this relationship varies among different populations. In the past 2 years, there were new clinical studies with different results, but none of them reached unified conclusions. Therefore, this study further included the latest case-control studies, integrated their results and carried out meta-analysis on them to draw reliable conclusions. PubMed, EMBASE, CNKI, Wanfang database and VIP Chinese science were searched by a computer to collect the related literatures of MUC5B gene polymorphism and IPF susceptibility published before June 15, 2021. The first author, year of publication, diagnostic criteria and gene frequency were extracted after screened them. Forest plot was drawn and the trial sequential analysis (TSA) was carried out to confirm the stability of the meta-analysis results. Registration number: CRD42021272940. A total of 24 case-control studies (13 studies on the Caucasian, 7 studies on the Asian and 4 studies on the mixed population), and a total of 6749 IPF patients and 13,898 healthy controls were included in this study. The T vs.G, TT vs. GG, GT vs. GG, GT + TT vs. GG and TT vs. GG + GT genetic models of MUC5B promoter rs35705950 T/G polymorphism were associated with IPF risk in all populations, and the effect values were ([OR] 4.12, 95% CI [3.64, 4.67]), ([OR] 10.12, 95% CI [7.06, 14.49]), ([OR] 4.84, 95% CI [3.85, 6.08]), ([OR] 4.84, 95% CI [3.79, 6.19]) and ([OR] 5.11, 95% CI [4.02, 6.49]), respectively. The results of TSA confirmed the stability of the results. Subgroup analysis showed that T vs.G, TT vs. GG, GT vs. GG, GT + TT vs. GG and TT vs. GG + GT genetic models of MUC5B polymorphism were associated with IPF risk in Caucasian population. The effect values were ([OR] 4.50, 95% CI [3.93, 5.16]), ([OR] 10.98, 95% CI [7.59, 15.89]), ([OR] 6.27, 95% CI [5.37, 7.32]), ([OR] 6.30, 95% CI [5.19, 7.64]) and ([OR] 5.15, 95% CI [4.01, 6.61]), respectively. Similar results were also found in Asian and mixed populations. The association strength of the minor T allele in the Caucasian was more significant than that of the Asian population ([OR] 4.50 vs. [OR] 2.39), and the association strength of all genetic models carrying "T" was more significant than that of the Asian population ([OR] 10.98 vs. [OR] 4.29). In Caucasian, Asian and mixed populations, T minor allele carriers were more likely to be susceptible to pulmonary fibrosis, and TT genotype carriers were more likely to be susceptible to IPF than GT genotype carriers. The association between IPF and Caucasian population with minor T allele and all "T" genetic model was more significant than that of Asian population.


Conflict of interest statement

The authors declare no competing interests.

Figures

Figure 1
Figure 1
PRISMA literature screening flow chart.
Figure 2
Figure 2
The T vs. G model was used to evaluate the correlation between MUC5B gene polymorphism and IPF susceptibility. (a) Forest plot of T vs. G genetic model. (b) Trial sequential analysis of MUC5B polymorphism and IPF risk using the allelic model (T vs. G) (Adjusted Boundaries Print). The combined sample size (N = 32,884) exceeded RIS (N = 26,956), the cumulative Z curve crossed the conventional boundary and the TSA boundary, and the association was established in advance. (c) Inverted funnel chart of T vs. G.
Figure 2
Figure 2
The T vs. G model was used to evaluate the correlation between MUC5B gene polymorphism and IPF susceptibility. (a) Forest plot of T vs. G genetic model. (b) Trial sequential analysis of MUC5B polymorphism and IPF risk using the allelic model (T vs. G) (Adjusted Boundaries Print). The combined sample size (N = 32,884) exceeded RIS (N = 26,956), the cumulative Z curve crossed the conventional boundary and the TSA boundary, and the association was established in advance. (c) Inverted funnel chart of T vs. G.
Figure 3
Figure 3
The TT vs. GG model was used to evaluate the correlation between MUC5B gene polymorphism and IPF susceptibility. (a) Forest plot of TT vs. GG genetic model. (b) Trial sequential analysis of MUC5B polymorphism and IPF risk using the additive genetic model (TT vs. GG) (Adjusted Boundaries Print). Although the combined sample size (N = 7690) did not exceed RIS (N = 16,994), the cumulative Z curve crossed the conventional boundary and the TSA boundary, and the association was established in advance. (c) Inverted funnel chart of TT vs. GG.
Figure 3
Figure 3
The TT vs. GG model was used to evaluate the correlation between MUC5B gene polymorphism and IPF susceptibility. (a) Forest plot of TT vs. GG genetic model. (b) Trial sequential analysis of MUC5B polymorphism and IPF risk using the additive genetic model (TT vs. GG) (Adjusted Boundaries Print). Although the combined sample size (N = 7690) did not exceed RIS (N = 16,994), the cumulative Z curve crossed the conventional boundary and the TSA boundary, and the association was established in advance. (c) Inverted funnel chart of TT vs. GG.
Figure 4
Figure 4
The GT vs. GG model was used to evaluate the correlation between MUC5B gene polymorphism and IPF susceptibility. (a) Forest plot of GT vs. GG genetic model. (b) Trial sequential analysis of MUC5B polymorphism and IPF risk using the heterozygous genetic model (GT vs. GG) (Adjusted Boundaries Print). Although the combined sample size (N = 12,737) did not exceed RIS (N = 53,898), the cumulative Z curve crossed the conventional boundary and the TSA boundary, and the association was established in advance. (c) Inverted funnel chart of GT vs. GG.
Figure 4
Figure 4
The GT vs. GG model was used to evaluate the correlation between MUC5B gene polymorphism and IPF susceptibility. (a) Forest plot of GT vs. GG genetic model. (b) Trial sequential analysis of MUC5B polymorphism and IPF risk using the heterozygous genetic model (GT vs. GG) (Adjusted Boundaries Print). Although the combined sample size (N = 12,737) did not exceed RIS (N = 53,898), the cumulative Z curve crossed the conventional boundary and the TSA boundary, and the association was established in advance. (c) Inverted funnel chart of GT vs. GG.
Figure 5
Figure 5
The GT + TT vs. GG model was used to evaluate the correlation between MUC5B gene polymorphism and IPF susceptibility. (a) Forest plot of GT + TT vs. GG genetic model. (b) Trial sequential analysis of MUC5B polymorphism and IPF risk using the dominant genetic model (GT + TT vs. GG) (Adjusted Boundaries Print). Although the combined sample size (N = 13,162) did not exceed RIS (N = 49,050), the cumulative Z curve crossed the conventional boundary and the TSA boundary, and the association was established in advance. (c) Inverted funnel chart of GT + TT vs. GG.
Figure 5
Figure 5
The GT + TT vs. GG model was used to evaluate the correlation between MUC5B gene polymorphism and IPF susceptibility. (a) Forest plot of GT + TT vs. GG genetic model. (b) Trial sequential analysis of MUC5B polymorphism and IPF risk using the dominant genetic model (GT + TT vs. GG) (Adjusted Boundaries Print). Although the combined sample size (N = 13,162) did not exceed RIS (N = 49,050), the cumulative Z curve crossed the conventional boundary and the TSA boundary, and the association was established in advance. (c) Inverted funnel chart of GT + TT vs. GG.
Figure 6
Figure 6
The TT vs. GG + GT model was used to evaluate the correlation between MUC5B gene polymorphism and IPF susceptibility. (a) Forest plot of TT vs. GG + GT genetic model. (b) Trial sequential analysis of MUC5B polymorphism and IPF risk using the recessive genetic model (TT vs. GG + GT) (Adjusted Boundaries Print). The combined sample size (N = 11,454) exceeded RIS (N = 11,030), the cumulative Z curve crossed the conventional boundary and the TSA boundary, and the association was established in advance. (c) Inverted funnel chart of TT vs. GG + GT.
Figure 6
Figure 6
The TT vs. GG + GT model was used to evaluate the correlation between MUC5B gene polymorphism and IPF susceptibility. (a) Forest plot of TT vs. GG + GT genetic model. (b) Trial sequential analysis of MUC5B polymorphism and IPF risk using the recessive genetic model (TT vs. GG + GT) (Adjusted Boundaries Print). The combined sample size (N = 11,454) exceeded RIS (N = 11,030), the cumulative Z curve crossed the conventional boundary and the TSA boundary, and the association was established in advance. (c) Inverted funnel chart of TT vs. GG + GT.

References

    1. Raghu G, Rochwerg B, Zhang Y, et al. An official ATS/ERS/JRS/ALAT clinical practice guideline: Treatment of idiopathic pulmonary fibrosis: An update of the 2011 clinical practice guideline. Am. J. Respir. Crit. Care Med. 2015;192(2):e3–e19. - PubMed
    1. Society of Respiratory Diseases, Chinese Medical Association Guidelines for the diagnosis and treatment of idiopathic pulmonary (interstitial) fibrosis (draft) Chin. J. Tubercul. Respir. 2002;25(7):387–389.
    1. Kaul B, Lee JS, Zhang N, Vittinghoff E, Sarmiento K, Collard HR, Whooley MA. Epidemiology of idiopathic pulmonary fibrosis among U. S. Veterans, 2010–2019. Ann. Am. Thorac. Soc. 2021 doi: 10.1513/AnnalsATS.202103-295OC. - DOI - PMC - PubMed
    1. Loyd JE. Pulmonary fibrosis in families. Am. J. Respir. Cell Mol. Biol. 2003;29:S47–S50. - PubMed
    1. Ley B, Brown KK, Collard HR. Molecular biomarkers in idiopathic pulmonary fibrosis. Am. J. Physiol. Lung Cell. Mol. Physiol. 2014;307(9):L681–L691. - PMC - PubMed

Publication types