. 2022 Oct;18(10):1721-1735.
doi: 10.1002/alz.12523. Epub 2021 Dec 15.

In situ spatial glycomic imaging of mouse and human Alzheimer's disease brains

Affiliations

In situ spatial glycomic imaging of mouse and human Alzheimer's disease brains

Tara R Hawkinson et al. Alzheimers Dement. 2022 Oct.

Abstract

N-linked protein glycosylation in the brain is an understudied facet of glucose utilization that impacts a myriad of cellular processes including resting membrane potential, axon firing, and synaptic vesicle trafficking. Currently, a spatial map of N-linked glycans within the normal and Alzheimer's disease (AD) human brain does not exist. A comprehensive analysis of the spatial N-linked glycome would improve our understanding of brain energy metabolism, linking metabolism to signaling events perturbed during AD progression, and could illuminate new therapeutic strategies. Herein we report an optimized in situ workflow for enzyme-assisted, matrix-assisted laser desorption and ionization (MALDI) mass spectrometry imaging (MSI) of brain N-linked glycans. Using this workflow, we spatially interrogated N-linked glycan heterogeneity in both mouse and human AD brains and their respective age-matched controls. We identified robust regional-specific N-linked glycan changes associated with AD in mice and humans. These data suggest that N-linked glycan dysregulation could be an underpinning of AD pathologies.

Keywords: MALDI imaging; N-linked glycosylation; bioenergetics; carbohydrate metabolism; neuronal function; synaptic transmission.


Conflict of interest statement

CONFLICTS OF INTEREST

Ramon C. Sun has research support and has received a consultancy fee from Maze Therapeutics. Derek B. Allison received a book royalty from Wolters Kluwer. Matthew S. Gentry has received research support and research compounds from Maze Therapeutics, Valerion Therapeutics, and Ionis Pharmaceuticals. Matthew S. Gentry also received a consultancy fee from Maze Therapeutics, PTC Therapeutics, and the Glut1-Deficiency Syndrome Foundation. Tara R. Hawkinson, Lyndsay E. A. Yong, Kia H. Markussen, Lindsey R. Conroy, Kayla M. Kerch, Lance A. Johnson, Peter T. Nelson, Chi Wang, and Harrison A. Clarke report no disclosures.

Figures
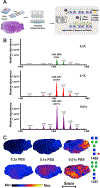
FIGURE 1
FIGURE 1
MALDI-MSI workflow and improved resolution with decreased buffer salt concentrations. (A) Enzyme-assisted MALDI-MSI workflow for the spatial profiling of N-linked glycans in brain sections. Formalin-fixed paraffin-embedded (FFPE) mouse brains were sectioned into 4 μm slices and mounted onto charged microscope slides. Representative histology is shown by an adjacent H&E-stained section. Following antigen retrieval, PNGase F and CHCA matrix were dry sprayed on the tissue slices and directly analyzed by MALDI-MSI. 0.01x, 0.1x, and 0.2x PBS concentrations were tested as the buffer for PNGase F during dry spray. (B) Magnified ion spectra showing the relative abundance Hex5dHex1HexNAc4 (m/z: 1485 rounded to the nearest one) when prepared with 0.01x, 0.1x, and 0.2x PBS. Bolded values on spectra represent m/z (top) and relative abundance (bottom). (C) Spatial distribution of two representative N-linked glycans from adjacent brain sections prepared with 0.01x, 0.1x, and 0.2x PBS. Glycan structures and m/z values (rounded to the nearest 1) are displayed to the right of the brain heatmaps. Blue square: N-acetylglucosamine, green circle: mannose, and red triangle: fucose. Heatmap gradient and scale bar are displayed below images
FIGURE 2
FIGURE 2
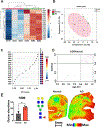
Mouse Alzheimer’s disease (AD) frontal cortices are hyperglycosylated. (A) Two-dimensional clustering heatmap analysis of WT, 5xFAD, and rTg4510 (Tau) mouse models. The top 25 most changed (by one-way ANOVA) N-linked glycans are shown. Three technical replicates extracted from regions of interest (ROIs) in the frontal cortex of each mouse were collected, averaged, and are represented as each biological replicate. (B) Partial least-squares discriminant analysis (PLS-DA) of WT (red) 5xFAD (green) and rTg4510 (tau, blue) mouse models. The 95% confidence interval for each group are shown as shaded areas using the same color as respective groups. (C) Variable importance in projection (VIP) analysis displaying the top 15 N-linked glycans that contributes to PLS-DA clustering in (B). (D) Volcano plot of the fold change between either 5xFAD/WT (top) or rTg4510 (tau)/WT (bottom). N-glycans shown with either 1.5-fold increase or decrease in p-value (log10 ) >0.1 are highlighted in pink
FIGURE 3
FIGURE 3
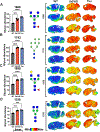
Mouse Alzheimer’s disease (AD) frontal cortices have increased N-linked glycans in multiple regions. (A) Left: The relative abundance of Hex3dHex1HexNAc5 m/z: 1688. Middle: Graphical representation of glycan structure. Right: Spatial distribution of Hex3dHex1HexNAc5 in each biological replicate of WT, 5xFAD, and rTg4510 (Tau) mouse brains. (B) Left: The relative abundance of Hex8HexNAc2 m/z: 1743. Middle: Graphical representation of glycan structure. Right: Spatial distribution of Hex8HexNAc2 in each biological replicate of WT, 5xFAD, and Tau mouse brains. (C) Left: The relative abundance of Hex4dHex1HexNAc5 m/z: 1850. Middle: Graphical representation of glycan structure. Right: Spatial distribution of Hex4dHex1HexNAc5 in each biological replicate of WT, 5xFAD, and Tau mouse brains. (D) Left: The relative abundance of Hex3HexNAc4 m/z: 1339. Middle: Graphical representation of glycan structure. Right: Spatial distribution of Hex3HexNAc4 in each biological replicate of WT, 5xFAD, and Tau mouse brains. Blue square: N-acetylglucosamine, green circle: mannose, yellow circle: galactose, and red triangle: fucose. Heatmap gradient and scale bar are displayed below images. Data shown represent the mean ± the standard error of the mean (SEM) of n = 3 per mouse model. ****P < .0001; *** .0001 < P < .001; one-way ANOVA
FIGURE 4
FIGURE 4
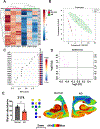
Human Alzheimer’s disease (AD) frontal cortex tissue samples are hyperglycosylated in the gray matter. (A) Two-dimensional clustering heatmap analysis of N-linked glycans between normal and AD frontal cortical sections. Top 15 most changed (by ANOVA) N-linked glycans are shown. Three technical replicates extracted from regions of interest (ROI) in the gray matter regions were collected and averaged and represented as each biological replicate. (B) Partial least-squares discriminant analysis (PLS-DA) of N-linked glycans between normal (red) and AD (green) frontal cortical sections; 95% confidence interval for each group are shown as shaded areas using the same color as respective groups. (C) Variable importance in projection (VIP) analysis showing top 15 N-linked glycans contribute to PLS-DA clustering in (B). (D) Volcano plot showing fold change between AD/WT. N-linked glycans shown with either 1.5-fold increase or decrease with p-value (log10) >0.1 are highlighted in pink. (E) Left: The relative abundance of Hex5dHex1HexNAc4 m/z: 1809. Middle: Graphical representation of glycan structure. Right: Spatial distribution of Hex5dHex1HexNAc4 in a pair of representative brain sections from normal and AD frontal cortices. Blue square: N-acetylglucosamine, green circle: mannose, yellow circle: galactose, and red triangle: fucose. Heatmap gradient and scale bar are displayed below images. Data shown represents the mean ± the SEM of n = 3 per group. * P < .05; unpaired, two-tailed t test
FIGURE 5
FIGURE 5
Human Alzheimer’s disease (AD) hippocampal tissue showing heterogeneous hypoglycosylation. (A) Two-dimensional clustering heatmap analysis of N-linked glycans between normal and AD hippocampal regions. Top 25 most changed (by ANOVA) N-linked glycans are shown. Three technical replicates extracted from regions of interest (ROIs) in the hippocampus were collected, averaged, and represented as each biological replicate. (B) Partial least-squares discriminant analysis (PLS-DA) of N-linked glycans between normal (red) and AD (green) hippocampi; 95% confidence interval for each group are shown as shaded areas using the same color as respective groups. (C) Variable importance in projection (VIP) analysis showing the top 15 N-linked glycans contribute to PLS-DA clustering in (B). (D) Volcano plot showing fold change between AD/WT. N-linked glycans shown with either 1.0-fold increase or decrease with p-value (log10) >0.1 are highlighted in pink. (E) Left: The relative abundance of Hex6dHex1HexNAc5 m/z: 2174. Middle: Graphical representation of glycan structure. Right: Spatial distribution of Hex6dHex1HexNAc5 in a pair of representative brain sections from normal and AD hippocampi. Blue square: N-acetylglucosamine, green circle: mannose, yellow circle: galactose, and red triangle: fucose. Heatmap gradient and scale bar are displayed below images. Data shown represent the mean ± the SEM of n = 3 per group. * P < .05; unpaired, two-tailed t test
FIGURE 6
FIGURE 6
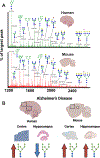
Mouse models of Alzheimer’s disease (AD) and AD human brain regions do not share the same glycosylation trends. (A) Total ion current of the entire human frontal cortex section (top) or whole mouse brain (bottom) represent the total number of N-glycans collected. The m/z values are represented as % of the largest peak within each spectrum (m/z: 1257, rounded to the nearest 1). Blue square: N-acetylglucosamine, green circle: mannose, yellow circle: galactose, red triangle: fucose, and purple diamond: sialic acid. (B) Graphical representation of the similarities and differences in N-linked glycan changes of AD between mouse and human frontal cortices and hippocampi

References

    1. Brookmeyer R, Gray S, Kawas C. Projections of Alzheimer’s disease in the United States and the public health impact of delaying disease onset. Am J Public Health. 1998;88:1337–1342. - PMC - PubMed
    1. Narayan KM, Boyle JP, Geiss LS, Saaddine JB, Thompson TJ. Impact of recent increase in incidence on future diabetes burden: U.S., 2005–2050. Diabetes Care. 2006;29:2114–2116. - PubMed
    1. Lane CA, Hardy J, Schott JM. Alzheimer’s disease. Eur J Neurol. 2018;25:59–70. - PubMed
    1. Selkoe DJ. The molecular pathology of Alzheimer’s disease. Neuron. 1991;6:487–498. - PubMed
    1. Mosconi L, Pupi A, De Leon MJ. Brain glucose hypometabolism and oxidative stress in preclinical Alzheimer’s disease. Ann N Y Acad Sci. 2008;1147:180. - PMC - PubMed

Publication types

MeSH terms