. 2021 Dec;129(12):127005.
doi: 10.1289/EHP8584. Epub 2021 Dec 15.

Disparities in Air Pollution Exposure in the United States by Race/Ethnicity and Income, 1990-2010

Affiliations

Disparities in Air Pollution Exposure in the United States by Race/Ethnicity and Income, 1990-2010

Jiawen Liu et al. Environ Health Perspect. 2021 Dec.

Abstract

Background: Few studies have investigated air pollution exposure disparities by race/ethnicity and income across criteria air pollutants, locations, or time.

Objective: The objective of this study was to quantify exposure disparities by race/ethnicity and income throughout the contiguous United States for six criteria air pollutants, during the period 1990 to 2010.

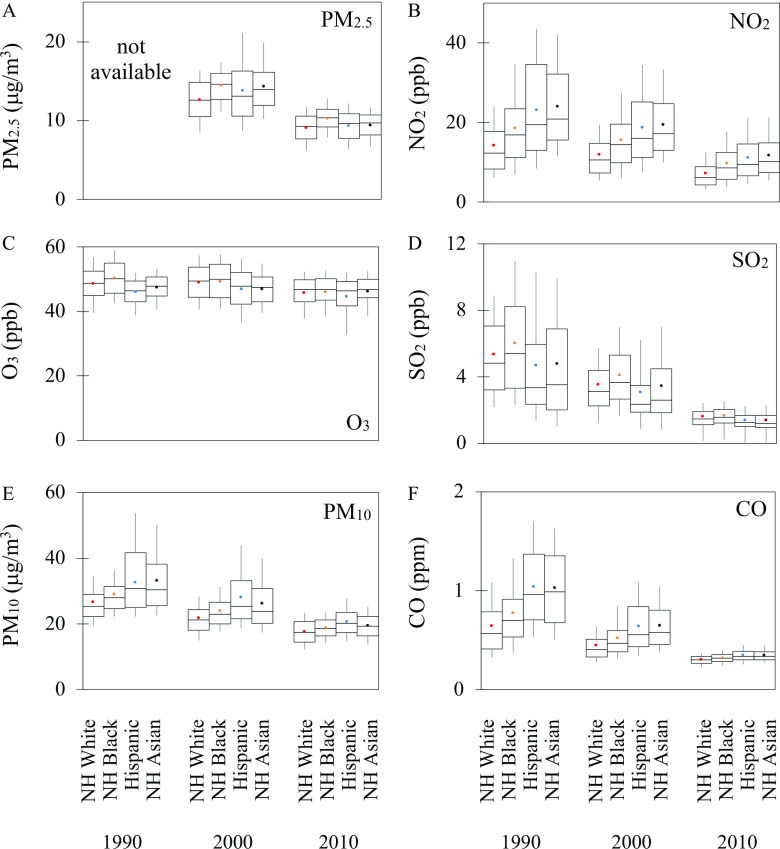
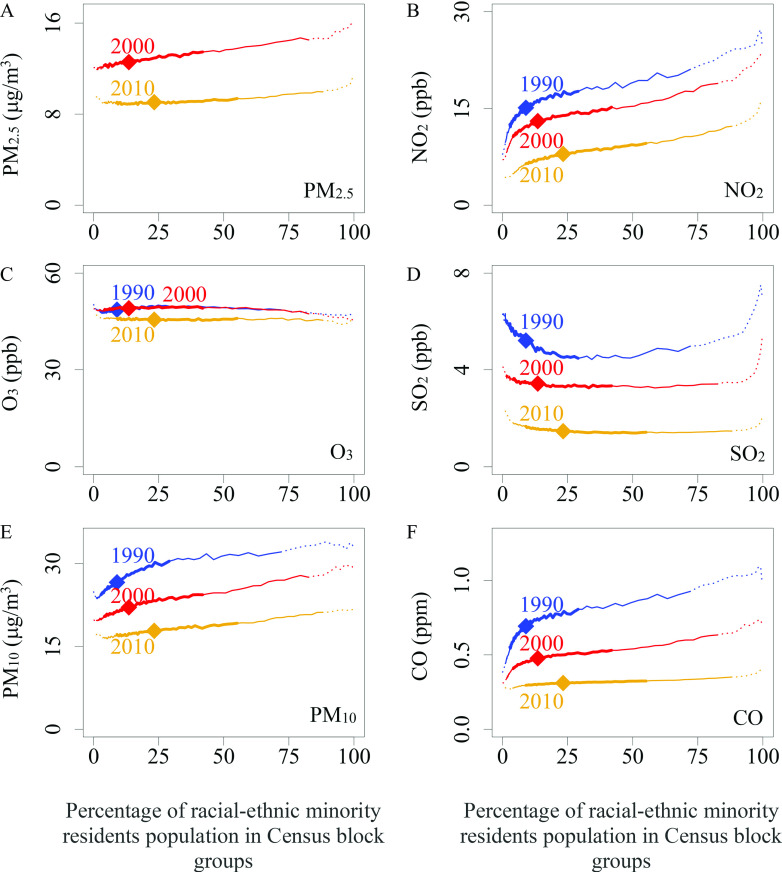
Methods: We quantified exposure disparities among racial/ethnic groups (non-Hispanic White, non-Hispanic Black, Hispanic (any race), non-Hispanic Asian) and by income for multiple spatial units (contiguous United States, states, urban vs. rural areas) and years (1990, 2000, 2010) for carbon monoxide (CO), nitrogen dioxide (NO2), ozone (O3), particulate matter with aerodynamic diameter 2.5μm (PM2.5; excluding year-1990), particulate matter with aerodynamic diameter 10μm (PM10), and sulfur dioxide (SO2). We used census data for demographic information and a national empirical model for ambient air pollution levels.

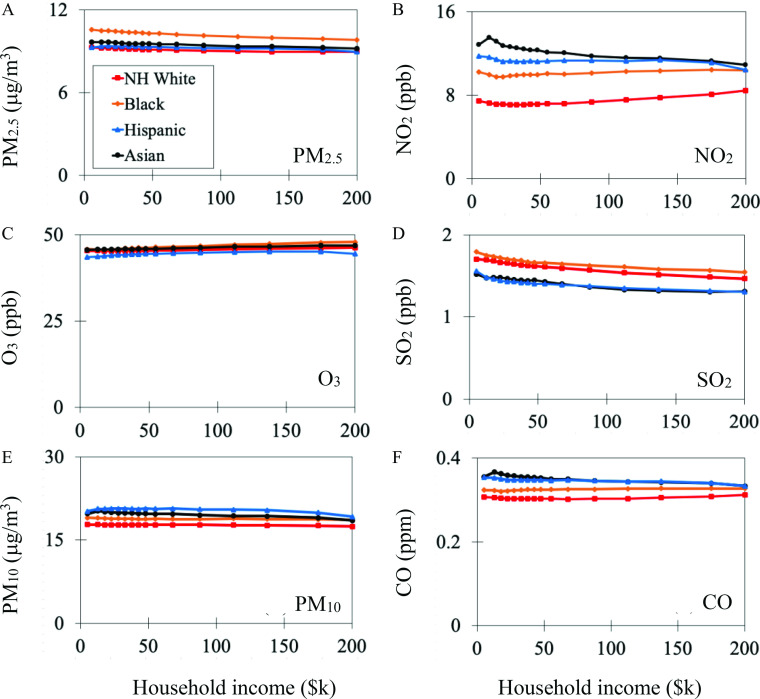
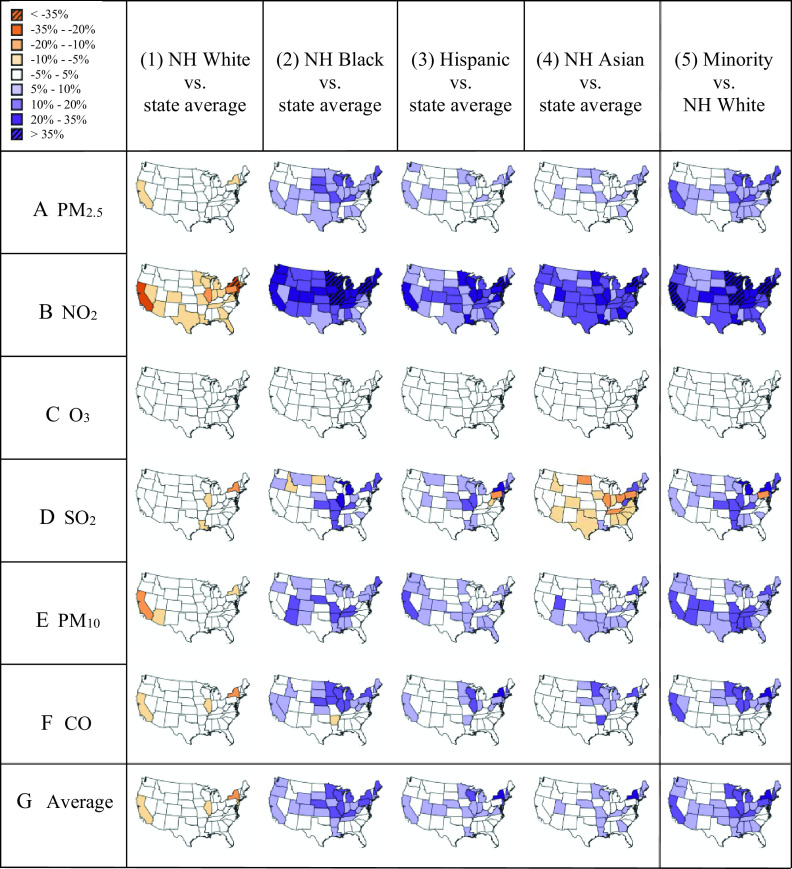
Results: For all years and pollutants, the racial/ethnic group with the highest national average exposure was a racial/ethnic minority group. In 2010, the disparity between the racial/ethnic group with the highest vs. lowest national-average exposure was largest for NO2 [54% (4.6 ppb)], smallest for O3 [3.6% (1.6 ppb)], and intermediate for the remaining pollutants (13%-19%). The disparities varied by U.S. state; for example, for PM2.5 in 2010, exposures were at least 5% higher than average in 63% of states for non-Hispanic Black populations; in 33% and 26% of states for Hispanic and for non-Hispanic Asian populations, respectively; and in no states for non-Hispanic White populations. Absolute exposure disparities were larger among racial/ethnic groups than among income categories (range among pollutants: between 1.1 and 21 times larger). Over the period studied, national absolute racial/ethnic exposure disparities declined by between 35% (0.66μg/m3; PM2.5) and 88% (0.35 ppm; CO); relative disparities declined to between 0.99× (PM2.5; i.e., nearly zero change) and 0.71× (CO; i.e., a 29% reduction).

Discussion: As air pollution concentrations declined during the period 1990 to 2010, absolute (and to a lesser extent, relative) racial/ethnic exposure disparities also declined. However, in 2010, racial/ethnic exposure disparities remained across income levels, in urban and rural areas, and in all states, for multiple pollutants. https://doi.org/10.1289/EHP8584.


Figures

Figures 1A to 1F are error graphs titled particulate matter begin subscript 2.5 end subscript, Nitrogen Dioxide, Ozone, Sulfur Dioxide, particulate matter begin subscript 10 end subscript, and Carbon Monoxide, plotting particulate matter begin subscript 2.5 end subscript (microgram meter cubed), ranging from 0 to 20 in increments of 10; Nitrogen Dioxide (parts per billion), ranging from 0 to 40 in increments of 20; Ozone (parts per billion), ranging from 0 to 60 in increments of 20; Sulfur dioxide (parts per billion), ranging from 0 to 12 in increments of 2; particulate matter begin subscript 10 end subscript (microgram per meter cubed), ranging from 0 to 60 in increments of 20; Carbon Monoxide (parts per million), ranging from 0 to 2 in unit increments (y-axis) across years, ranging from 1990 to 2010 in increments of 10 for Non-Hispanic White, Non-Hispanic Black, Hispanic, and Non-Hispanic Asian (x-axis), respectively.
Figure 1.
Distribution of exposure to pollutants in years 1990, 2000, and 2010, stratified by racial/ethnic group, for (A) PM2.5, (B) NO2, (C) O3, (D) SO2, (E) PM10, and (F) CO. For all panels, the highest/lowest bound represents the 90th/10th percentile value, the box shows the 25th and 75th percentiles, and the horizontal line in the box represents the median. Color circles indicate the national population-weighted mean. PM2.5 has no estimates in 1990 because of a lack of monitoring data prior to 1999. Note: CO, carbon monoxide; Hispanic, Hispanic people of any race(s); NH, non-Hispanic; NO2, nitrogen dioxide; O3, ozone; PM2.5, fine particulate matter with aerodynamic diameter less than or equal to 2.5 micrometers; PM10 10 micrometers; SO2, sulfur dioxide.
Figures 2A to 2F are line graphs titled particulate matter begin subscript 2.5 end subscript, Nitrogen Dioxide, Ozone, Sulfur Dioxide, particulate matter begin subscript 10 end subscript, and Carbon Monoxide, plotting particulate matter begin subscript 2.5 end subscript (microgram meter cubed), ranging from 0 to 16 in increments of 8; Nitrogen Dioxide (parts per billion), ranging from 0 to 30 in increments of 15; Ozone (parts per billion), ranging from 0 to 60 in increments of 30; Sulfur dioxide (parts per billion), ranging from 0 to 8 in increments of 4; particulate matter begin subscript 10 end subscript (microgram per meter cubed), ranging from 0 to 30 in increments of 15; Carbon Monoxide (parts per million), ranging from 0.0 to 1.0 in increments of 0.5 (y-axis) across Racial/ethnic minority residents percentage, ranging from 0 to 100 in increments of 25 (x-axis), respectively.
Figure 2.
Relationship between the proportion of racial/ethnic minority residents in census block groups and average criteria air pollution concentrations in the years 1990, 2000, and 2010 for (A) PM2.5, (B) NO2, (C) O3, (D) SO2, (E) PM10, and (F) CO. For each panel, the thicker portion of the line indicates the 25th to 75th percentile of census block groups, the thin line indicates the 10th to 90th percentiles, the dashed line indicates the 1st to 99th percentiles, and the diamond icon indicates the median. Note: CO, carbon monoxide; Hispanic, Hispanic people of any race(s); NH, non-Hispanic; NO2, nitrogen dioxide; O3, ozone; PM2.5, fine particulate matter with aerodynamic diameter less than or equal to 2.5 micrometers; PM10 10 micrometers; SO2, sulfur dioxide.
Figures 3A to 3F are line graphs titled particulate matter begin subscript 2.5 end subscript, Nitrogen Dioxide, Ozone, Sulfur Dioxide, particulate matter begin subscript 10 end subscript, and Carbon Monoxide, plotting particulate matter begin subscript 2.5 end subscript (microgram meter cubed), ranging from 0 to 12 in increments of 6; Nitrogen Dioxide (parts per billion), ranging from 0 to 16 in increments of 8; Ozone (parts per billion), ranging from 0 to 50 in increments of 25; Sulfur dioxide (parts per billion), ranging from 0 to 2 in unit increments; particulate matter begin subscript 10 end subscript (microgram per meter cubed), ranging from 0 to 30 in increments of 15; Carbon Monoxide (parts per million), ranging from 0.0 to 0.4 in increments of 0.2 (y-axis) across Household income (dollar thousand), ranging from 0 to 200 in increments of 50 (x-axis), respectively.
Figure 3.
Population-weighted criteria air pollution concentration in 2010 for 16 household income groups, stratified by race/ethnicity, for (A) PM2.5, (B) NO2, (C) O3, (D) SO2, (E) PM10, and (F) CO. For all panels, each data point represents pollution exposure for one income category and racial/ethnic group. Values plotted for household income are, for values below $200,000 (i.e., for the first 15 income categories), the midpoint value; for the highest income category (“>$200,000”), the value plotted is the low end of the range ($200,000). Note: Asian, Hispanic and non-Hispanic Asian people; Black, Hispanic and non-Hispanic Black people; CO, carbon monoxide; Hispanic, Hispanic people of any race(s); NH White, non-Hispanic White people; NO2, nitrogen dioxide; O3, ozone; PM2.5, fine particulate matter with aerodynamic diameter less than or equal to 2.5 micrometers; PM10 10 micrometers; SO2, sulfur dioxide.
Figure 4 is a tabular representation of maps that has seven rows and six columns. The six columns list map legend binned into ranges, including less than negative 35 percent, negative 35 percent to negative 20 percent, negative 20 percent to negative 10 percent, negative 10 percent to negative 5 percent, negative 5 percent to 5 percent, 10 percent to 20 percent, 20 percent to 35 percent, and greater than 35 percent; non-Hispanic White versus state average; non-Hispanic Black versus state average; Hispanic versus state average; non-Hispanic Asian versus state average; and Minority versus non-Hispanic White. The seven columns include particulate matter begin subscript 2.5 end subscript, Nitrogen Dioxide, Ozone, Sulfur Dioxide, particulate matter begin subscript 10 end subscript, Carbon Monoxide, and Average. Each row displays five maps of the contiguous United States.
Figure 4.
State racial/ethnic disparities in pollution exposure in 2010, showing the difference between (1) NH White vs. state average, (2) NH Black vs. state average, (3) Hispanic vs. state average, (4) NH Asian vs. state average, and (5) Minority vs. NH White for the six pollutants. (A) PM2.5, (B) NO2, (C) O3, (D) SO2, (E) PM10, and (F) CO, and (G) average across the six pollutants. Columns 1–4: exposure disparity relative to state average; calculated as mean exposure for a racial/ethnic group in that state minus the overall mean for that state, then divided by the national overall mean. Column 5: exposure disparity for racial/ethnic minorities relative to the racial/ethnic majority group; calculated as mean exposure for racial/ethnic minorities minus mean exposure for non-Hispanic White people, then divided by the national overall mean. Mean values are population-weighted. States displayed in white indicate that the disparity is within ±5% of the national overall mean. Purple shading indicates that mean exposures are higher than average by more than 5% of the national overall mean (columns 1–4) or that mean exposures are higher for racial/ethnic minorities than for non-Hispanic White people, by more than 5% of the national overall mean (column 5). Orange shading indicates the reverse: mean exposures are lower than average for that group (columns 1–4) or mean exposures are lower for racial/ethnic minorities than for non-Hispanic White people (column 5), and the disparity is greater than 5% of the national overall mean. See Excel Table S1 for corresponding numeric data. Note: CO, carbon monoxide; Hispanic, Hispanic people of any race(s); NH, non-Hispanic; NO2, nitrogen dioxide; O3, ozone; PM2.5, fine particulate matter with aerodynamic diameter less than or equal to 2.5 micrometers; PM10 10 micrometers; SO2, sulfur dioxide.

Comment in

References

    1. Abel TD, Salazar DJ, Robert P. 2015. States of environmental justice: redistributive politics across the United States, 1993–2004. Rev Policy Res 32(2):200–225, 10.1111/ropr.12119. - DOI
    1. Ard K. 2015. Trends in exposure to industrial air toxins for different racial and socioeconomic groups: a spatial and temporal examination of environmental inequality in the U.S. from 1995 to 2004. Soc Sci Res 53:375–390, PMID: , 10.1016/j.ssresearch.2015.06.019. - DOI - PubMed
    1. Bechle MJ, Millet DB, Marshall JD. 2015. National spatiotemporal exposure surface for NO2: monthly scaling of a satellite-derived land-use regression, 2000–2010. Environ Sci Technol 49(20):12297–12305, PMID: , 10.1021/acs.est.5b02882. - DOI - PubMed
    1. Bowe B, Xie Y, Yan Y, Al-Aly Z. 2019. Burden of cause-specific mortality associated with PM2.5 air pollution in the United States. JAMA Netw Open 2(11):e1915834, PMID: , 10.1001/jamanetworkopen.2019.15834. - DOI - PMC - PubMed
    1. Brulle RJ, Pellow DN. 2006. Environmental justice: human health and environmental inequalities. Annu Rev Public Health 27(1):103–124, PMID: , 10.1146/annurev.publhealth.27.021405.102124. - DOI - PubMed

Publication types