. 2021 Nov 20;11(22):e4221.
doi: 10.21769/BioProtoc.4221.

Macroscopic Structural and Connectome Mapping of the Mouse Brain Using Diffusion Magnetic Resonance Imaging

Affiliations

Macroscopic Structural and Connectome Mapping of the Mouse Brain Using Diffusion Magnetic Resonance Imaging

Tanzil Mahmud Arefin et al. Bio Protoc. .

Abstract

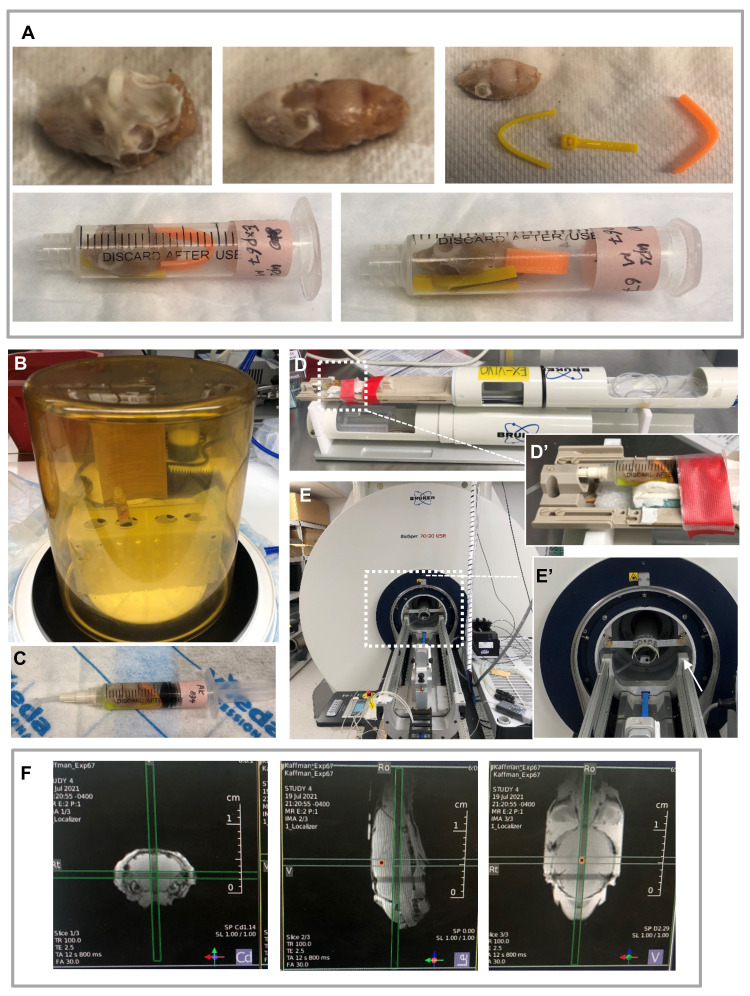
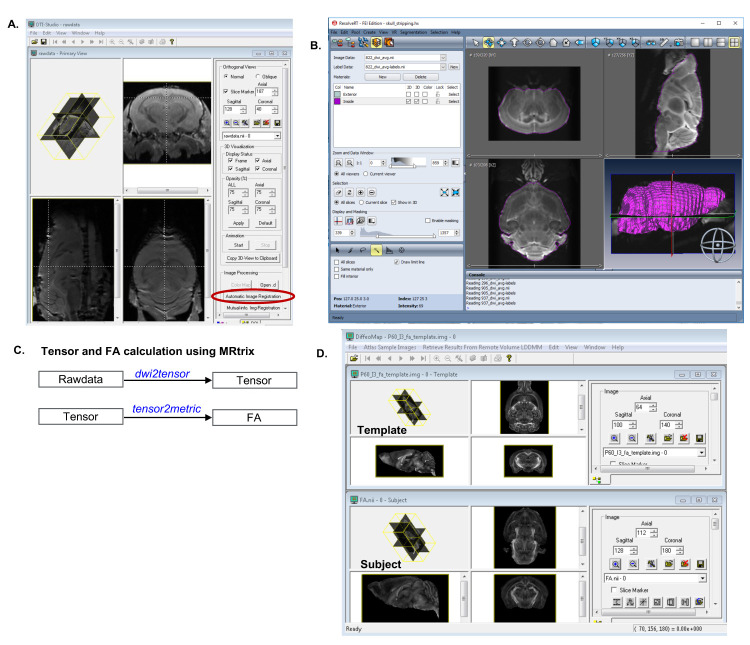
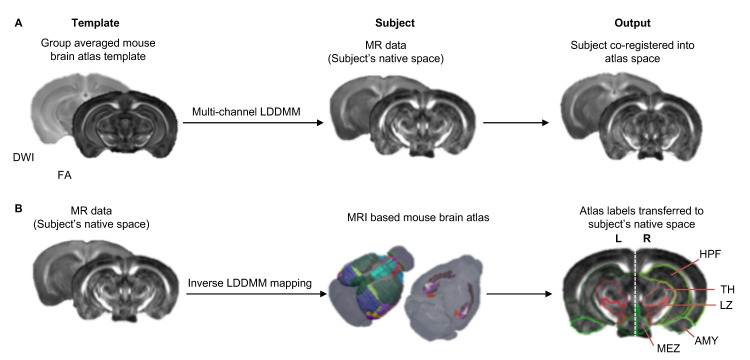
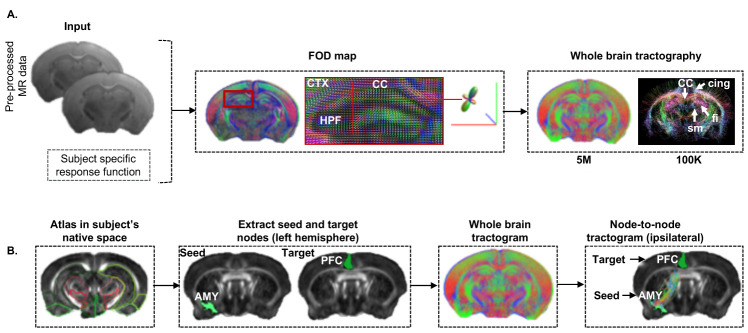
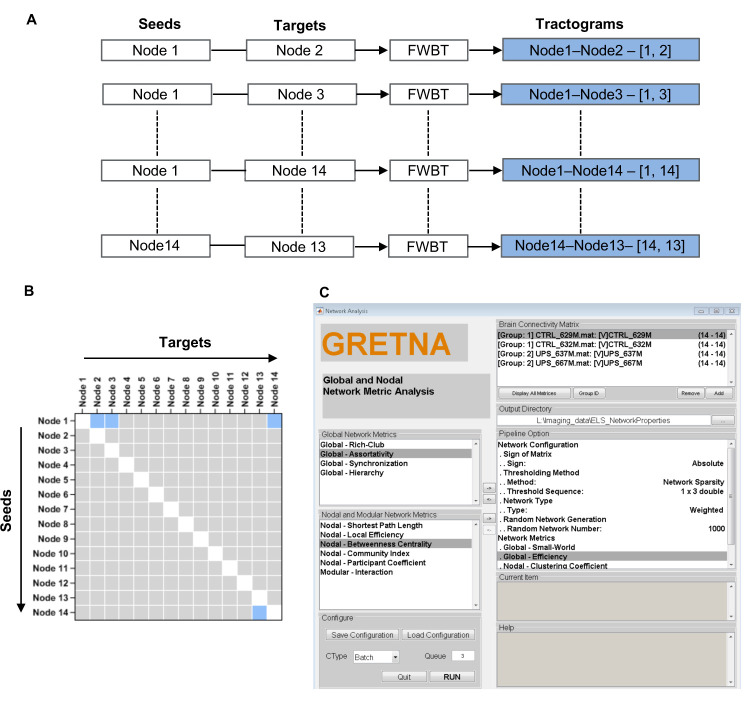
Translational work in rodents elucidates basic mechanisms that drive complex behaviors relevant to psychiatric and neurological conditions. Nonetheless, numerous promising studies in rodents later fail in clinical trials, highlighting the need for improving the translational utility of preclinical studies in rodents. Imaging of small rodents provides an important strategy to address this challenge, as it enables a whole-brain unbiased search for structural and dynamic changes that can be directly compared to human imaging. The functional significance of structural changes identified using imaging can then be further investigated using molecular and genetic tools available for the mouse. Here, we describe a pipeline for unbiased search and characterization of structural changes and network properties, based on diffusion MRI data covering the entire mouse brain at an isotropic resolution of 100 µm. We first used unbiased whole-brain voxel-based analyses to identify volumetric and microstructural alterations in the brain of adult mice exposed to unpredictable postnatal stress (UPS), which is a mouse model of complex early life stress (ELS). Brain regions showing structural abnormalities were used as nodes to generate a grid for assessing structural connectivity and network properties based on graph theory. The technique described here can be broadly applied to understand brain connectivity in other mouse models of human disorders, as well as in genetically modified mouse strains. Graphic abstract: Pipeline for characterizing structural connectome in the mouse brain using diffusion magnetic resonance imaging. Scale bar = 1 mm.

Keywords: Brain network properties; Diffusion MRI; Fiber tractography; Mouse brain.; Structural connectivity.


Conflict of interest statement

Competing interestsThe authors declare no conflict of interest.

Figures

Figure 1.
Figure 1.. Preparation for MRI.
A. Sample preparation: Remove the tissues outside of the skull carefully without damaging the eyeballs (top panel). Place the brain in a 5ml syringe with small pieces of zip-ties to fix its position (bottom panel). B-C. Remove air from the syringe: Connect the syringe to a loosely tied vacutainer filled with Fomblin® (shown in C) and place in the vacuum chamber (shown in B). Remove the vacutainer and turn on the vacuum for 30 min to remove air bubbles. Push out the remaining air after vacuum and seal the top by tightening the vacutainer. D. Place the sample in a manufacturer-made sample holder designed for the cryogenic probe. D’. A zoom-in view of the sample. E. Insert the sample holder into the magnet bore of the magnet. E’. A zoom-in view of the holder (indicated by the white arrow). F. Three orthogonal plane images acquired using the Localizer protocol on a 7 Tesla Bruker preclinical MRI system.
Figure 2.
Figure 2.. Illustration of the data pre-processing steps.
A. Motion correction using DTIStudio. Run Automatic Image Registration (circled) to align all diffusion weighted images (DWIs) to the non-diffusion-weighted image (b0). B. Use the AMIRA segmentation editor to generate a binary mask (purple) for the brain. C. Schematic diagram of the steps to compute the tensor and FA from the rawdata using Mrtrix. D. Use DiffeoMap for image registration and transformation of atlas labels into subject’s native image space.
Figure 3.
Figure 3.. Image registration pipeline.
A. Co-registration of the MR data (subject) into group averaged mouse brain atlas template using multi-channel LDDMM. B. Transformation of structural labels from MRI-based atlas to subject’s native space.
Figure 4.
Figure 4.. Fiber tractography pipeline.
A. Estimation of mouse whole brain fiber tractogram from the fiber orientation distribution (FOD) map. Red, green, and blue colors represent the fiber projections in x, y, and z-axis, respectively. Five million fibers were generated from each subject; 100 K streamlines were extracted for better visualization of the brain structures. B. Extraction of fibers connecting two specific nodes (seed = amygdala and target = PFC).
Figure 5.
Figure 5.. Generation of the mouse brain structural connectome.
A. Extraction of fibers connecting seed and target nodes. B. Generation of structural connectome from the tractograms estimated from selected seed and target nodes. Blue cells correspond to the tractograms shown in A, and white cells indicate intra-regional connectivity (not counted). C. Use the GRETNA software to compute global and regional brain network properties. Panels on the left list all possible properties available for computation. Select the properties based on the study design and transfer them to the pipeline option on the right panel using the respective arrows. Load the connectome matrix for all subjects belonging to one group with specific group ID and then load for the next group with different ID. Specify the output folder to store the results and define the network configuration. Finally, hit the ‘Run’ button to start computation.

References

    1. Aggarwal M., Mori S., Shimogori T., Blackshaw S. and Zhang J.(2010). Three-dimensional diffusion tensor microimaging for anatomical characterization of the mouse brain. Magn Reson Med 64(1): 249-261. - PMC - PubMed
    1. Dorr A. E., Lerch J. P., Spring S., Kabani N. and Henkelman R. M.(2008). High resolution three-dimensional brain atlas using an average magnetic resonance image of 40 adult C57Bl/6J mice. Neuroimage 42(1):60-9. - PubMed
    1. Badea A., Ng K. L., Anderson R. J., Zhang J., Miller M. I. and O'Brien R. J.(2019). Magnetic resonance imaging of mouse brain networks plasticity following motor learning. PLoS One 14(5): e0216596. - PMC - PubMed
    1. Basser P. J., Mattiello J. and LeBihan D.(1994). MR diffusion tensor spectroscopy and imaging. Biophys J 66(1): 259-267. - PMC - PubMed
    1. Calabrese E., Badea A., Cofer G., Qi Y. and Johnson G. A.(2015). A Diffusion MRI Tractography Connectome of the Mouse Brain and Comparison with Neuronal Tracer Data. Cereb Cortex 25(11): 4628-4637. - PMC - PubMed

LinkOut - more resources