Review
. 2021 Jun 25;1(3):100039.
doi: 10.1016/j.xjidi.2021.100039. eCollection 2021 Sep.

Seeing through the Skin: Photoacoustic Tomography of Skin Vasculature and Beyond

Affiliations
Review

Seeing through the Skin: Photoacoustic Tomography of Skin Vasculature and Beyond

Daiwei Li et al. JID Innov. .

Abstract

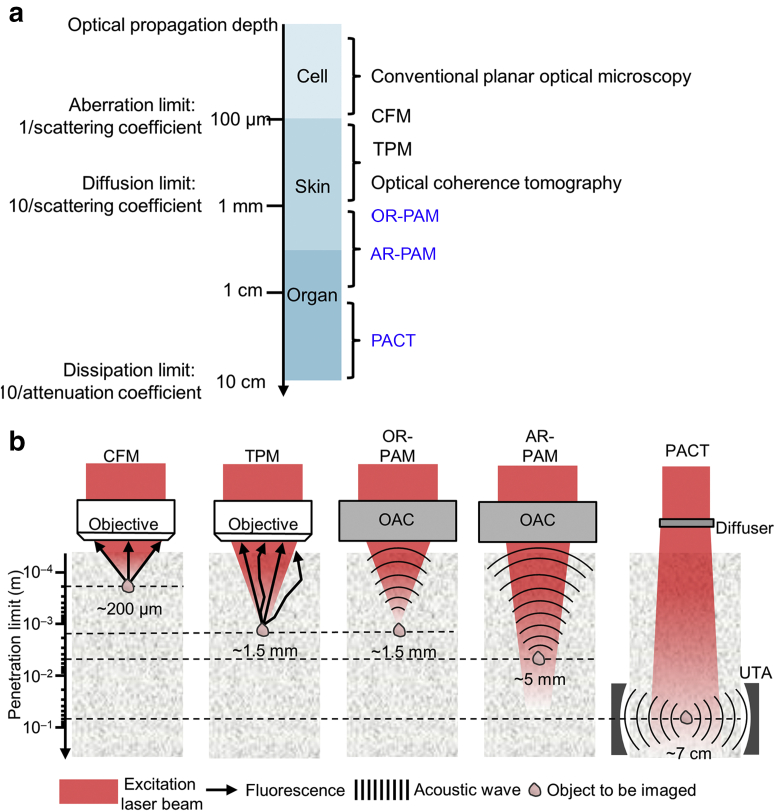
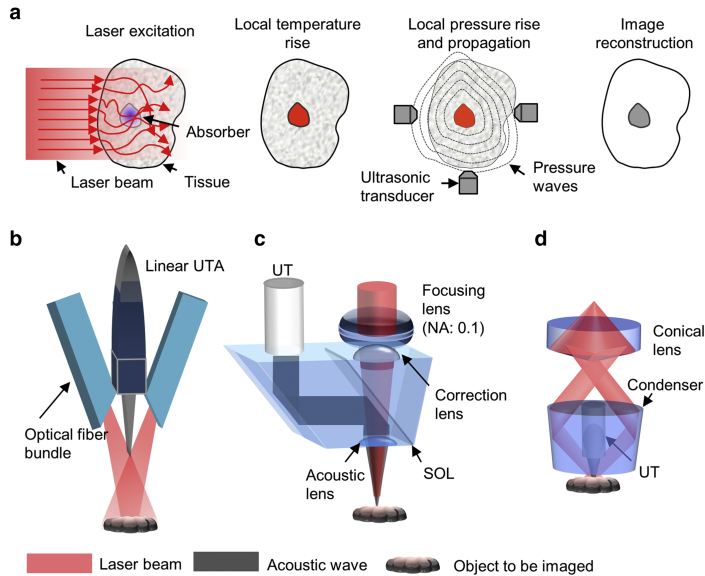
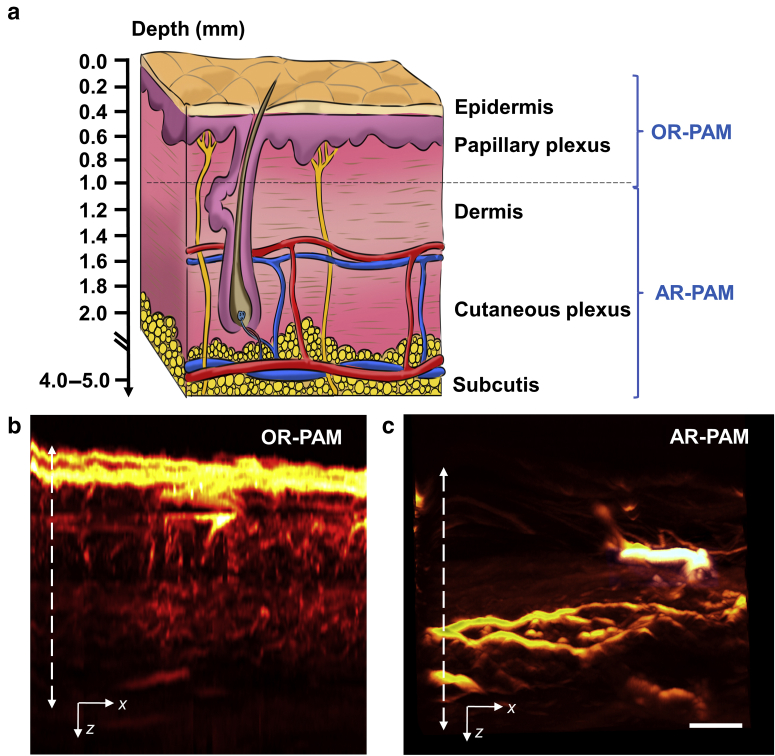
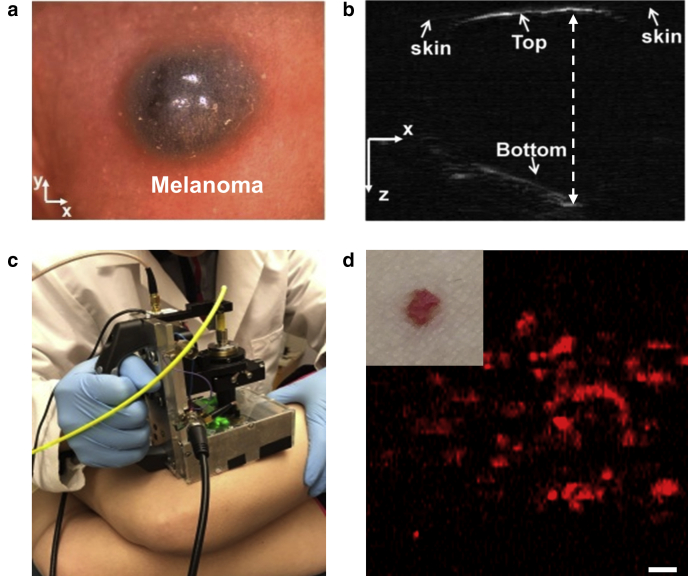
Skin diseases are the most common human diseases and manifest in distinct structural and functional changes to skin tissue components such as basal cells, vasculature, and pigmentation. Although biopsy is the standard practice for skin disease diagnosis, it is not sufficient to provide in vivo status of the skin and highly depends on the timing of diagnosis. Noninvasive imaging technologies that can provide structural and functional tissue information in real time would be invaluable for skin disease diagnosis and treatment evaluation. Among the modern medical imaging technologies, photoacoustic (PA) tomography (PAT) shows great promise as an emerging optical imaging modality with high spatial resolution, high imaging speed, deep penetration depth, rich contrast, and inherent sensitivity to functional and molecular information. Over the last decade, PAT has undergone an explosion in technical development and biomedical applications. Particularly, PAT has attracted increasing attention in skin disease diagnosis, providing structural, functional, metabolic, molecular, and histological information. In this concise review, we introduce the principles and imaging capability of various PA skin imaging technologies. We highlight the representative applications in the past decade with a focus on imaging skin vasculature and melanoma. We also envision the critical technical developments necessary to further accelerate the translation of PAT technologies to fundamental skin research and clinical impacts.

Keywords: ACD, allergy contact dermatitis; AR-PAM, acoustic-resolution photoacoustic microscopy; CSC, cryogen spray cooling; CSVV, cutaneous small-vessel vasculitis; CTC, circulating tumor cell; FDA, Food and Drug Administration; NIR, near-infrared; OR-PAM, optical-resolution photoacoustic microscopy; PA, photoacoustic; PACT, photoacoustic computed tomography; PAM, photoacoustic microscopy; PAT, photoacoustic tomography; PWS, port-wine stain; RSOM, raster-scan optoacoustic mesoscopy; THb, total hemoglobin concentration; sO2, oxygen saturation of hemoglobin.


Figures

Figure 1
Figure 1
Photon propagation regimes in soft tissue and the penetration limits of representative high-resolution optical imaging modalities. (a) Photon propagation regimes in soft tissue and association with the penetration limits of high-resolution optical imaging modalities (Yao et al., 2016). The four regimes are divided at photon propagation depths of approximately 0.1 mm (aberration limit), 1 mm (diffusion limit), 10 cm (dissipation limit), and 1 m (absorption limit), with an optical absorption coefficient of 0.1 cm–1, optical scattering coefficient of 100 cm–1, and anisotropy of 0.9. The classification holds in optical scattering dominant media. Note that the penetration limits shown in this image are order-of-magnitude approximations. (b) Signal generation and detection in CFM, TPM, and PAT, with different penetration limits in scattering tissue. Note that the penetration limits shown in the figure are drawn on a logarithmic scale. The colors of the excitation light do not represent the true optical wavelengths. Reprinted with permission from Wang and Yao (2016). AR-PAM, acoustic-resolution photoacoustic microscopy; CFM, confocal microscopy; OAC, optical‒acoustic combiner; OR-PAM, optical-resolution photoacoustic microscopy; PACT, photoacoustic computed tomography; PAT, photoacoustic tomography; TPM, two-photon microscopy; UTA, ultrasound transducer array.
Figure 2
Figure 2
Principles of PAT and major implementations. (a) Imaging principle of PAT. When a short laser pulse is fired at the biological tissue, some photons are absorbed by biomolecules, and their energy is converted into heat through the nonradiative relaxation of excited molecules. The local temperature rise induces a local pressure rise, which propagates as an acoustic wave through the tissue and reaches an UT or UTA. The received signals are used to form an image that maps the original optical energy deposition inside the tissue. (b) PACT system with a linear UTA (Erpelding et al., 2010), which has been most commonly adapted for clinical studies (Choi et al., 2018). The excitation light is delivered through a fused-end, bifurcated fiber bundle that flanks both sides of the UTA. (c) Reflection-mode OR-PAM system with an optical‒acoustic combiner that transmits light but reflects sound (Yao et al., 2011). SOL sandwiched between two prisms. OR-PAM is mostly used for preclinical studies. (d) AR-PAM system with a dark-field illumination (Zhang et al., 2006b). The laser light is only weakly focused, with the UT in the dark cone. AR-PAM has also been used for the clinical study of skin vasculature disease (Aguirre et al., 2017). Reprinted with permission from Wang and Yao (2016). AR-PAM, acoustic-resolution photoacoustic microscopy; NA, numerical aperture; OR-PAM, optical-resolution photoacoustic microscopy; PACT, photoacoustic computed tomography; PAT, photoacoustic tomography; SOL, silicone oil layer; UT, ultrasound transducer; UTA, ultrasound transducer array.
Figure 3
Figure 3
Illustration of the penetration depths of OR-PAM and AR-PAM in the skin. (a) Schematic of the skin layers and the corresponding penetration depths of OR-PAM and AR-PAM. (b) Representative OR-PAM image of the mouse skin vasculature, showing a 1-mm penetration depth. (c) Representative AR-PAM of an ex vivo pig skin sample with blood preserved, showing a 5-mm pentation depth. Bar = 1 mm. AR-PAM, acoustic-resolution photoacoustic microscopy; OR-PAM, optical-resolution photoacoustic microscopy.
Figure 4
Figure 4
Representative PA imaging of skin vasculature using endogenous contrast. (a) PA microvasculature imaging of a mouse ear bearing an implanted B16 melanoma tumor. Depth is coded by colors: blue (superficial) to red (deep). Bar = 1 mm. (b) Close-up PA image of the B16 melanoma tumor identified in the white box of a using spectroscopic measurements. (c) PA sO2 imaging of the principal arterial‒vein pair. Bar = 200 μm. (d) PA flow velocity imaging of the principal arterial‒vein pair. PA, photoacoustic; sO2, oxygen saturation of hemoglobin.
Figure 5
Figure 5
PAT of melanoma and pigmented lesion. (a) Photograph of the melanoma in a nude mouse in vivo. Bar = 1 mm. (b) Handheld PAM of melanoma clearly shows both the top and bottom boundaries. The dashed line indicates 3.6 mm. Bar = 1 mm. (c) Photograph of handheld PAM imaging a red mole on a volunteer’s leg. (d) A handheld PAM image of the mole reveals an irregular blood vessel pattern. The inset shows the photograph of the mole. Bar = 1 mm. Reprinted with permission from Lin et al. (2017) and Zhou et al. (2015). PAM, photoacoustic microscopy; PAT, photoacoustic tomography.
Figure 6
Figure 6
AR-PAM of healthy skin versus that of adjacent psoriatic skin and validation by histology. (a) Cross-sectional AR-PAM image of psoriatic skin showing the top part of elongated capillary loops (cyan arrow) that almost climbed to the skin surface through elongated rete ridges. Bar = 200 μm. (b) Cross-sectional AR-PAM image of adjacent healthy skin showing a layered EP structure with clearly resolved vessels in the DR. Bar = 200 μm. (c) Histology image (left) of the psoriatic skin and the corresponding AR-PAM cross-sectional image (right). The histology image shows the acanthosis, the elongated capillary loops through the rete ridge, and the increased vascularization of the DR. Bar = 300 μm. (d) Histology image (left) of healthy skin and the corresponding AR-PAM cross-sectional image (right). Bar = 300 μm. Reprinted with permission from Aguirre et al. (2017). AR-PAM, acoustic-resolution photoacoustic microscopy; DR, dermis; EP, epidermal.
Figure 7
Figure 7
PAT of burn injury. (a) Photograph and (b) AR-PAM image of an acute skin burn induced by 175 °C heat exposure for 20 seconds, showing the characteristic hyperemic ring. Bar = 1mm. Reprinted with permission from Zhang et al. (2006c). AR-PAM, acoustic-resolution photoacoustic microscopy; PAT, photoacoustic tomography.
Figure 8
Figure 8
PAT of melanoma CTC in vivo. Three fused OR-PAM images spanning ∼3 s show a single melanoma CTC traveling in the artery and then returning in the vein. The yellow boxes indicate the single CTC acquired by OR-PAM at 1,064 nm. Bar = 200 μm. Reprinted with permission from He et al. (2016). CTC, circulating tumor cell; Norm., normal; OR-PAM, optical-resolution photoacoustic microscopy; PA, photoacoustic; PAT, photoacoustic tomography; s, second.

Similar articles

Cited by

References

    1. Aguirre J., Schwarz M., Garzorz N., Omar M., Buehler A., Eyerich K., et al. Precision assessment of label-free psoriasis biomarkers with ultra-broadband optoacoustic mesoscopy. Nat Biomed Eng. 2017;1:1–8.
    1. Aizawa K., Sato S., Saitoh D., Ashida H., Obara M. Photoacoustic monitoring of burn healing process in rats. J Biomed Opt. 2008;13:064020. - PubMed
    1. Argenziano G., Zalaudek I., Corona R., Sera F., Cicale L., Petrillo G., et al. Vascular structures in skin tumors: a dermoscopy study. Arch Dermatol. 2004;140:1485–1489. - PubMed
    1. Arrasmith C.L., Dickensheets D.L., Mahadevan-Jansen A. MEMS-based handheld confocal microscope for in-vivo skin imaging. Opt Express. 2010;18:3805–3819. - PMC - PubMed
    1. Attia A.B.E., Balasundaram G., Moothanchery M., Dinish U.S., Bi R., Ntziachristos V., et al. A review of clinical photoacoustic imaging: current and future trends. Photoacoustics. 2019;16:100144. - PMC - PubMed