. 2021 Nov 23;2(1):512-525.
doi: 10.1089/neur.2021.0021. eCollection 2021.

Transcriptional Pathology Evolves over Time in Rat Hippocampus after Lateral Fluid Percussion Traumatic Brain Injury

Affiliations

Transcriptional Pathology Evolves over Time in Rat Hippocampus after Lateral Fluid Percussion Traumatic Brain Injury

Rinaldo Catta-Preta et al. Neurotrauma Rep. .

Abstract

Traumatic brain injury (TBI) causes acute and lasting impacts on the brain, driving pathology along anatomical, cellular, and behavioral dimensions. Rodent models offer an opportunity to study the temporal progression of disease from injury to recovery. Transcriptomic and epigenomic analysis were applied to evaluate gene expression in ipsilateral hippocampus at 1 and 14 days after sham (n = 2 and 4, respectively per time point) and moderate lateral fluid percussion injury (n = 4 per time point). This enabled the identification of dynamic changes and differential gene expression (differentially expressed genes; DEGs) modules linked to underlying epigenetic response. We observed acute signatures associated with cell death, astrocytosis, and neurotransmission that largely recovered by 2 weeks. Inflammation and immune signatures segregated into upregulated modules with distinct expression trajectories and functions. Whereas most down-regulated genes recovered by 14 days, two modules with delayed and persistent changes were associated with cholesterol metabolism, amyloid beta clearance, and neurodegeneration. Differential expression was paralleled by changes in histone H3 lysine residue 4 trimethylation at the promoters of DEGs at 1 day post-TBI, with the strongest changes observed for inflammation and immune response genes. These results demonstrate how integrated genomics analysis in the pre-clinical setting has the potential to identify stage-specific biomarkers for injury and/or recovery. Though limited in scope here, our general strategy has the potential to capture pathological signatures over time and evaluate treatment efficacy at the systems level.

Keywords: TBI; differential expression; longitudinal; neurodegeneration; rat.


Conflict of interest statement

No competing financial interests exist.

Figures

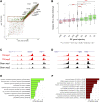
FIG. 1.
FIG. 1.
Differential expression of genes subjected to TBI. (A) Summary of experimental design. (B) Clustered heatmap of reads from upregulated (upper panel, n = 6870) and downregulated genes (lower panel, n = 10,302) at both time points (1 and 14 days after TBI) for genes with unadjusted p value <0.05. (C) Volcano plots of the differentially expressed genes at each of the time points. Each dot represents a gene; those colored in red were downregulated, whereas the ones in green were upregulated, TBI versus sham control (significance level is 99%, α = 0.05). Differential gene expression presented in log10 scale, with example genes labeled. (D) Principal component analysis plot showing the first two components. Ellipses represent cluster confidence intervals at the 95% confidence level (when there were only two data points, an ellipse was manually drawn to enclose both points). mRNA, messenger RNA; TBI, traumatic brain injury.
FIG. 2.
FIG. 2.
Gene expression trajectories over time after TBI. (A) Sankey plot showing the relative gene expression trajectory across the period 1–14 days after TBI (limma-voom model with p < = 0.05, expression normalized/corrected for batch effect and sham effect over time). Gene trajectory modules are labeled as follows: (i) denotes persistently upregulated genes; (ii) means acutely upregulated genes showing partial recovery at day 14; (iii) denotes genes with delayed upregulation; (iv) and (v) denote acutely up- and downregulated genes, respectively, showing full recovery at day 14; (vi) represents genes with delayed downregulation; (vii) depicts acutely downregulated genes showing partial recovery; and (viii) denotes persistently downregulated genes. (B) Expression level comparisons at both time points, TBI and sham control, for selected genes (Csf1r, Fos, Grik4, and Hmgcr) showing different trajectories. Gene expression is given in log RPKM (reads per kilobase of transcript, per million mapped reads). Csf1r, colony-stimulating factor 1 receptor; Fos, Fos proto-oncogene, AP-1 transcription factor subunit; Grik4, glutamate ionotropic receptor kainate type subunit 4; Hmgcr, 3-hydroxy-3-methylglutaryl-CoA reductase; TBI, traumatic brain injury.
FIG. 3.
FIG. 3.
Gene Ontology (GO) analysis stratified according to expression trajectories. (A) Heatmap depicting brain-specific or general biological term enrichment for clusters identified as in Figure 2A (adjusted p value < = 0.05, 10 top enriched terms for each gene group defined). (B) Dot plot showing significance of top 20 GO categories for modules showing acutely upregulated genes showing full recovery at day 14 (p < = 0.05, q < = 0.05). (C) Same as (B) for acutely downregulated genes. (D–G) Network plots depicting genes annotated to up to the five most significant brain-related GO terms for the module with (D) delayed upregulation of gene expression in response to TBI, (E) delayed downregulation of gene expression, (F) persistent, increasing perturbation in gene expression, and (G) acutely upregulated genes showing a partial recovery at two weeks. ATP, adenosine triphosphate; MAPK, mitogen-activated protein kinase; mRNA, messenger RNA; NF, nuclear factor; TBI, traumatic brain injury.
FIG. 4.
FIG. 4.
H3K4me3 at promoters of genes differentially expressed after TBI. (A) Coverage rank plot for TBI versus sham for H3K4me3 at day 1. y-axis is for the TBI sample, whereas the x-axis is for the sham control. Each dot is a gene promoter locus present at either of the two conditions. Green-colored dots are associated with promoters of upregulated genes, whereas red-colored ones are for downregulated genes. Region highlighted with dashed red box denotes genes with distinctive H3K4me3 enrichment in TBI at day 1. Dots labeled with name of genes were manually annotated for example genes that showed more prominent differences between TBI and its sham control. (B) Box plot showing the distribution of relative likelihood ratios for each of the DE gene trajectories defined in Figure 2A compared to genes that were not differentially expressed (NS). Green- and pink-filled boxes denote up- and downregulated associated genes, respectively; red stars above the plot indicate the statistical significance of Tukey means comparison between groups and the NS group (p values shown below the plot). (C) Example of a representation of H3K4me3 genomic enrichment coverage region for sham and TBI at day 1 for upregulated loci (Bcl3, Socs3, and Fos). (D) Same as (C) for downregulated genes (Car2, Tgfb2, and Ank3). (E) Bar plot depicting the most significant function annotation terms (GO biological process, Reactome, and PANTHER pathways) for the upregulated genes showing H3K4me3 differential enrichment. (F) Same as (E) for downregulated genes. Ank3, ankyrin 3; Bcl3, BCL3 transcription coactivator; Car2, carbonic anhydrase 2; DE, differential expression; Fos, Fos proto-oncogene, AP-1 transcription factor subunit; H3K4me, histone H3 lysine residue 4 tri-methylation; Socs3, suppressor of cytokine signaling 3; TBI, traumatic brain injury; Tgfb2, transforming growth factor beta 2.

References

    1. Centers for Disease Control and Prevention. (2019). Surveillance Report of Traumatic Brain Injury-related Emergency Department Visits, Hospitalizations, and Deaths—United States, 2014. Centers for Disease Control and Prevention: Atlanta, GA.
    1. Defense and Veterans Brain Injury Center. (2019). DoD Numbers for Traumatic Brain Injury Worldwide—Totals 2019 Q1-Q4 (https://dvbic.dcoe.mil/sites/default/files/tbi-numbers/DVBIC_WorldwideTo...). [cited 2020 Jun 25 ]. https://dvbic.dcoe.mil/sites/default/files/tbi-numbers/DVBIC_WorldwideTo... (Last accessed April 16, 2019).
    1. Masel, B.E., and DeWitt, D.S. (2010). Traumatic brain injury: a disease process, not an event. J. Neurotrauma 27, 1529–1540. - PubMed
    1. Crane, P.K., Gibbons, L.E., Dams-O'Connor, K., Trittschuh, E., Leverenz, J.B., Keene, C.D., Sonnen, J., Montine, T.J., Bennett, D.A., Leurgans, S., Schneider, J.A., and Larson, E.B. (2016). Association of traumatic brain injury with late-life neurodegenerative conditions and neuropathologic findings. JAMA Neurol. 73, 1062–1069. - PMC - PubMed
    1. Chauhan, N.B. (2014). Chronic neurodegenerative consequences of traumatic brain injury. Restor. Neurol. Neurosci. 32, 337–365. - PubMed