[Preprint]. 2021 Dec 17:2021.12.07.21267431.
doi: 10.1101/2021.12.07.21267431.

Clinical and genomic signatures of rising SARS-CoV-2 Delta breakthrough infections in New York

Affiliations

Clinical and genomic signatures of rising SARS-CoV-2 Delta breakthrough infections in New York

Ralf Duerr et al. medRxiv. .

Update in

Abstract

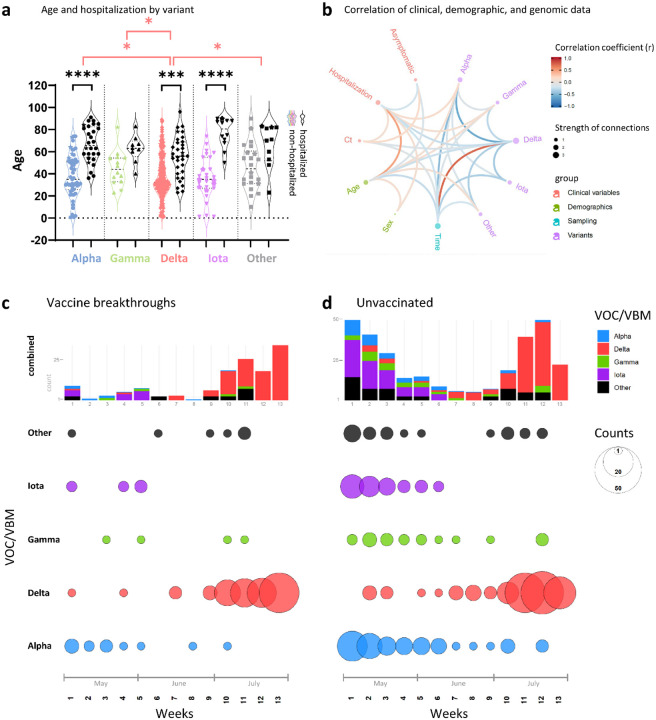
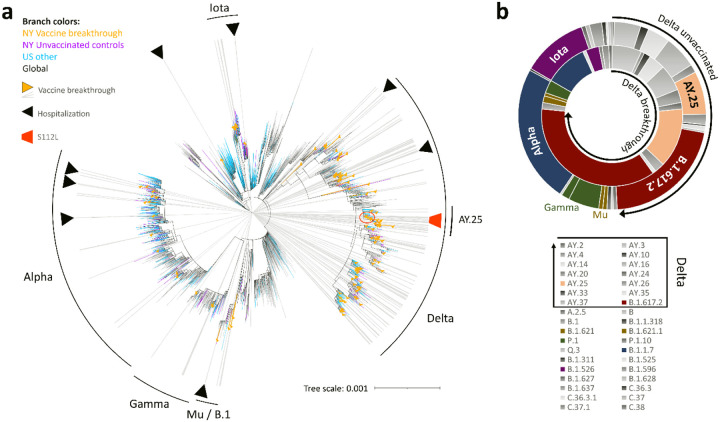
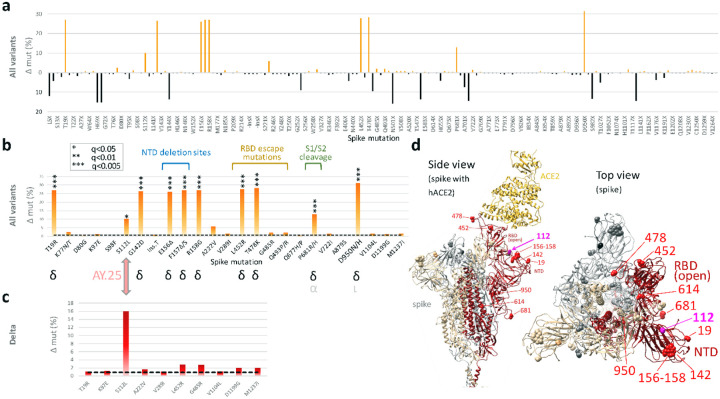
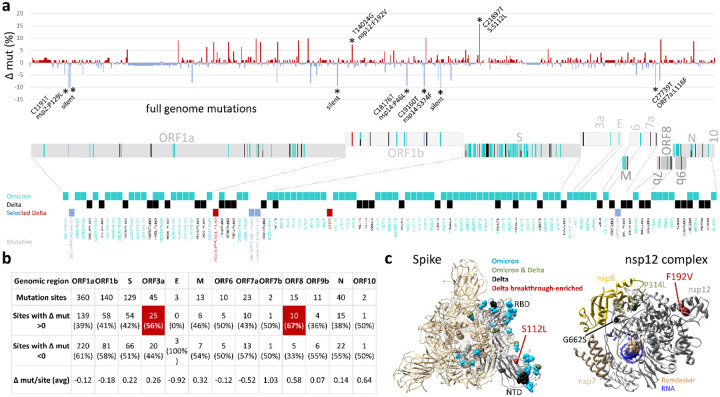
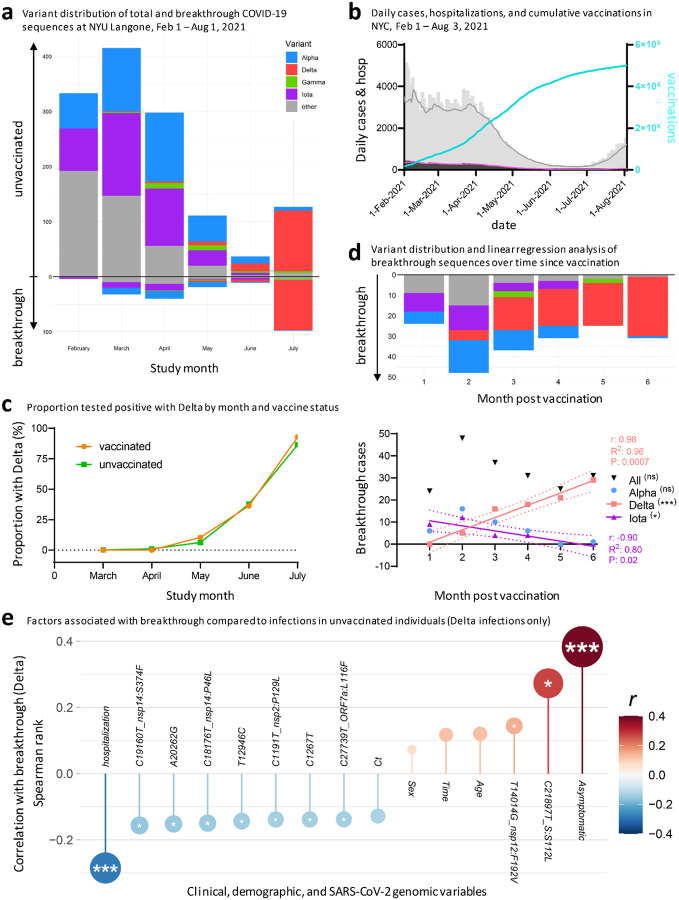
In 2021, Delta has become the predominant SARS-CoV-2 variant worldwide. While vaccines effectively prevent COVID-19 hospitalization and death, vaccine breakthrough infections increasingly occur. The precise role of clinical and genomic determinants in Delta infections is not known, and whether they contribute to increased rates of breakthrough infections compared to unvaccinated controls. Here, we show a steep and near complete replacement of circulating variants with Delta between May and August 2021 in metropolitan New York. We observed an increase of the Delta sublineage AY.25, its spike mutation S112L, and nsp12 mutation F192V in breakthroughs. Delta infections were associated with younger age and lower hospitalization rates than Alpha. Delta breakthroughs increased significantly with time since vaccination, and, after adjusting for confounders, they rose at similar rates as in unvaccinated individuals. Our data indicate a limited impact of vaccine escape in favor of Delta's increased epidemic growth in times of waning vaccine protection.


Conflict of interest statement

Conflict of Interest Statement: The authors declare that no conflict of interest exists

Figures

Figure 1.
Figure 1.. Relationship of clinical, demographic, and genomic data.
a, Violin plot summarizing the age distribution of the combined data set of 132 vaccinated and 283 unvaccinated SARS-CoV-2-positive individuals by variant. The pairs of colored and black violins show non-hospitalized versus hospitalized cases per variant. Horizontal lines indicate the median and interquartile ranges of values. Breakthrough cases are shown as stars. Statistical comparisons of age were made using Kruskal-Wallis tests between variants (red brackets) and, for each variant, between non-hospitalized and hospitalized cases (black brackets). All statistically significant results are shown: * P<0.05, ** P<0.01, *** P<0.001, **** P<0.0001. b, Correlation analysis of clinical, demographic, and genomic data of SARS-CoV-2 infected individuals (as in A). Red and blue edges represent positive and negative correlations between connected variables, respectively, according to the scale of r values to the right. Only significant correlations (P<0.05, Spearman rank test) are displayed. Nodes are color-coded based on the grouping of variables. Node size corresponds to the strength of correlations. Ct: Cycle threshold in RT-PCR; sex: male sex; time: date of sampling. c, d, Distribution of variants (top) and absolute variant counts (bottom), colored and separated into to the most frequently detected variants of concern (VOC) and being monitored (VBM) and all other variants combined (Other). Vaccine breakthrough infections (c) are shown side-by-side with unvaccinated controls (d) on a weekly basis starting May 1st 2021 (all full weeks shown).
Figure 2.
Figure 2.. Phylogenetic analysis and variant distribution of SARS-CoV-2 vaccine breakthrough and unvaccinated control sequences.
a, Maximum likelihood (IQ) tree of 3511 SARS-CoV-2 full genome sequences (base pairs 202–29,666 according to Wuhan-Hu-1 as reference), including 132 vaccine breakthrough (orange) and 283 unvaccinated control SARS-CoV-2 sequences from the NYU Langone Health cohort (greater NYC area) (purple) together with 920 other US (non-NYU; cyan) and 2176 global (non-US; black) reference sequences. The substitution scale of the tree, generated with 1000 bootstrap replicates and Wuhan/WH01/2019-12-26 as root, is indicated at the bottom right. Vaccine breakthrough sequences are highlighted by orange triangles (as branch symbols) and gray rays radiating from the root to the outer rim of the tree. Hospitalizations among vaccine breakthrough infections are indicated by black triangles. The variants responsible for most vaccine breakthrough infections are labeled. The Delta plus S112L sub-lineage is encircled and highlighted with a red trapezoid symbol. b, Double-donut plot to compare the variant distribution of breakthrough (inner ring) and unvaccinated control sequences (outer ring). The most abundant variants and Delta subvariants (highlighted by black arrows) are shown in color and labelled in the plot (outer ring only). The color code for all detected variants (Pango lineages) is provided below.
None
a, Site-specific amino acid mutation (mut) frequencies in spike in 132 vaccine breakthrough sequences compared to 283 unvaccinated controls from the same cohort. The Wuhan-Hu-1 sequence served as reference. The mirror plot displays differences of mutation frequencies per spike residue between vaccinated and unvaccinated groups, shown along the x-axis (n=168); orange (facing up) and black bars (facing down) refer to elevated mutation frequencies in vaccinated or unvaccinated individuals, respectively. b, Enriched spike mutations in vaccine breakthrough sequences compared to unvaccinated controls. Unique occurrences of mutations in breakthrough cases were disregarded. The dashed black line indicates the average mutation frequency across all spike residues in the unvaccinated control data set (n=283) compared to Wuhan-Hu-1. Significantly enriched mutations in Fisher exact tests are indicated by asterisks (* P<0.05, *** P<0.005) and the variants in which these mutations were found are shown below (black: main source, gray: secondary source). Mutations in the spike N-terminal domain (NTD), receptor binding domain (RBD), and near the S1/S2 interface associated with neutralization escape and/or affecting important biological functions are labeled. c, The same analysis as in (b) but focusing on Delta sequences exclusively. 101 Delta vaccine breakthrough sequences were compared to 139 Delta unvaccinated controls. The dashed black line indicates the average mutation frequency across all spike residues in the Delta unvaccinated control data set compared to Wuhan-Hu-1 as reference (n=139). d, Structural analysis of mutation sites on a spike trimer bound to human ACE2 (hACE2) (pdb S_ACE2). Each protomer is colored differently. The hACE2-bound protomer with the RBD in the “up” position is shown in red. Statistically enriched mutation sites in vaccine breakthroughs (according to b) are shown as spheres, labeled in one protomer in red (Delta) or pink (AY.25).
Figure 4.
Figure 4.. Full genome mutation analysis in SARS-CoV-2 Delta vaccine breakthrough sequences compared to Delta unvaccinated controls and in the context of Omicron mutations.
a, Site-specific base pair mutation frequencies in full genomes (bp 202–29666) of 101 Delta vaccine breakthrough sequences compared to 139 Delta unvaccinated controls from the same cohort. The Wuhan-Hu-1 sequence served as reference. The mirror plot displays differences of mutation frequencies per site between vaccinated and unvaccinated groups, shown along the x-axis (n=791); red (facing up) and blue bars (facing down) refer to elevated mutation rates in vaccinated or unvaccinated individuals, respectively. Significantly enriched mutations in Fisher exact tests are indicated by asterisks (* P<0.05) and are labeled. SARS-CoV-2 coding genomic regions are shown below the plot. Non-synonymous mutations in Omicron (cyan; including B.1.1.529, BA.1, and BA.2 mutations), Delta (black), or Delta breakthrough-enriched mutations (red and blue) are shown by colored ticks. The mutation sites/names are indicated below. b, Differential full genome mutation analysis of Delta infections in vaccinated and unvaccinated individuals by SARS-CoV-2 genomic region. Regions in which mutation sites were more frequently mutated in vaccinated compared to unvaccinated individuals are highlighted in orange and percentages shown in bold. c, Structural analysis of Delta breakthrough-enriched mutations in comparison to Omicron- and Delta-defining mutations. Structures are shown for spike in the activated state with one RBD in the up position (pdb: S_ACE2; mutations only shown in the gray, activated protomer) and the nsp12 complex with bound nsp7, nsp8, template-primer RNA, and remdesivir triphosphate (pdb: 7bv2). 3a: ORF3a; 7a: ORF7a; 7b: ORF7b; 9b: ORF9b; 10: ORF10; bp: base pairs; E: envelope; mut: mutation; nsp: non-structural protein; N: nucleocapsid; NTD: N-terminal domain; ORF: open reading frame; RBD: receptor-binding domain; S: spike.
None
post vaccination, and clinical and genomic factors associated with Delta breakthrough.
a, Variant distribution of SARS-CoV-2 sequences from unvaccinated (facing up) and vaccinated individuals (facing down), obtained at NYU Langone Health between February and July 2021. b, Daily COVID-19 cases (gray bars) and 7-day averages (gray line), daily COVID-19 deaths (black bars) and 7-day averages (pink line), and cumulative vaccination numbers (turquoise line) in New York City between February 1st and August 3rd. Source of data: NYC Open Data and NYC Health, Citywide Immunization Registry (CIR). c, Probability of positive test with Delta by month in vaccinated and unvaccinated individuals, adjusted for month of test, sex, and age of participants. d, Variant distribution among all NYULH breakthrough sequences, displayed according to months post full vaccination (starting at day 14 after the last dose for full vaccination). The chart below shows a linear regression analysis of breakthrough infections per variant against time post vaccination. Significant results are highlighted by asterisks, labeled with the correlation coefficient (r), goodness of fit (R2), and P value, and the fitted line with 95% confidence intervals shown. * P<0.05, ** P<0.01, *** P<0.005. e, Correlation of clinical, demographic, and SARS-CoV-2 genomic factors with breakthrough by comparing Delta infections in vaccinated (n=101) and unvaccinated individuals (n=139). Spearman rank correlation is displayed on the y axis and color-coded. Multiple comparison-corrected P values (q, Benjamini-Hochberg) are indicated by asterisks within the circles (* q<0.05, ** q<0.01, *** q<0.005). Ct: Cycle threshold in RT-PCR; sex: male sex; time: date of sampling.

References

    1. World Health Organization (WHO). WHO Coronavirus (COVID-19) Dashboard. Vol. 2021 (2021).
    1. Centers for Disease Control and Prevention (CDC). SARS-CoV-2 Variant Classifications and Definitions. Vol. 2021 (2021).
    1. GISAID. GISAID database. Vol. 2021 (2021).
    1. Bansal K. & Kumar S. Mutational cascade of SARS-CoV-2 leading to evolution and emergence of omicron variant. bioRxiv, 2021.2012.2006.471389 (2021). - PMC - PubMed
    1. Cele S., et al. SARS-CoV-2 Omicron has extensive but incomplete escape of Pfizer BNT162b2 elicited neutralization and requires ACE2 for infection. medRxiv, 2021.2012.2008.21267417 (2021).

Publication types