. 2022 Feb 7;219(2):e20211239.
doi: 10.1084/jem.20211239. Epub 2021 Dec 15.

Failures in thymus medulla regeneration during immune recovery cause tolerance loss and prime recipients for auto-GVHD

Affiliations

Failures in thymus medulla regeneration during immune recovery cause tolerance loss and prime recipients for auto-GVHD

Abdullah S Alawam et al. J Exp Med. .

Abstract

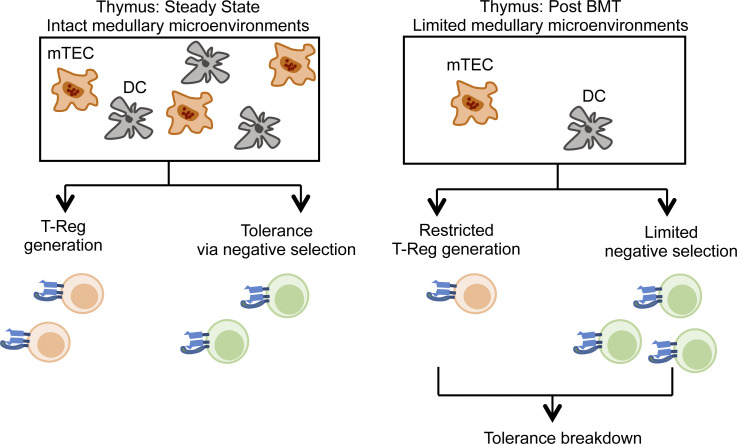
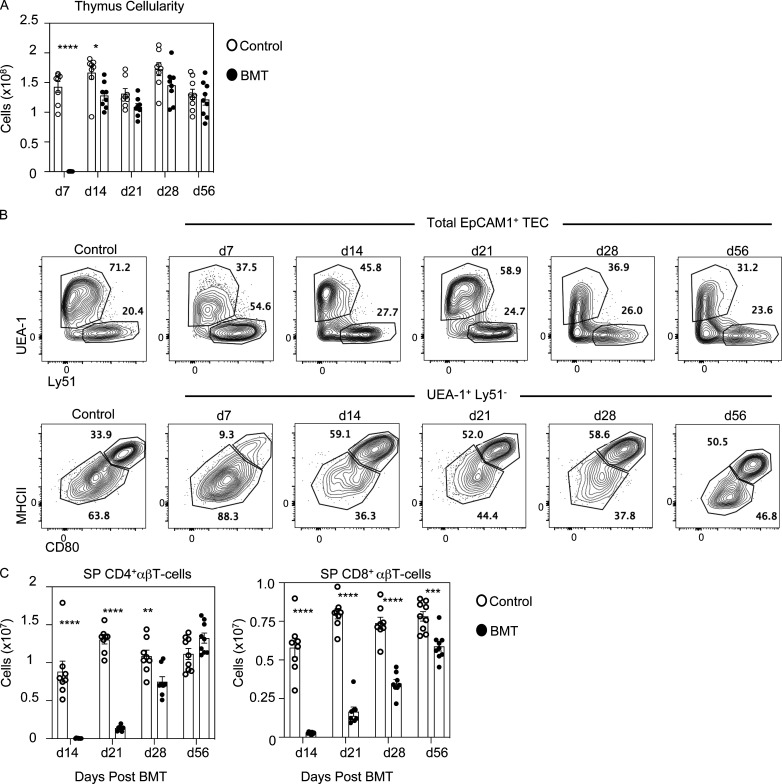
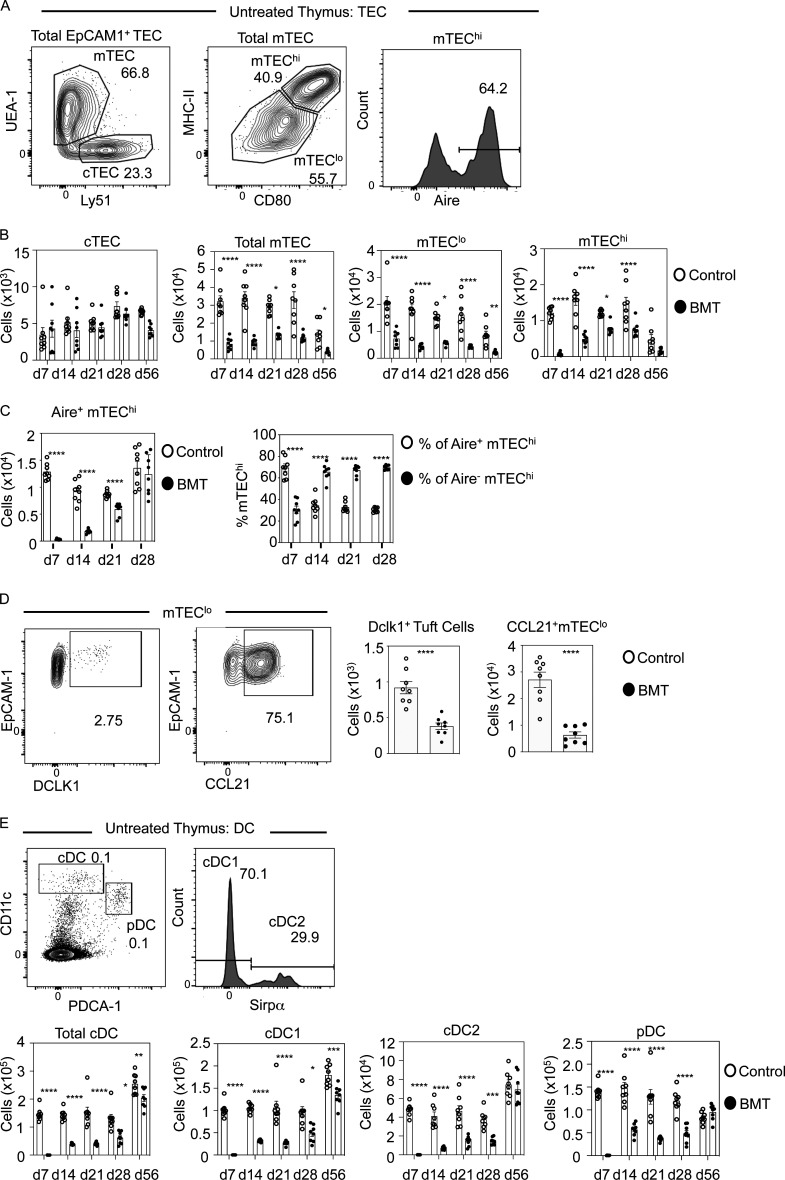
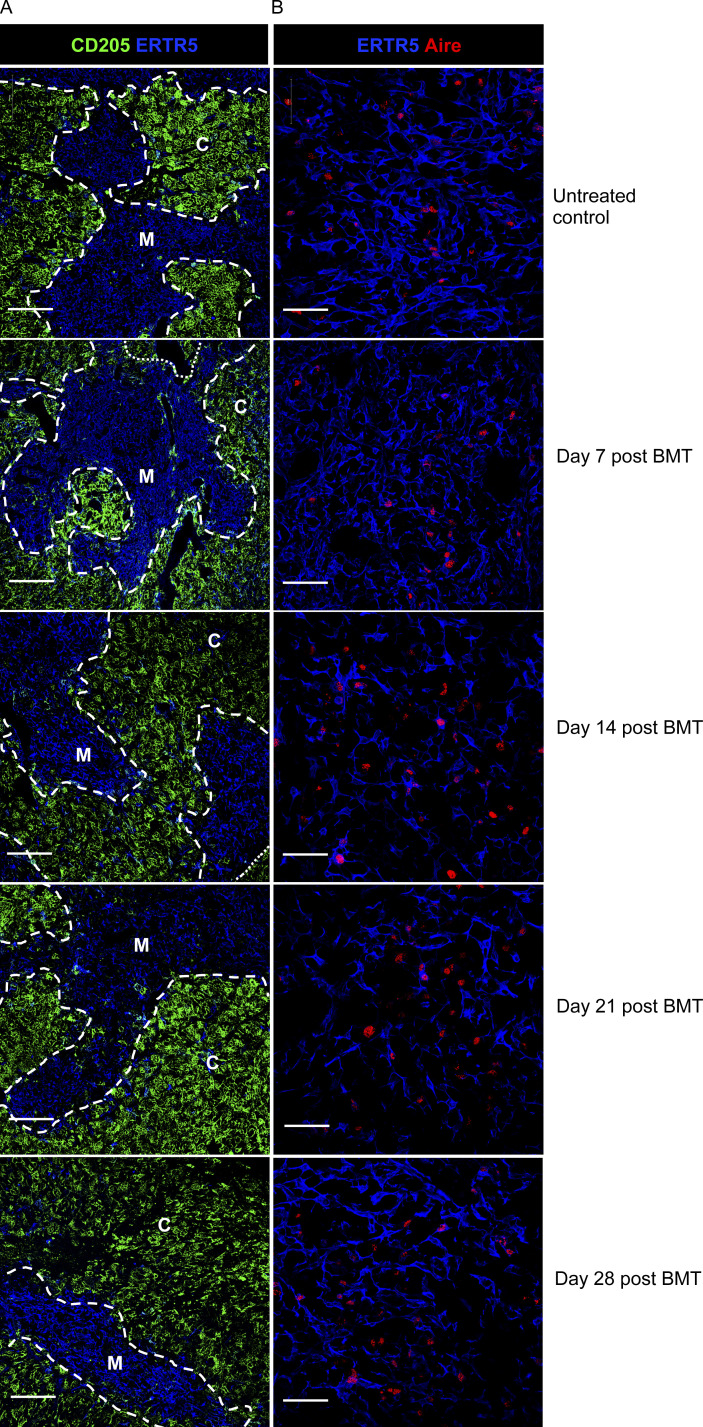
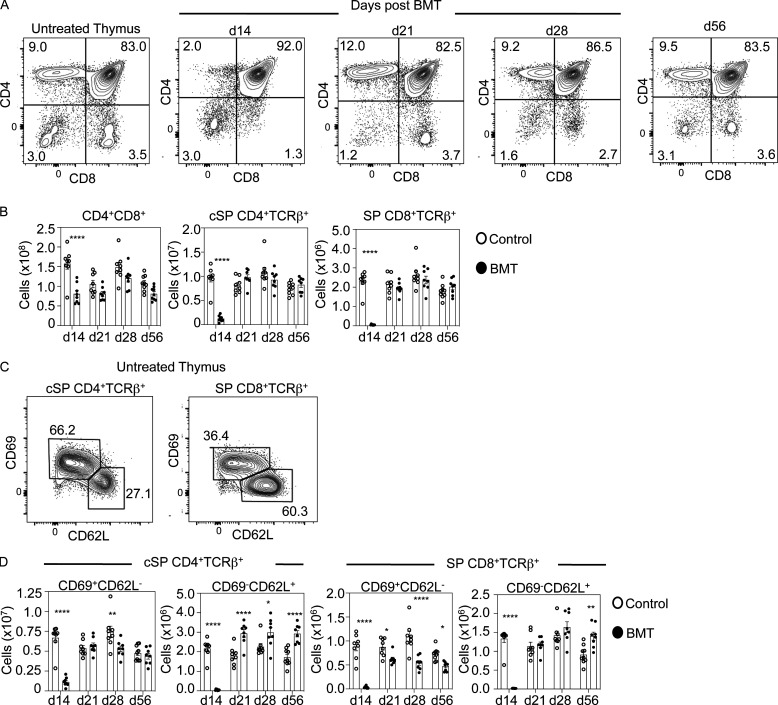
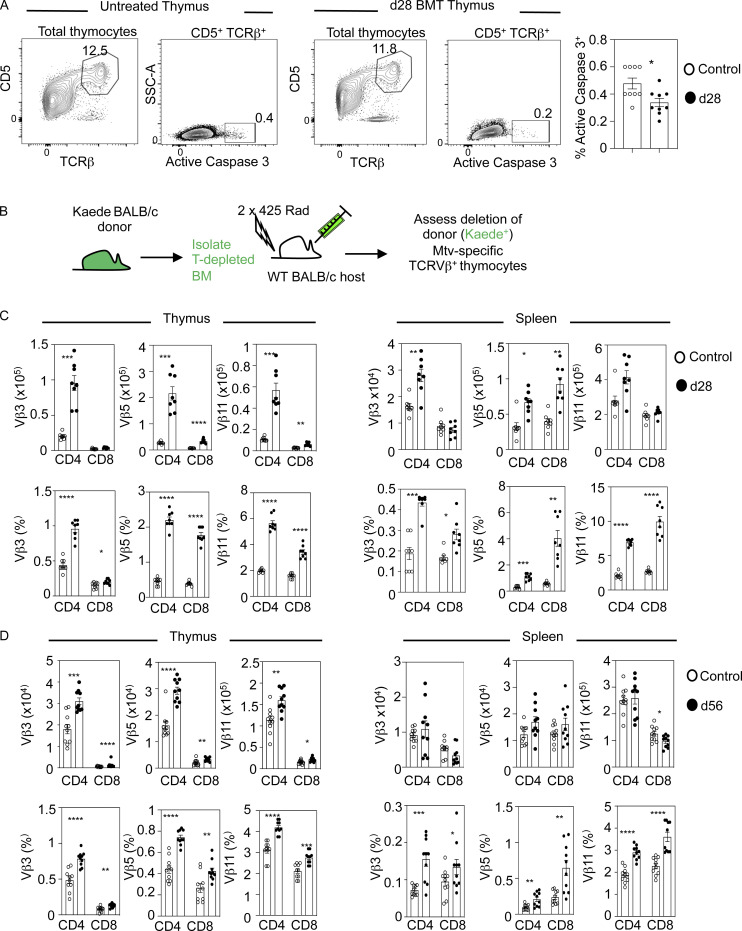
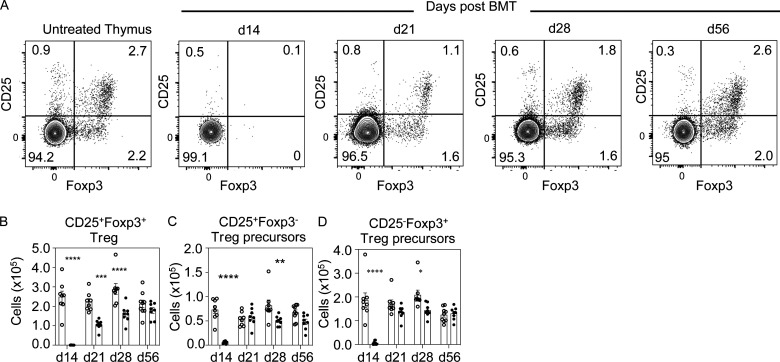
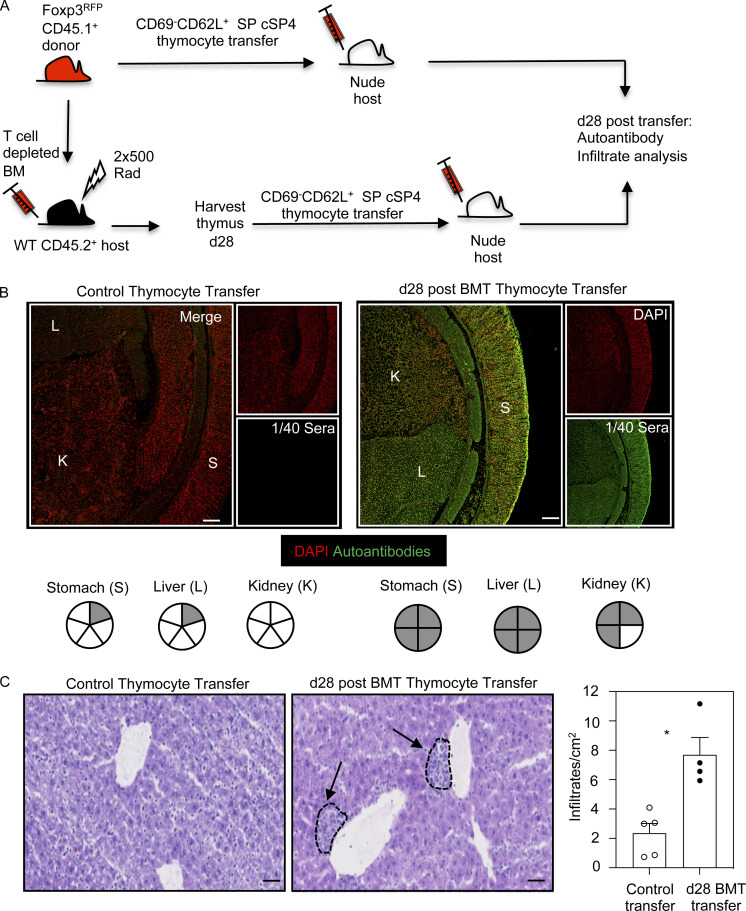
Bone marrow transplantation (BMT) is a widely used therapy for blood cancers and primary immunodeficiency. Following transplant, the thymus plays a key role in immune reconstitution by generating a naive αβT cell pool from transplant-derived progenitors. While donor-derived thymopoiesis during the early post-transplant period is well studied, the ability of the thymus to synchronize T cell development with essential tolerance mechanisms is poorly understood. Using a syngeneic mouse transplant model, we analyzed T cell recovery alongside the regeneration and function of intrathymic microenvironments. We report a specific and prolonged failure in the post-transplant recovery of medullary thymic epithelial cells (mTECs). This manifests as loss of medulla-dependent tolerance mechanisms, including failures in Foxp3+ regulatory T cell development and formation of the intrathymic dendritic cell pool. In addition, defective negative selection enables escape of self-reactive conventional αβT cells that promote autoimmunity. Collectively, we show that post-transplant T cell recovery involves an uncoupling of thymopoiesis from thymic tolerance, which results in autoimmune reconstitution caused by failures in thymic medulla regeneration.


Conflict of interest statement

Disclosures: The authors declare no competing interests exist.

Figures

None
Graphical abstract
Figure S1.
Figure S1.
Thymus cellularity, TEC subset definition, and peripheral T cells in BMT mice. (A–C) Total thymus cellularity is shown across all time points analyzed after BMT (A), cTEC/mTEC gating (B), and number of CD4+ and CD8+ αβT cells in the spleen (C) of age-matched control and BMT mice (donor-derived CD45.1+ cells for the latter) at the indicated time points after transplant (minimum of eight mice from at least three separate experiments). d, day. Error bars indicate SEM. *, P < 0.05; **, P < 0.01; ***, P < 0.001; ****, P < 0.0001.
Figure 1.
Figure 1.
Selective and sustained failures in thymus medulla regeneration during BMT-mediated immune reconstitution. (A) Gating strategy for TEC subsets in control and post-transplant thymus tissue. (B) Quantitation of TEC subsets in control (white dots) and BMT (black dots) mice. Controls are age-matched cohorts of unmanipulated mice taken at each time point alongside transplanted mice. Data represent three experiments, eight mice for each time point. d, day. (C) Quantitation of number of Aire+ mTEChi cells in control (white dots) and after BMT (black dots) and proportions of Aire+ or Aire cells within mTEChi. (D) Representative FACS plots of DCLK1 or CCL21 expressing mTEClo with quantitation of these in control (white dots) and BMT mice (black dots); n = 8 across two independent experiments. (E) Gating strategy to detect thymic PDCA-1+ plasmacytoid DC, Sirpα cDC1, and Sirpα+ cDC2 in control and post-transplant mice with quantitation of thymic DCs in control (white bars) and BMT (black bars) mice. Data from three separate experiments, n = 8 each time point. Error bars indicate SEM. *, P < 0.05; **, P < 0.01; ***, P < 0.001; ****, P < 0.0001.
Figure S2.
Figure S2.
Thymus microenvironments in BMT mice. (A and B) Confocal analysis of frozen thymus sections from untreated and post-BMT mice at the indicated time points are shown, labeled with CD205 and ERTR5 to identify cortex and medulla (A) and ERTR5 and Aire to detect Aire+ mTECs (B). Dashed/dotted lines denote corticomedullary junction. Scale bars denote 200 μm (A) and 50 μm (B). C, cortex; M, medulla.
Figure 2.
Figure 2.
Post-transplant thymopoietic recovery of conventional αβT cells occurs independently of thymus medulla regeneration. (A) CD4/CD8 profiles of thymocytes from control or BMT mice at the indicated time points, the latter pregated on donor CD45.1+ cells. d, day. (B) Quantitation of CD4+CD8+ and conventional CD25Foxp3 (cSP) CD4+TCRβ+/CD8+TCRβ+ thymocytes at indicated time points in control (white dots) and BMT mice (black dots). (C and D) Subdivision of cSP CD4+TCRβ+ thymocytes into immature CD69+CD62L and mature CD69CD62L+ subsets; quantitation of control (white dots) and BMT mice (black dots) is in D. All data from three separate experiments; n = 8 for each time point. Error bars indicate SEM; *, P < 0.05; **, P < 0.01; ****, P < 0.0001.
Figure 3.
Figure 3.
Immune reconstitution involves defective negative selection of conventional αβT cells. (A) Detection of TCR-signaled cleaved caspase 3+ thymocytes undergoing negative selection in control (white dots) or in BMT mice at 28 d (d28) after transplant (black dots). Data are from three separate experiments; n = 9 for each time point. (B) Schematic for generation of BALB/c background BM chimeras, where expression of the green fluorescent protein Kaede enables identification of donor-derived cells. (C and D) Quantitation of TCRVβ3+, Vβ5+, and Vβ11+ SP CD4+TCRβ+ or SP CD8+TCRβ+ in thymus (left panel) or spleen (right panel) with control (white dots) or BMT mice at 28 d after transplant (black dots; C) or 56 d after transplant (D). For BMT mice in C and D, cells were pregated on Kaede+ cells of donor origin. Data from three separate experiments; n = 8–10 per time point. Error bars indicate SEM. *, P < 0.05; **, P < 0.01; ***, P < 0.001; ****, P < 0.0001. SSC-A, side scatter area.
Figure S3.
Figure S3.
Comparable TCRVβ usage in BALB/c and BALB/c Kaede mice. Analysis of TCRVβ3+, 5+, and 11+ CD4+ and CD8+ SP cells in thymus and spleen of WT BALB/c and Kaede BALB/c mice (minimum of six mice from two separate experiments). Error bars indicate SEM.
Figure 4.
Figure 4.
Foxp3+ Treg development is impaired during post-transplant immune reconstitution. (A) Representative FACS plots of SP CD4+TCRβ+ thymocytes in untreated and BMT mice analyzed for expression of Foxp3 and CD25, with thymocytes from BMT mice pregated on donor-derived CD45.1+ cells. d, day. (B–D) Quantitation of SP CD4+TCRβ+CD25+Foxp3+ Treg (B), SP CD4+TCRβ+CD25+Foxp3 Treg precursors (C), and SP CD4+TCRβ+CD25Foxp3+ Treg (D); white dots denote control mice, and black dots show BMT mice harvested at the indicated time points. Data from three separate experiments; n = 8 at each time point. Error bars indicate SEM. *, P < 0.05; **, P < 0.01; ***, P < 0.001; ****, P < 0.0001.
Figure 5.
Figure 5.
Failures in post-transplant thymus medulla generation result in loss of tolerance and autoimmunity. (A) Schematic of the generation of BMT mice to study induction of T cell tolerance during immune reconstitution. (B) Confocal images of kidney (K), liver (L), and stomach (S) sections incubated with 1/40 sera obtained from nude mice receiving mature cSP CD4+ thymocytes from either control mice or day 28 (d28) BMT mice. Autoantibody staining is shown in green, and DAPI is in red. Scale bar denotes 100 µm. Images represent serum staining from at least four mice and three separate sections per mouse. Pie charts summarize autoantibody staining data; each segment represents an individual mouse, and gray denotes positive autoantibody staining. (C) Liver sections from control or day 28 BMT mice, stained with hematoxylin and eosin to detect lymphocytic infiltrates (indicated by dotted lines and arrows). Scale bars denote 50 µm. Bar chart shows quantitation of infiltrates in control (white dots) and day 28 BMT mice (black dots). Data from four or five mice and two separate experiments. Error bars indicate SEM; *, P < 0.05.

Comment in

  • mTEC damage risks immune recovery.
    Takahama Y. Takahama Y. J Exp Med. 2022 Feb 7;219(2):e20212326. doi: 10.1084/jem.20212326. Epub 2021 Dec 17. J Exp Med. 2022. PMID: 34919145 Free PMC article.

References

    1. Arber, C., Brenner M.K., and Reddy P.. 2013. Mouse models in bone marrow transplantation and adoptive cellular therapy. Semin. Hematol. 50:131–144. 10.1053/j.seminhematol.2013.03.026 - DOI - PMC - PubMed
    1. Awong, G., Singh J., Mohtashami M., Malm M., La Motte-Mohs R.N., Benveniste P.M., Serra P., Herer E., van den Brink M.R., and Zúñiga-Pflücker J.C.. 2013. Human proT-cells generated in vitro facilitate hematopoietic stem cell-derived T-lymphopoiesis in vivo and restore thymic architecture. Blood. 122:4210–4219. 10.1182/blood-2012-12-472803 - DOI - PMC - PubMed
    1. Barton-Burke, M., Dwinell D.M., Kafkas L., Lavalley C., Sands H., Proctor C., and Johnson E.. 2008. Graft-versus-host disease: a complex long-term side effect of hematopoietic stem cell transplant. Oncology (Williston Park). 22(11, Suppl Nurse Ed):31–45. - PubMed
    1. Boehm, T., Scheu S., Pfeffer K., and Bleul C.C.. 2003. Thymic medullary epithelial cell differentiation, thymocyte emigration, and the control of autoimmunity require lympho-epithelial cross talk via LTbetaR. J. Exp. Med. 198:757–769. 10.1084/jem.20030794 - DOI - PMC - PubMed
    1. Bornstein, C., Nevo S., Giladi A., Kadouri N., Pouzolles M., Gerbe F., David E., Machado A., Chuprin A., Tóth B., et al. . 2018. Single-cell mapping of the thymic stroma identifies IL-25-producing tuft epithelial cells. Nature. 559:622–626. 10.1038/s41586-018-0346-1 - DOI - PubMed

Publication types

MeSH terms