. 2021 Dec 17;7(51):eabj1281.
doi: 10.1126/sciadv.abj1281. Epub 2021 Dec 15.

Harmony COVID-19: A ready-to-use kit, low-cost detector, and smartphone app for point-of-care SARS-CoV-2 RNA detection

Affiliations

Harmony COVID-19: A ready-to-use kit, low-cost detector, and smartphone app for point-of-care SARS-CoV-2 RNA detection

Nuttada Panpradist et al. Sci Adv. .

Abstract

RNA amplification tests sensitively detect severe acute respiratory syndrome coronavirus 2 (SARS-CoV-2) infection, but their complexity and cost are prohibitive for expanding coronavirus disease 2019 (COVID-19) testing. We developed “Harmony COVID-19,” a point-of-care test using inexpensive consumables, ready-to-use reagents, and a simple device. Our ready-to-use, multiplexed reverse transcription, loop-mediated isothermal amplification (RT-LAMP) can detect down to 0.38 SARS-CoV-2 RNA copies/μl and can report in 17 min for high–viral load samples (5000 copies/μl). Harmony detected 97 or 83% of contrived samples with ≥0.5 viral particles/μl in nasal matrix or saliva, respectively. Evaluation in clinical nasal specimens (n = 101) showed 100% detection of RNA extracted from specimens with ≥0.5 SARS-CoV-2 RNA copies/μl, with 100% specificity in specimens positive for other respiratory pathogens. Extraction-free analysis (n = 29) had 95% success in specimens with ≥1 RNA copies/μl. Usability testing performed first time by health care workers showed 95% accuracy.


Figures

Fig. 1.
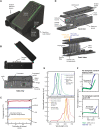
Fig. 1.. Harmony COVID-19 workflow, analytical performance, and interpretation.
(A) User workflow. A nasal swab is collected and eluted in the rehydration buffer using either a unified sampler dispenser (shown) or a tube-and-bulb method (Fig. 8). The swab eluate is then transferred into the reaction tube to rehydrate lyophilized and preloaded RT-LAMP reagents. Users follow the instructions on the cell phone app to record the sample identity, insert the tube in the test slot, and close the device. Four samples can be analyzed in parallel. Photo credits: (1) to (4), Mark Stone at the University of Washington; and (5), Christopher Snyder at North Seattle College. (B) Examples of on-device analysis. Lyophilized reagents were rehydrated with the eluate from swabs spiked with 0, 200, 2000, or 20,000 copies of SARS-CoV-2 RNA, run on the device, and analyzed in real time. The samples with SARS-CoV-2 RNA at 2000, 200, and 20 copies per reaction (rxn) were reported as positive by software at 27, 30, and 41 min, respectively; after 60 min, the NTC reaction was classified as negative. a.u., arbitrary units. (C) Time to result. Individual detection time points (n = 3) are plotted. Variation in detection time increases as samples approach the detection limit. (D) Diagnostic algorithm. Harmony COVID-19 software calls samples as positive, negative, or indeterminate (IND) based on detection of the three regions in the nucleocapsid gene [Harmony NC1 overlapping with the CDC N1 region, Harmony NC2 (overlapping with CDC N3 region excluded from the current kit), and Harmony NC3 overlapping with the CDC N2 region] and the engineered IAC sequence.
Fig. 2.
Fig. 2.. Comparison of RT-LAMP using TFv1 polymerase versus commercial Bst polymerase using conventional RT–quantitative polymerase chain reaction machine.
(A) FAM signal of the RT-LAMP assay using fresh reagents (not lyophilized) containing only NC1 primer set (six primers total) and SARS-CoV-2 detection probe and quencher with 0, 400, or 4000 SARS-CoV-2 RNA copies per reaction (corresponding to 0, 100, or 1000 SARS-CoV-2 RNA copies/μl, respectively). (B) FAM signal and (C) IAC signal of the four-plexed RT-LAMP assay using fresh reagents containing all primers (18 SARS-CoV-2 primers and 1 IAC primer), SARS-CoV-2 detection probe and quencher, and IAC detection probe and quencher with 0, 400, or 4000 SARS-CoV-2 RNA copies per reaction (corresponding to 0, 100, or 1000 SARS-CoV-2 RNA copies/μl, respectively). For (C), only NTC is shown to indicate true negative. All reactions were incubated at 63.3°C for 1 hour and read every 13 s in a commercial thermal cycler.
Fig. 3.
Fig. 3.. Lyophilized RT-LAMP and its analytical sensitivity.
(A) To set up the assay, a sample in elution/rehydration buffer containing magnesium, ThermoPol buffer, and detergents is added to rehydrate the lyophilized RT-LAMP reagents in a single step. RNase, ribonuclease; TiPP, thermostable inorganic pyrophosphatase; DTT, dithiothreitol; dNTPs, deoxynucleotide triphosphates. (B) Real-time amplification signal of RT-LAMP reactions containing SARS-CoV-2 RNA (NTC), 10, 15, 20, 200, 2000, 2 × 10⁴, or 2 × 10⁵ copies/40 μl of reaction. Left: The average (n = 3) FAM signal detecting SARS-CoV-2. *Only two of the three replicates of 10 copies per reaction amplified so the average was from duplicate reactions. Right: TEX 615 signal detecting the IAC. The IAC was detected in the NTC (n = 3) and in the single 10 copies per reaction that did not detect SARS-CoV-2. (C) Time to detection of SARS-CoV-2 and IAC targets reported by the real-time thermal cycler. Individual data points are plotted. Note that only two of the three replicates of 10 copies per reaction amplified. IAC signals were properly detected in NTC (n = 3) and one of the three replicates of 10 copies per reaction undetected for SARS-CoV-2. (D) Evaluation of analytical sensitivity at 20 copies per reaction of SARS-CoV-2 RNA (n = 40), performed in two different runs (n = 20 each) with two different serially diluted RNA samples. Time to result of individual samples is plotted along with medians (middle lines of the boxes), interquartile ranges (edges of the boxes), ranges (the ends of whiskers), and outliers (data points outside the whiskers). (E) Impact of nasal matrix. SARS-CoV-2 RNA at 0, 40, or 100 copies per reaction (corresponding to 0, 1, or 2.5 copies/μl) was amplified in lyophilized RT-LAMP in the presence of simulated nasal matrix (n = 3). All data were measured every 13 s using FAM and TEX 615 channels by a real-time thermal cycler in 1-hour reactions at 63.3°C.
Fig. 4.
Fig. 4.. Overview of Harmony COVID-19 hardware.
(A) Plastic case cradles the cell phone (removable and connected by a spring cable), mounts the heater/reader device, and houses a Charge-Plus USB-C connector hub (not shown). A sample station holds the sample and reaction tube during processing and is detachable to allow cleaning. Weight: housing, 266 g; heater/reader device, 104 g (total < 0.5 kg). Dimensions: housing, 205 mm by 167.5 mm by 125 mm; heater/reader device, 30 mm by 120 mm by 50 mm. (B) The heater/reader device contains an aluminum block with wells for four samples (0.2-ml reagent tubes) and is heated from the bottom by a resistive heater made from serpentine conductive traces on a printed circuit board. In the middle of the heater, a temperature sensor [Class B Platinum resistance temperature detector (RTD)] is used to measure the heat block temperature. Power to the heater is supplied by a metal-oxide-semiconductor field-effect transistor (MOSFET) and modulated by varying the pulse-width modulation (PWM) duty cycle of the MOSFET. (C) Temperature profile after the lid opening throughout a 60-min assay run. The microcontroller (die) is measured to ensure that the electronics are not overheated. (D) Lid heater, LED, and detector. A heater (85°C) on top of the tube prevents condensation on the tube lid. The lid heater is spring loaded to apply a preload force to the tubes to ensure good thermal contact and contains pass-through holes for excitation LEDs. (E) Spectral characteristics of the detection system. Blue and yellow LEDs provide excitation for FAM and TEX 615, respectively, and photodetectors on each side detect light passing through emission filters [spectral information from manufacturers (–43)]. The LEDs are operated independently (only one LED is illuminated at a given time). (F) Effect of TiPP on RT-LAMP signal in the Harmony device. Normalized signal of negative control samples using the RT-LAMP formulation with and without TiPP (n = 1 each) at 64°C.
Fig. 5.
Fig. 5.. Cell phone user interface and result reporting.
The Android Harmony application guides the user through steps to set up and run the test. (A) Intended use of the device. (B) Instructions for the user to prepare samples. (C) Selection of the number of samples. (D) Collection of sample identifiers by barcode, photo capture, or manual typing. (E) Instruction to insert the tube when the temperature of the device reaches the reaction temperature. (F) Real-time analysis during the test run. (G) Positive results are reported as soon as they are detected. (H) Negative and IND results are reported at the end of the run time.
Fig. 6.
Fig. 6.. Analysis of XPRIZE contrived sample panel without RNA extraction.
(A) Viral particles spiked in 1× PBS were tested in triplicate for each sample (n = 9 total for positive sample concentrations and n = 6 total for negative samples). (B) Viral particles spiked in human nasal matrix were tested in triplicate (n = 6 total for each concentration). (C) Viral particles spiked in saliva (n = 6 total for each concentration). (D) Summary table for the sensitivity and specificity of the Harmony COVID-19 system on the XPRIZE contrived samples. Concentrations of viral particles are the final concentrations in each 40-μl reaction. Threshold concentration for positive is at 20 viral particle copies per reaction (0.5 copies/μl). Contrived samples below the positive threshold were also tested (fig. S7). Real-time amplification curves of these data are in fig. S8. Reactions were set up either at room temperature (hollow) or on ice (solid).
Fig. 7.
Fig. 7.. Harmony COVID-19 performance on clinical specimens.
(A) Detection time by Harmony software for the analysis of RNA extracted from human nasal specimens from 101 patients presenting respiratory symptoms. Stored specimens were retested by RT-qPCR using N1 and N2 CDC primers; results matched previous results in 30 previous positive specimens (positive for N1 and N2) and 68 previous negative specimens, with three previous positive specimens classified as inconclusive (INC) because they were negative for either CDC N1 or N2 by RT-qPCR. Samples are ranked from left to right by increasing SARS-CoV-2 concentrations quantified by RT-qPCR. Extracted RNA from specimens was analyzed by Harmony (10-μl RNA in 40-μl dry RT-LAMP, n = 2). The classification results by Harmony were compared to RT-qPCR using CDC primers and probes (5-μl RNA in 20-μl RT-qPCR). (B) Organisms in clinical nasal specimens were quantified using OpenArray, as described (35). High-quantification cycle values indicate low concentrations. All these specimens were correctly identified as SARS-CoV-2 negative by Harmony. TP, true positive; TN, true negative; FP, false positive; FN, false negative. (C) Summary table for the sensitivity and specificity of the Harmony using extracted RNA from clinical specimens (RT-qPCR INC samples excluded). (D) Detection time by Harmony software for the analysis on 27 VTM specimens previously tested in (A). Without the RNA extraction step, 10 μl of VTM was added in the final 40-μl RT-LAMP reaction (n = 2). Dotted line indicates the detection time at 60 min. (E) Bland-Altman plot of the detection time of SARS-CoV-2–positive specimens of the direct VTM group compared to the extracted RNA group. Dotted lines indicate the acceptable bound of the difference of the detection time (means ± 1.96SD). (F) Summary table for the sensitivity of the Harmony using VTM specimens without extraction.
Fig. 8.
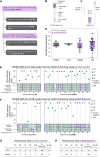
Fig. 8.. Usability study of Harmony COVID-19 workflow including two sample transfer methods at the POC.
(A) Study design. (B) Illustration of the first sample transfer method option using a unified dispenser, which integrates a swab, buffer container, and a dropper in a single device. The contained buffer is released to elute the swab sample by cracking a conduit, the user agitates the fluid by shaking the tube, and a dropper tip allows the use to transfer two drops of fluid to the reaction tube by squeezing the body of the device. (C) Illustration of the second sample transfer method including a volumetric transfer pipette (40 μl), a nasal swab, and a preloaded buffer vial. Movie S1 demonstrates this workflow. Briefly, swabs are manually rubbed on the side of the tube for 30 s, soaked for 1 min, and removed. The pipette is then used to transfer the swab eluate to rehydrate the lyophilized RT-LAMP reaction tube. Movie S2 demonstrates this workflow. (D) Volume transferred by each method performed by HCWs or LPs. Individual volume measurements are plotted along with medians (middle lines of the boxes), interquartile ranges (edges of the boxes), and ranges (the ends of whiskers). (E and F) Assay performance on blinded contrived swabs (one negative swab and one positive swab with SARS-CoV-2 DNA at 1000 copies per swab, corresponding to 100 copies per reaction) by LPs (n = 5) and untrained HCWs (n = 10) using transfer pipettes (E) or unified dispensers (F). The usability experiment written protocol is available on protocol.io (https://dx.doi.org/10.17504/protocols.io.bkvskw6e) and as a visual demonstration in movies S1 and S2. (G) Performance summary for the transfer pipette method. (H) Performance summary for the unified dispenser method.

References

    1. Cucinotta D., Vanelli M., WHO declares COVID-19 a pandemic. Acta Biomed. 91, 157–160 (2020). - PMC - PubMed
    1. World Health Organization, WHO Coronavirus (COVID-19) Dashboard (2021); https://covid19.who.int/.
    1. A. Sandford, Coronavirus: Half of humanity now on lockdown as 90 countries call for confinement (Euronews, 2021); www.euronews.com/2020/04/02/coronavirus-in-europe-spain-s-death-toll-hit....
    1. Bonaccorsi G., Pierri F., Cinelli M., Flori A., Galeazzi A., Porcelli F., Schmidt A. L., Valensise C. M., Scala A., Quattrociocchi W., Pammolli F., Economic and social consequences of human mobility restrictions under COVID-19. Proc. Natl. Acad. Sci. U.S.A. 117, 15530–15535 (2020). - PMC - PubMed
    1. Teran R. A., Walblay K. A., Shane E. L., Xydis S., Gretsch S., Gagner A., Samala U., Choi H., Zelinski C., Black S. R., Postvaccination SARS-CoV-2 infections among skilled nursing facility residents and staff members - Chicago, Illinois, December 2020-March 2021. MMWR Morb. Mortal. Wkly Rep. 70, 632–638 (2021). - PMC - PubMed