. 2021 Dec 15:10:e70246.
doi: 10.7554/eLife.70246.

Coronary blood vessels from distinct origins converge to equivalent states during mouse and human development

Affiliations

Coronary blood vessels from distinct origins converge to equivalent states during mouse and human development

Ragini Phansalkar et al. Elife. .

Abstract

Most cell fate trajectories during development follow a diverging, tree-like branching pattern, but the opposite can occur when distinct progenitors contribute to the same cell type. During this convergent differentiation, it is unknown if cells 'remember' their origins transcriptionally or whether this influences cell behavior. Most coronary blood vessels of the heart develop from two different progenitor sources-the endocardium (Endo) and sinus venosus (SV)-but whether transcriptional or functional differences related to origin are retained is unknown. We addressed this by combining lineage tracing with single-cell RNA sequencing (scRNAseq) in embryonic and adult mouse hearts. Shortly after coronary development begins, capillary endothelial cells (ECs) transcriptionally segregated into two states that retained progenitor-specific gene expression. Later in development, when the coronary vasculature is well established but still remodeling, capillary ECs again segregated into two populations, but transcriptional differences were primarily related to tissue localization rather than lineage. Specifically, ECs in the heart septum expressed genes indicative of increased local hypoxia and decreased blood flow. Adult capillary ECs were more homogeneous with respect to both lineage and location. In agreement, SV- and Endo-derived ECs in adult hearts displayed similar responses to injury. Finally, scRNAseq of developing human coronary vessels indicated that the human heart followed similar principles. Thus, over the course of development, transcriptional heterogeneity in coronary ECs is first influenced by lineage, then by location, until heterogeneity declines in the homeostatic adult heart. These results highlight the plasticity of ECs during development, and the validity of the mouse as a model for human coronary development.

Keywords: convergent differentiation; developmental biology; heart development; human; human mouse comparison; mouse; vascular development.


Conflict of interest statement

RP, JK, MZ, SK, RJ, SQ, IW, DB, VW, GD, KR No competing interests declared

Figures

Figure 1.
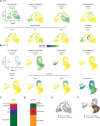
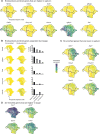
Figure 1.. Single-cell RNA sequencing (ScRNAseq) of lineage-traced coronary endothelial cells (ECs) at three stages reveals capillary heterogeneity during embryonic development.
(A and B) Overview of lineage tracing and scRNAseq approach in embryonic and adult mice. (C–K) Unbiased clustering of embryonic coronary ECs at the indicated time points and the contribution of endocardium (Endo)-enriched (BmxCreER lineage-labeled) and sinus venosus (SV)-enriched (BmxCreER lineage negative) cells to each cluster. Uniform Manifold Approximation and Projections (UMAPs) are shown for combined data (C, F, and I) and separated by lineage (D, G, and J) and percentages enumerated (E, H, and K).
Figure 1—figure supplement 1.
Figure 1—figure supplement 1.. Localization and expression of recombinant markers.
(A and B) tdTomato localization in sections BmxCreER;RosatdTomato hearts at e17.5 (A) and adult (B). Dashed yellow lines indicate the borders of the tissue sections. Dashed red line indicates the CV/endocardium (Endo) border. (C–E) Expression of the tdTomato gene in the Endo-enriched (Endo-lineage-positive) and sinus venosus (SV)-enriched (Endo-lineage-negative) sorted samples at e12 (C), e17.5 (D), and adult (E) from BmxCreER;RosatdTomato hearts (as shown in Figure 1A–B). Scale bars = 500 μm.
Figure 1—figure supplement 2.
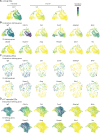
Figure 1—figure supplement 2.. Selection of coronary vascular endothelial cells (ECs) from e12 and e17.5 datasets.
(A and B) Uniform Manifold Approximation and Projections (UMAPs) showing expression of selected EC subtype markers in e12 ECs (A) and e17.5 ECs (B). (C and D) Breakdown of cell types as percentage of total cells in e12 (C) and e17.5 (D). (E and F) UMAPs showing the cells that were used for the analysis of e12 coronary ECs in Figure 1C (E) and for the analysis of e17.5 coronary ECs in Figure 1F (F). Scale bar from (A) also applies to (B).
Figure 1—figure supplement 3.
Figure 1—figure supplement 3.. Coronary endothelial cell (EC) subtype markers.
(A, B, and C) Uniform Manifold Approximation and Projections (UMAPs) showing expression of selected coronary EC subtype markers in coronary ECs at e12 (A), e17.5 (B) and adult (C). Scale bar from (C) also applies to (A) and (B).
Figure 1—figure supplement 4.
Figure 1—figure supplement 4.. Cell cycle regression in e17.5 coronary endothelial cells (ECs).
(A) Uniform Manifold Approximation and Projection (UMAP) showing unbiased clustering of e17.5 mouse coronary ECs before the removal of cycling cells. (B) UMAP showing unbiased clustering of e17.5 mouse coronary ECs from (A) after cell cycle regression was performed. (C) Post-regression UMAP from (B) showing the cycling cells which were in the cycling cluster in (A). (D) Breakdown of endocardium (Endo)- and sinus venosus (SV)-enriched cells from (B) by cluster. (E) Breakdown of the capillary clusters in (B) into cells that are cycling or non-cycling.
Figure 1—figure supplement 5.
Figure 1—figure supplement 5.. Expression of marker genes adult mouse coronary endothelial cell (EC) dataset.
(A) Uniform Manifold Approximation and Projections (UMAPs) showing expression of selected coronary EC subtype markers in the adult coronary EC dataset from Figure 1.
Figure 2.
Figure 2.. Expression of endocardium (Endo) and sinus venosus (SV) genes in coronary endothelial cells (ECs).
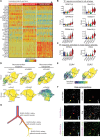
(A) Heatmap showing expression of the top 30 (by p-value) Endo-defining genes (enriched in the Endo compared to the SV) and the top 30 (by p-value) SV-defining genes (enriched in the SV compared to the Endo) in e12 and e17.5 capillary clusters (E = coronary cells from the Endo-enriched sample, S = coronary cells from the SV-enriched sample). (B and C) Venn diagrams showing overlap of Endo- and SV-defining genes with Cap1-enriched genes (enriched in Cap1 compared to Cap2) and e12 Cap2-enriched genes (enriched in Cap2 compared to Cap1) at e12 (B) and e17.5 (C). (D) Venn diagram showing overlap of e12 Cap1- and Cap2-enriched genes with e17.5 Cap1 and Cap2 genes. (E and F) Heatmaps of Pearson correlations based on expression of Endo- and SV-defining genes in the Endo, the SV, and capillary clusters from e12 and e17.5 in total (E) and separated by BmxCreER lineage as indicated by tdTomato (td) expression (F). (G) Bar plot showing number of differentially expressed genes (DEGs) between different subgroups of capillary cells.
Figure 2—figure supplement 1.
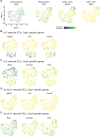
Figure 2—figure supplement 1.. Expression of selected endocardium (Endo)- and sinus venosus (SV)-defining genes.
(A) Uniform Manifold Approximation and Projection (UMAP) showing expression of canonical Endo (Cdh11) and SV (Vwf, Bmp4) markers in heart endothelial cells (ECs) at e12. (B, C, and D) Expression of genes enriched in either the Endo (Endo-defining genes) or the SV (SV-defining genes) in all e12 ECs (B), e12 coronary plexus ECs (C), and e17.5 coronary ECs (D). Scale bar from (A) also applies to (B), (C), and (D).
Figure 2—figure supplement 2.
Figure 2—figure supplement 2.. Expression of e12 Cap1- and Cap2-specific genes in a dataset of e12.5 sinus venosus (SV)-derived endothelial cells (ECs).
(A) Uniform Manifold Approximation and Projection (UMAP) showing expression of selected coronary EC subtype markers in a previously published dataset. (B and C) Expression in e12 dataset of genes enriched in e12 Cap1 (B) or Cap2 (C). (D and E) Expression in Su et al. dataset of genes enriched in e12 Cap1 (D) or Cap2 (E). Scale bar from (A) also applies to (B), (C), (D), and (E).
Figure 3.
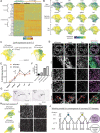
Figure 3.. Gene expression and localization of e17.5 capillary clusters.
(A) Heatmap showing expression of selected genes enriched in either Cap1 or Cap2 at e17.5 (E = coronary cells from endocardium [Endo]-enriched sample, S = coronary cells from sinus venosus [SV]-enriched sample). (B) Uniform Manifold Approximation and Projections (UMAPs) showing expression of selected flow-induced, hypoxia-induced, and tip-cell genes. Dashed lines outline indicated clusters. (C) Car4 UMAPs separated by lineage. Dashed line shows area of UMAP enriched in Endo-enriched, Car4-negative cells predicted to be located in the septum. (D) Immunofluorescence of Car4 and Erg in a heart section from an e17.5 BmxCreER;RosatdTomato embryo (scale bar = 500 μm). Red arrows indicate Car4-positive, tdTomato-positive Endo-derived ECs in the dorsal wall. (E) Plot showing percentage of tdTomato-positive and tdTomato-negative endothelial cells (ECs) in different locations which are also Car4-positive based on quantification of Car4 staining in Erg-positive cells from three e17.5 BmxCreER;RosatdTomato embryos (error bars = range). (F) Bar plot based on e17.5 scRNAseq showing the percent of capillary cells in different categories (septum Endo-enriched, septum SV-enriched, non-septum Endo-enriched, non-septum SV-enriched) which express Car4 at any level. (G) Images showing in situ hybridization for Kcne3 in an e14.5 embryonic mouse heart, obtained and adapted from GenePaint (set ID EH3746). (H) UMAPs showing expression of Car4 in adult coronary ECs, separated by lineage. (I) Immunofluorescence of Car4 and Erg in the left ventricle (LV) and septum of an adult wild-type (WT) heart (scale bar = 100 μm). (J) Working hypothesis for convergence of Endo- and SV-derived ECs into equivalent transcriptional states. Scale bar from (B) also applies to (C), (G), and (H).
Figure 3—figure supplement 1.
Figure 3—figure supplement 1.. Expression of flow-induced genes.
(A) Uniform Manifold Approximation and Projections (UMAPs) showing expression of selected flow-induced genes from Kumar et al., 2014, in e17.5 coronary endothelial cells (ECs). (B) Quantification of Car4 staining in Erg-positive cells from three e17.5 BmxCreER;RosatdTomato embryos (error bars = SD). Red dashed lines outline the putative septal cells as determined in Figure 3C.
Figure 3—figure supplement 2.
Figure 3—figure supplement 2.. Expression of endocardium (Endo)- and sinus venosus (SV)-defining genes at e17.5.
(A) Uniform Manifold Approximation and Projections (UMAPs) showing expression of Endo-enriched genes manually determined to be expressed in a higher percentage of proposed septum cells (as shown in Figure 3C) than non-septum cells. (B) UMAPs showing expression of selected Endo-enriched genes split by lineage. Bar plots show the percent of capillary cells in different categories (septum Endo-enriched, septum SV-enriched, non-septum Endo-enriched, non-septum SV-enriched) which express each gene at any level. (C) UMAPs showing expression of SV-enriched genes manually determined to be expressed in a higher percentage of non-septum cells than septum cells. (D) UMAPs showing expression of SV-enriched genes manually determined to be expressed in a higher percentage of Cap2 cells compared to Cap1 cells. Starred genes are significantly differentially expressed between e17.5 Cap1 and Cap2, as indicated in Figure 2C. Scale bar from (B) also applies to (A), (C), and (D).
Figure 4.
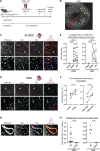
Figure 4.. Comparison of injury responses of endocardium (Endo)- and sinus venosus (SV)-derived coronary endothelial cells (ECs).
(A) Overview of lineage tracing and ischemia-reperfusion (I/R) injury approach in adult mice. (B) Example of how EdU localization highlights mid-myocardial injury region. Yellow arrowheads indicate the injury region with dense EdU staining. (C and D) Immunofluorescence of EdU and Erg in sections of the heart from (B) just below level of the stitch (C) and in the apex (D). Yellow arrowheads show proliferating Endo-derived ECs that are positive for tdTomato, Erg, and EdU; white arrowheads show tdTomato-negative, Erg-positive ECs from the SV that are EdU positive. (E) Quantification in multiple injured hearts of EdU-positive, Erg-positive ECs from the two lineages. (F) Quantification in multiple injured hearts of EdU-positive, Erg-positive ECs from the inner and outer wall, both in the focal area of the injury, as indicated in (B), and in areas adjacent to the injury. (G) Immunofluorescence of EdU and Erg in an artery of an injured heart. Pink arrowheads show proliferating ECs that are positive for tdTomato, Erg, and EdU. (H) Quantification in multiple injured hearts of EdU-positive, Erg-positive ECs in arteries in the focal area of the injury. In (E), (F), and (H), each dot represents one heart. Scale bar = 50 μm for (G). Scale bars = 500 μm for all other images.
Figure 5.
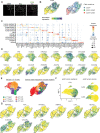
Figure 5.. Single-cell RNA sequencing (ScRNAseq) of coronary endothelial cells (ECs) from human fetal hearts.
(A) Overview of scRNAseq approach for three human fetal hearts. (B and C) Uniform Manifold Approximation and Projections (UMAPs) of all major PECAM1+ EC subtypes collected (B) and the non-cycling coronary EC subset (C). (D) Pie charts showing the breakdown by cluster of human coronary ECs that were sorted as PECAM1+ without additional enrichment. (E) Schematic of inter-species reference mapping. Individual cells from the human or mouse e17.5 datasets were assigned to the most similar mouse or human cluster, respectively. (F and G) Results from inter-species reference mapping based on shared gene expression, showing the mouse cluster that each human EC mapped to and the percentage breakdown of the mapping from each human cluster (F) and the converse comparison (G). Dashed lines show the borders of the previously defined human and mouse e17.5 coronary clusters. (H) UMAPs showing expression of selected flow-induced, hypoxia-induced and tip-cell genes in human coronary ECs. (I) UMAP showing expression of TINAGL1 in human coronary ECs. Scale bar from (I) also applies to (H). (J) Section from 18-week human fetal heart showing in situ hybridization for TINAGL1 with immunofluorescence for Erg. Scale bar = 50 μm. (K) Bar plot showing the mean number of TINAGL1 RNA spots per cell detected in different regions of 18- and 20-week human fetal hearts. Error bars represent standard deviation.
Figure 5—figure supplement 1.
Figure 5—figure supplement 1.. Additional analysis of developing human coronary endothelial cells (ECs).
(A) Immunofluorescence for CD36 and Erg in a section from a 14-week human fetal heart. (B) Uniform Manifold Approximation and Projections (UMAPs) showing expression of CD36 in human coronary ECs as well as cells colored according to fluorescence-activated cell sorting (FACS) sample, that is, PECAM1+ only, PECAM1+ CD36+, PECAM1+ CD36-, as indicated in Figure 5A. Dashed lines show the borders of the previously defined human coronary clusters. (C) Dot plot showing the expression of selected gene markers for each human EC cluster from Figure 5B. (D) UMAPs showing expression of selected genes with shared expression patterns between mouse e17.5 and human fetal capillary ECs. (E) UMAPs showing mouse e17.5 coronary EC clusters including a manually defined septum cluster as shown in Figure 3C, and the fetal human coronary ECs which map to each of these clusters. (F) UMAPs showing expression of selected capillary and artery genes in adult human coronary ECs from a previously published dataset (Litviňuková et al., 2020). (G) UMAPs showing expression of selected genes shared between human Cap1 and Art3 or between human Cap2 and Art2. Scale bar from (B) also applies to (D), (F), and (G).
Figure 5—figure supplement 2.
Figure 5—figure supplement 2.. Analysis of developing human coronary endothelial cells (ECs) separated by stage.
(A) Uniform Manifold Approximation and Projections (UMAPs) showing unbiased clustering of cells isolated from each individual human fetal heart. (B) Trajectory analysis of human coronary EC at each individual stage using RNA velocity, partition-based graph abstraction (PAGA), Slingshot, and Monocle.
Figure 6.
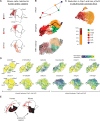
Figure 6.. Trajectory analysis of developing human coronary arteries.
(A) Reference mapping showed that e17.5 mouse endothelial cells (ECs) from Figure 5g were assigned to all three human artery subsets. (B) Trajectory analysis of human coronary ECs using partition-based graph abstraction (PAGA), Slingshot, and RNA velocity suggested that artery ECs are formed by capillary EC differentiation, as in mice. (C) Reference mapping adult human coronary ECs from a publicly available dataset to human fetal ECs showed that most mature cells match to Art1, Art2, or Cap2. (D) Uniform Manifold Approximation and Projections (UMAPs) showing expression of selected genes shared between hCap1 and hArt3 and hCap2 and hArt2, in both human and mouse. Previously defined clusters are outlined. (E) Schematic illustrating enrichment of septum ECs in mouse Cap1 and human Cap1 and Art3, as well as trajectories from capillary to artery in both human and mouse.
Figure 7.
Figure 7.. Gene expression in developing human coronary arteries.
(A) Heatmap showing expression of selected genes enriched in human artery clusters. (B and C) Regulon scores from SCENIC analysis for TFs enriched in all human and mouse artery clusters (B) and for TFs enriched in human and mouse Art1 (C). (D) Human, but not mouse, developing coronary arteries expressed neurotransmitter receptors and their transporter. (E) GJA4 and GJA5 expression in human coronary endothelial cells (ECs). (F) Serial sections from 18-week human fetal heart showing in situ hybridization for the indicated mRNAs with immunofluorescence for the indicated proteins.
Author response image 1.
Author response image 1.. .
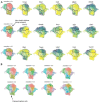
(A) UMAP plots showing clustering of e17.5 dataset at multiple resolutions up to 0.6 as well as expression of the top 5 DEGs (by average log-fold change) between newly divided clusters. The clusters being compared for each resolution are indicated with a dashed line. (B) UMAP plots showing clustering of e17.5 dataset at multiple resolutions up to 1.1. The dashed line indicates the region of proposed septal cells based on lineage, protein staining and gene expression.
Author response image 2.

References

    1. ACOG ACOG practice bulletin no. 107: Induction of labor. Obstetrics and Gynecology. 2009;114:386–397. doi: 10.1097/AOG.0b013e3181b48ef5. - DOI - PubMed
    1. Aibar S, González-Blas CB, Moerman T, Huynh-Thu VA, Imrichova H, Hulselmans G, Rambow F, Marine JC, Geurts P, Aerts J, van den Oord J, Atak ZK, Wouters J, Aerts S. SCENIC: single-cell regulatory network inference and clustering. Nature Methods. 2017;14:1083–1086. doi: 10.1038/nmeth.4463. - DOI - PMC - PubMed
    1. Arita Y, Nakaoka Y, Matsunaga T, Kidoya H, Yamamizu K, Arima Y, Kataoka-Hashimoto T, Ikeoka K, Yasui T, Masaki T, Yamamoto K, Higuchi K, Park JS, Shirai M, Nishiyama K, Yamagishi H, Otsu K, Kurihara H, Minami T, Yamauchi-Takihara K, Koh GY, Mochizuki N, Takakura N, Sakata Y, Yamashita JK, Komuro I. Myocardium-derived angiopoietin-1 is essential for coronary vein formation in the developing heart. Nature Communications. 2014;5:4552. doi: 10.1038/ncomms5552. - DOI - PMC - PubMed
    1. Asp M, Giacomello S, Larsson L, Wu C, Fürth D, Qian X, Wärdell E, Custodio J, Reimegård J, Salmén F, Österholm C, Ståhl PL, Sundström E, Åkesson E, Bergmann O, Bienko M, Månsson-Broberg A, Nilsson M, Sylvén C, Lundeberg J. A spatiotemporal organ-wide gene expression and cell atlas of the developing human heart. Cell. 2019;179:1647–1660. doi: 10.1016/j.cell.2019.11.025. - DOI - PubMed
    1. Becht E, McInnes L, Healy J, Dutertre CA, Kwok IWH, Ng LG, Ginhoux F, Newell EW. Dimensionality reduction for visualizing single-cell data using UMAP. Nature Biotechnology. 2018;37:38–44. doi: 10.1038/nbt.4314. - DOI - PubMed

Publication types