. 2021 Dec 15;17(12):e1010132.
doi: 10.1371/journal.ppat.1010132. eCollection 2021 Dec.

Infection-induced chromatin modifications facilitate translocation of herpes simplex virus capsids to the inner nuclear membrane

Affiliations

Infection-induced chromatin modifications facilitate translocation of herpes simplex virus capsids to the inner nuclear membrane

Vesa Aho et al. PLoS Pathog. .

Abstract

Herpes simplex virus capsids are assembled and packaged in the nucleus and move by diffusion through the nucleoplasm to the nuclear envelope for egress. Analyzing their motion provides conclusions not only on capsid transport but also on the properties of the nuclear environment during infection. We utilized live-cell imaging and single-particle tracking to characterize capsid motion relative to the host chromatin. The data indicate that as the chromatin was marginalized toward the nuclear envelope it presented a restrictive barrier to the capsids. However, later in infection this barrier became more permissive and the probability of capsids to enter the chromatin increased. Thus, although chromatin marginalization initially restricted capsid transport to the nuclear envelope, a structural reorganization of the chromatin counteracted that to promote capsid transport later. Analyses of capsid motion revealed that it was subdiffusive, and that the diffusion coefficients were lower in the chromatin than in regions lacking chromatin. In addition, the diffusion coefficient in both regions increased during infection. Throughout the infection, the capsids were never enriched at the nuclear envelope, which suggests that instead of nuclear export the transport through the chromatin is the rate-limiting step for the nuclear egress of capsids. This provides motivation for further studies by validating the importance of intranuclear transport to the life cycle of HSV-1.


Conflict of interest statement

The authors have declared that no competing interests exist.

Figures
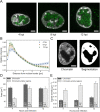
Fig 1
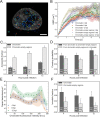
Fig 1. Capsids are concentrated in the chromatin-empty regions that grow during the infection.
(A) Spinning disk microscopy images of capsid distribution in Vero cells at 4, 8 and 12 hpi. Overlays of Hoechst-labeled chromatin (gray) and fluorescent capsid protein VP26-mCherry (green) are shown. (B) The mean relative intensity of Hoechst-stained nuclear chromatin as a function of the distance from the nuclear envelope at 4 (blue), 8 (orange) and 12 hpi (green). The shaded areas around the data points represent the SEM. (C) Hoechst-stained chromatin (gray) in an infected cell nucleus at 8 hpi and its automatic segmentation into chromatin (white) and chromatin-empty regions (black). (D) The mean area of segmented chromatin (dark gray) and chromatin-empty regions (light gray) and (E) the mean density of capsids in chromatin and chromatin-empty regions. The error bars show the SEM. Statistical significances were determined using Student’s t-test. The significance values shown inside the bars are denoted as ** (p<0.01), * (p<0.05) or ns (not significant). The number after the significance symbol indicates the infection time point that the value was compared with. Values were compared for the same region at different time points (indicated by a different time code than the time point of the bar) and for the different regions only within each time point (indicated by the same time code as the time point of the bar). For every time point the sample size was 28 cells. The scale bars represent 5 μm.
Fig 2
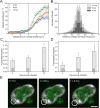
Fig 2. Capsid dynamics depend on the chromatin environment and on the infection phase.
(A) Capsid tracks during 10 seconds in an HSV-1 infected cell. Only tracks that were at least 5 frames (0.5 s) long are shown. Cytoplasmic tracks are also shown, but they were excluded from the analyses. The stained chromatin is shown in gray. (B) The mean squared displacement (MSD) of nuclear capsids in chromatin and chromatin-empty regions as a function of time. (C) The mean fraction of chromatin and chromatin-empty regions visited by capsids during 40 s. (D) The mean probability of a capsid starting on one side of the border of chromatin regions to move to the other side of a border during a capsid track. (E) The mean number of capsids detected in chromatin during 40 s as a function of chromatin density. The number of detections was normalized by the size of the detection area. (F) The ratio of immobile particles to the number of all particles in chromatin and chromatin-empty regions. The shaded areas around the data points and the error bars show the SEM. Statistical significances were determined using Student’s t-test. The significance values shown inside the bars are denoted as ** (p<0.01), * (p<0.05) or ns (not significant). The number after the significance symbol indicates the infection time point that the value was compared with. Values were compared for the same region at different time points (indicated by a different time code than the time point of the bar) and for the different regions only within each time point (indicated by the same time code as the time point of the bar). For every time point the sample size was 28 cells. The scale bar represents 5 μm.
Fig 3
Fig 3. Capsids do not accumulate at the nuclear envelope.
(A) The mean density of capsids as a function of distance from the nuclear envelope summed over the time series. The negative x-axis values show the distance to the cytoplasmic side and positive x-axis values the distance to the nucleoplasmic side of the nuclear border. (B) The change in the shortest distance to the nuclear border during a capsid track. On the positive x-axis the capsid moves away from the nuclear border during a track and on the negative x-axis toward it. (C) The fraction of the area within 1 μm from the outer edge of the chromatin visited by capsids during 40 s. (D) The mean number of capsids that translocated from within the chromatin to outside of it at the edge of the nucleus. (E) An image series showing a capsid approaching the edge of the chromatin at the border of the nucleus and passing through it. The error bars show the SEM. The significance values shown inside the bars are denoted as ** (p<0.01), * (p<0.05) or ns (not significant). The number after the significance symbol indicates the infection time point that the value was compared with. For every time point the sample size was 28 cells. The scale bar represents 5 μm.
Fig 4
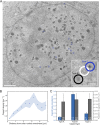
Fig 4. The capsid type does not affect its ability to traverse marginalized chromatin.
(A) A transmission electron microscope image of a cell infected 12 h prior to sample fixation. The capsids have been labeled as type A (empty capsids, marked with white circles), type B (capsids containing the protein scaffold, black circles) and type C (DNA-containing nucleocapsids, blue circles). The area marked with a white square is magnified at the lower right corner of the image, showing each of the capsid types. The scale bar represents 2 μm (200 nm in the magnified region). (B) The combined density of every capsid type as a function of the distance from the outer nuclear membrane. (C) The number of each capsid type divided by the number of all capsids (blue), and the fraction of each capsid type that is located within 1 μm from the nuclear envelope (gray). The shaded regions and error bars show the standard error of the mean. The significance values shown inside the bars are denoted as ** (p<0.01), * (p<0.05) or ns (not significant). The letter after the significance symbol indicates the capsid type that the value was compared with. The sample size was N = 11 cells.

References

    1. Schrag JD, Prasad BVV, Rixon FJ, Chiu W. Three-dimensional structure of the HSV1 nucleocapsid. Cell. 1989;56(4):651–60. doi: 10.1016/0092-8674(89)90587-4 - DOI - PubMed
    1. Brandariz-Nuñez A, Liu T, Du T, Evilevitch A. Pressure-driven release of viral genome into a host nucleus is a mechanism leading to herpes infection. eLife. 2019;8:e47212. doi: 10.7554/eLife.47212 - DOI - PMC - PubMed
    1. Ojala PM, Sodeik B, Ebersold MW, Kutay U, Helenius A. Herpes Simplex Virus Type 1 Entry into Host Cells: Reconstitution of Capsid Binding and Uncoating at the Nuclear Pore Complex In Vitro. Molecular and Cellular Biology. 2000;20(13):4922–31. doi: 10.1128/MCB.20.13.4922-4931.2000 - DOI - PMC - PubMed
    1. Sekine E, Schmidt N, Gaboriau D, O’Hare P. Spatiotemporal dynamics of HSV genome nuclear entry and compaction state transitions using bioorthogonal chemistry and super-resolution microscopy. PLoS pathogens. 2017;13(11):e1006721. doi: 10.1371/journal.ppat.1006721 - DOI - PMC - PubMed
    1. Sodeik B, Ebersold MW, Helenius A. Microtubule-Mediated Transport of Incoming Herpes Simplex Virus 1 Capsids to the Nucleus. The Journal of cell biology. 1997;136(5):1007–21. doi: 10.1083/jcb.136.5.1007 - DOI - PMC - PubMed

Publication types