. 2021 Dec 22;184(26):6229-6242.e18.
doi: 10.1016/j.cell.2021.11.026. Epub 2021 Nov 19.

Population impact of SARS-CoV-2 variants with enhanced transmissibility and/or partial immune escape

Affiliations

Population impact of SARS-CoV-2 variants with enhanced transmissibility and/or partial immune escape

Mary Bushman et al. Cell. .

Abstract

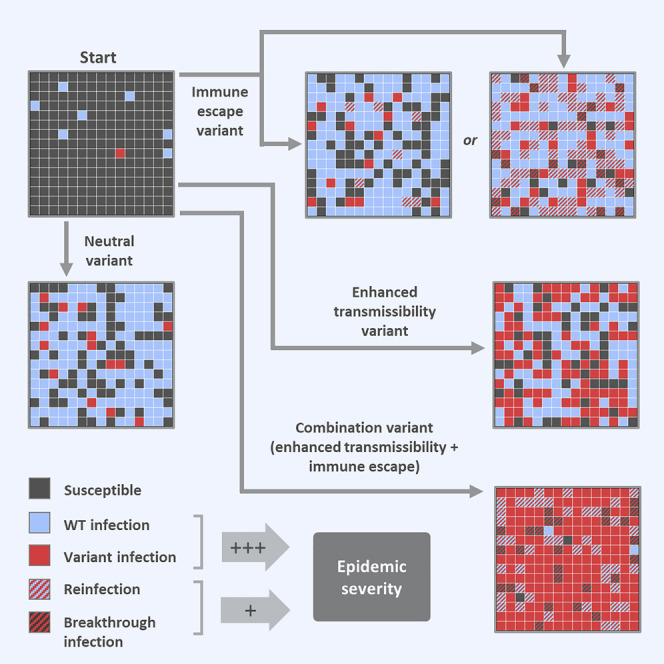
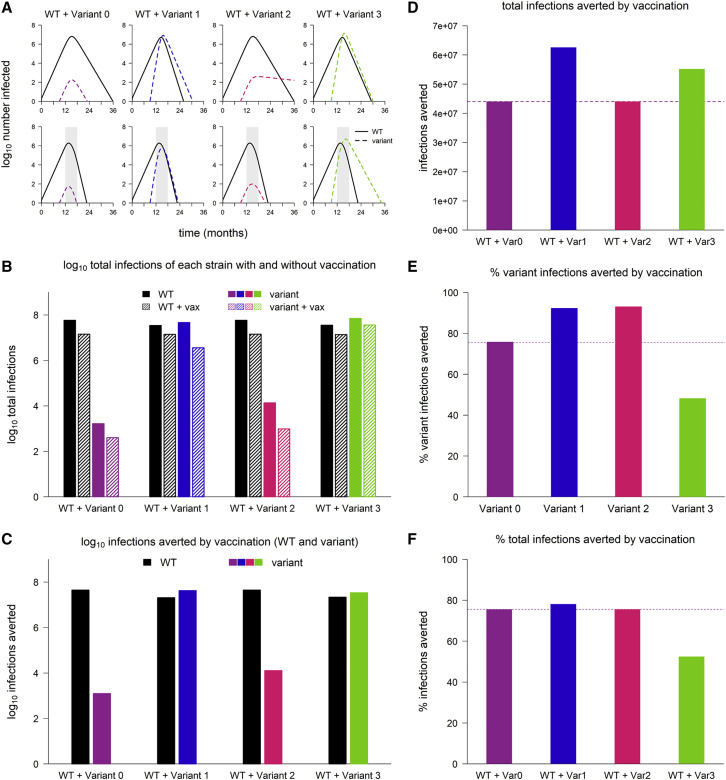
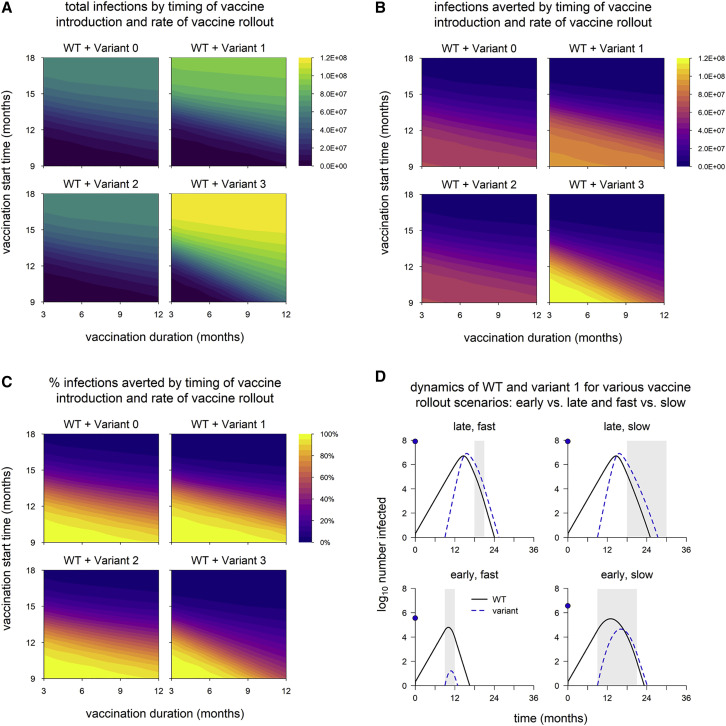
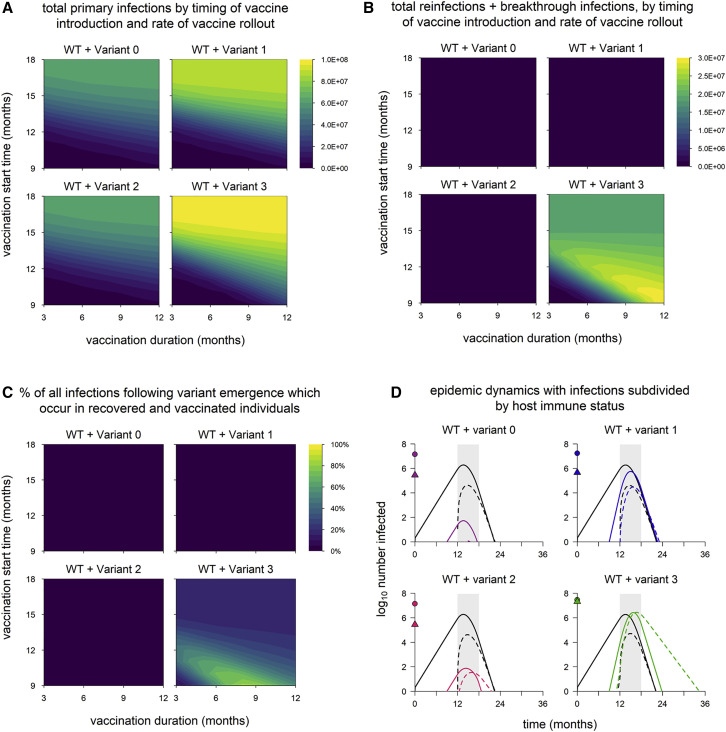
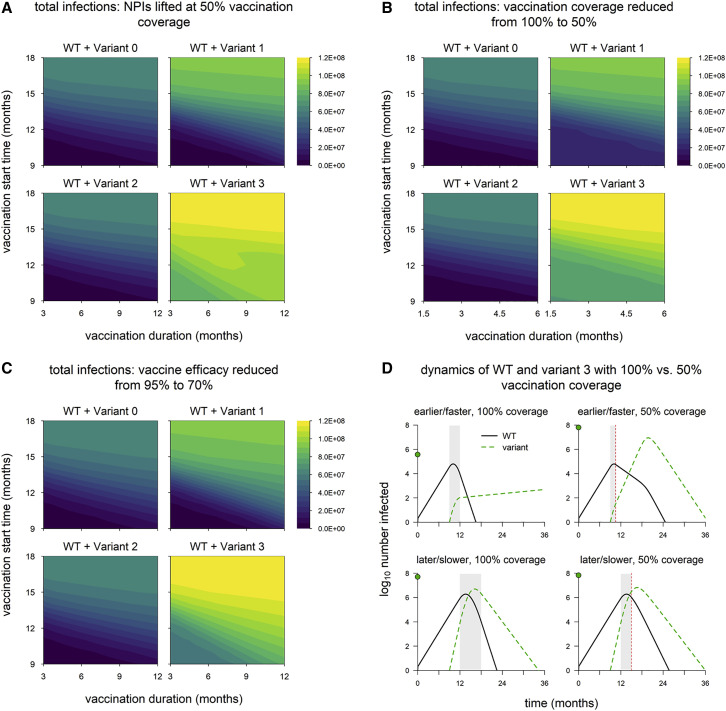
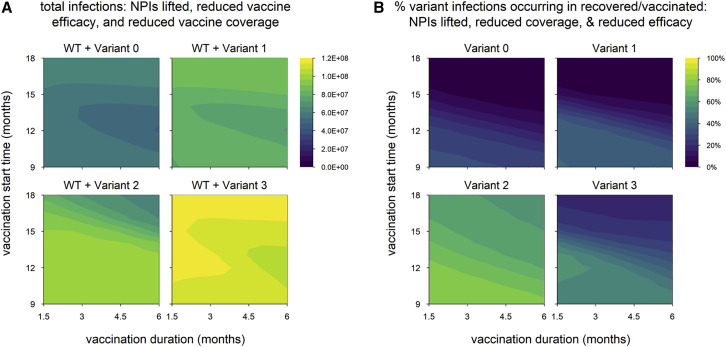
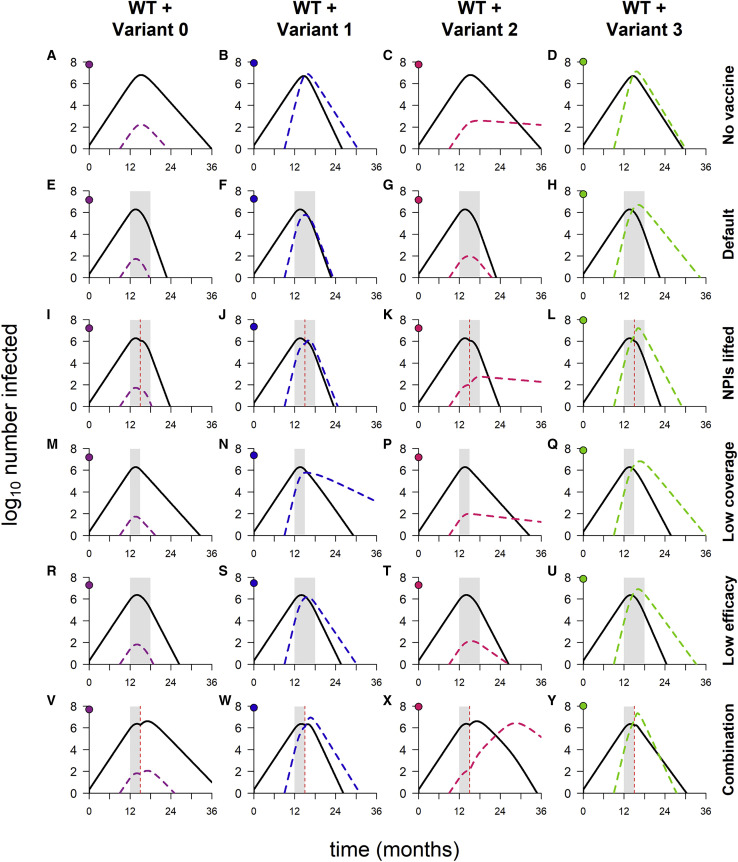
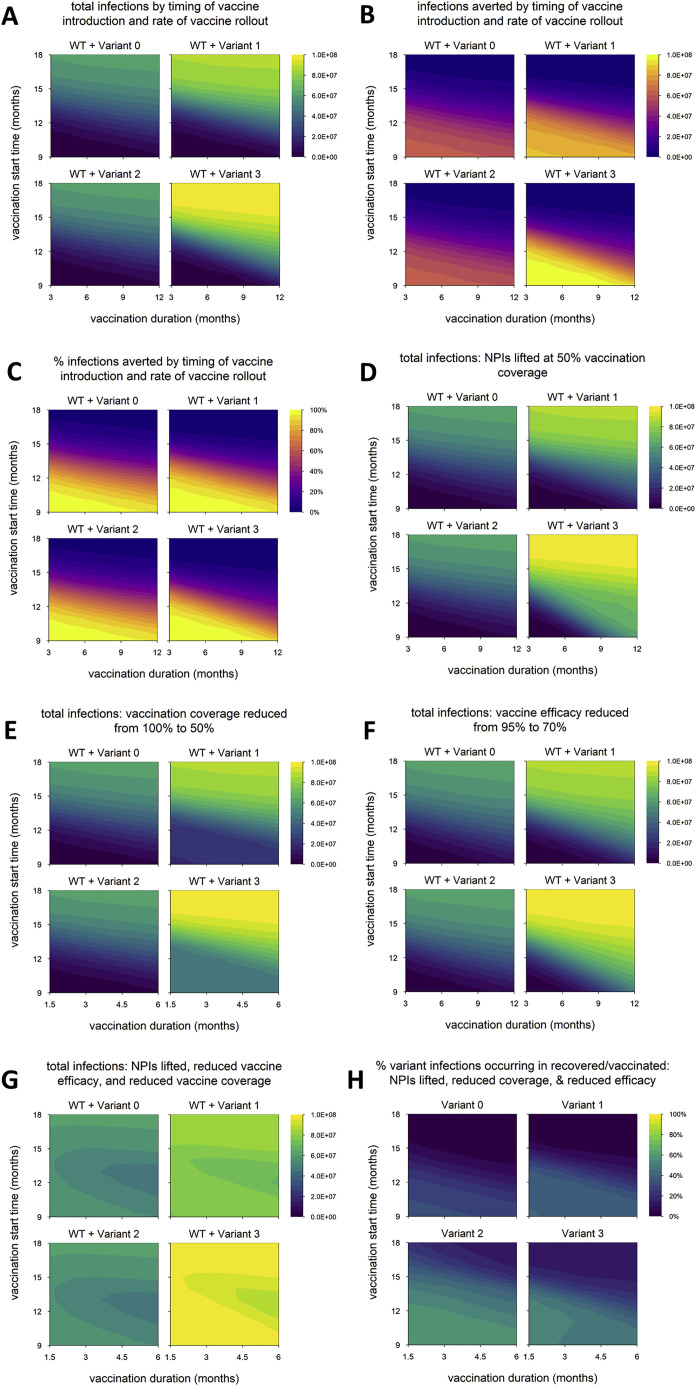
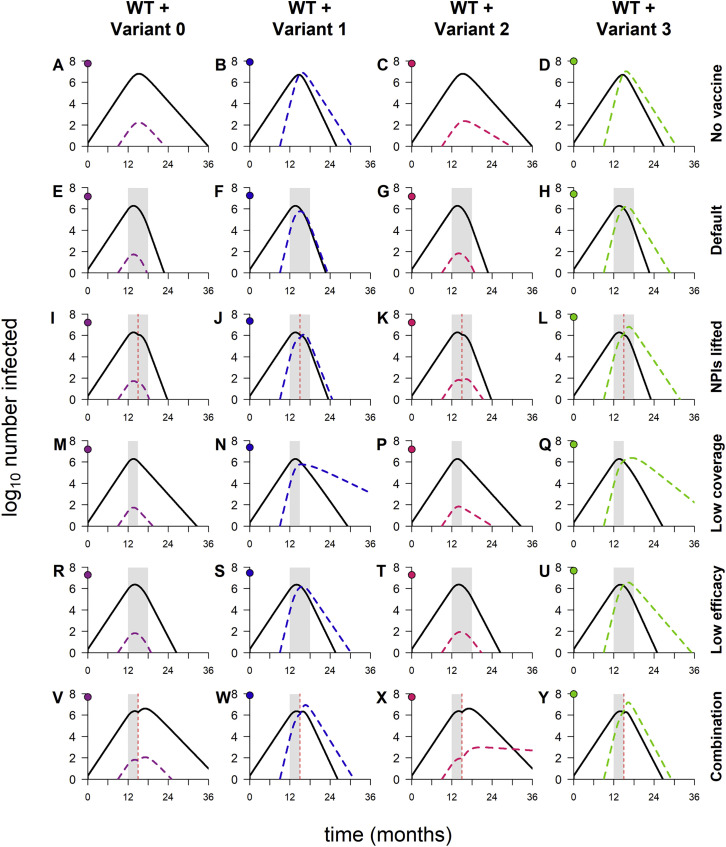
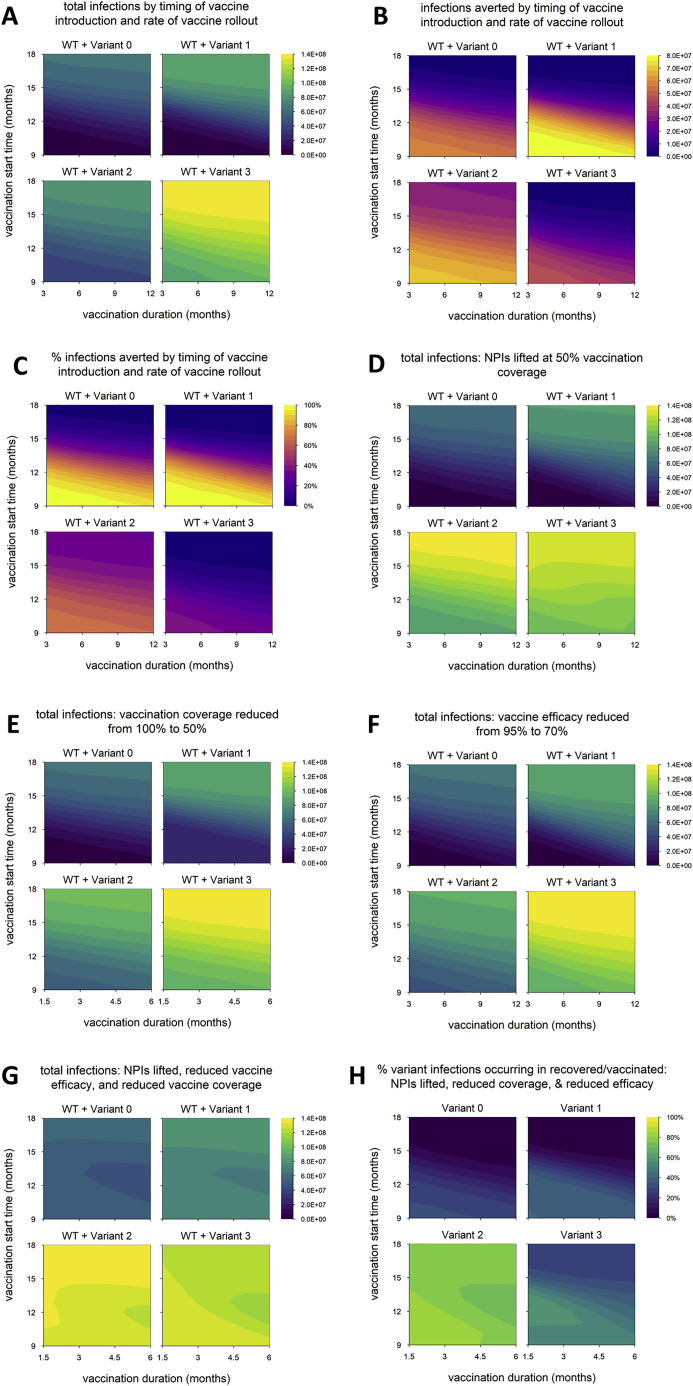
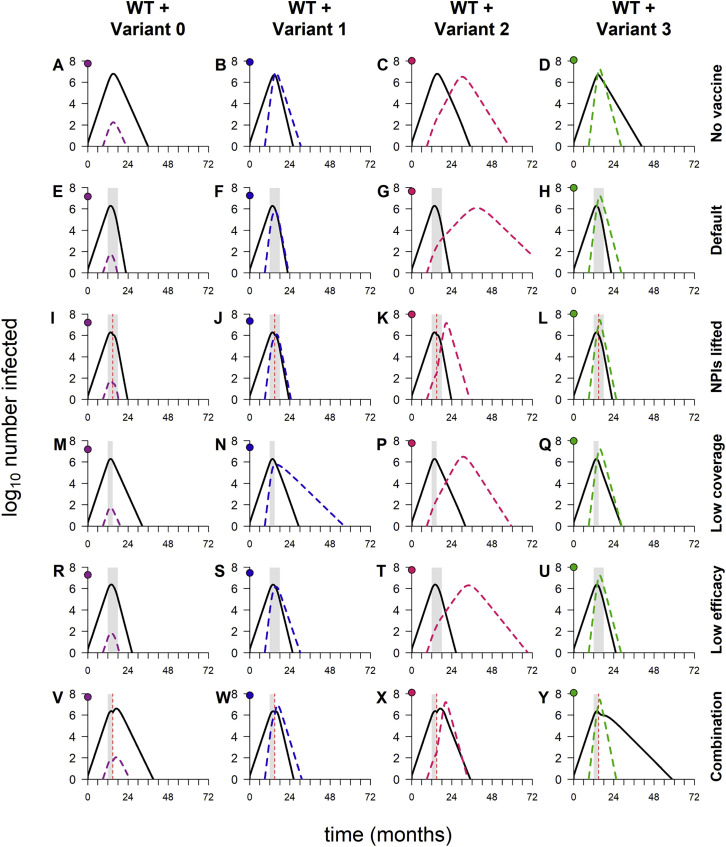
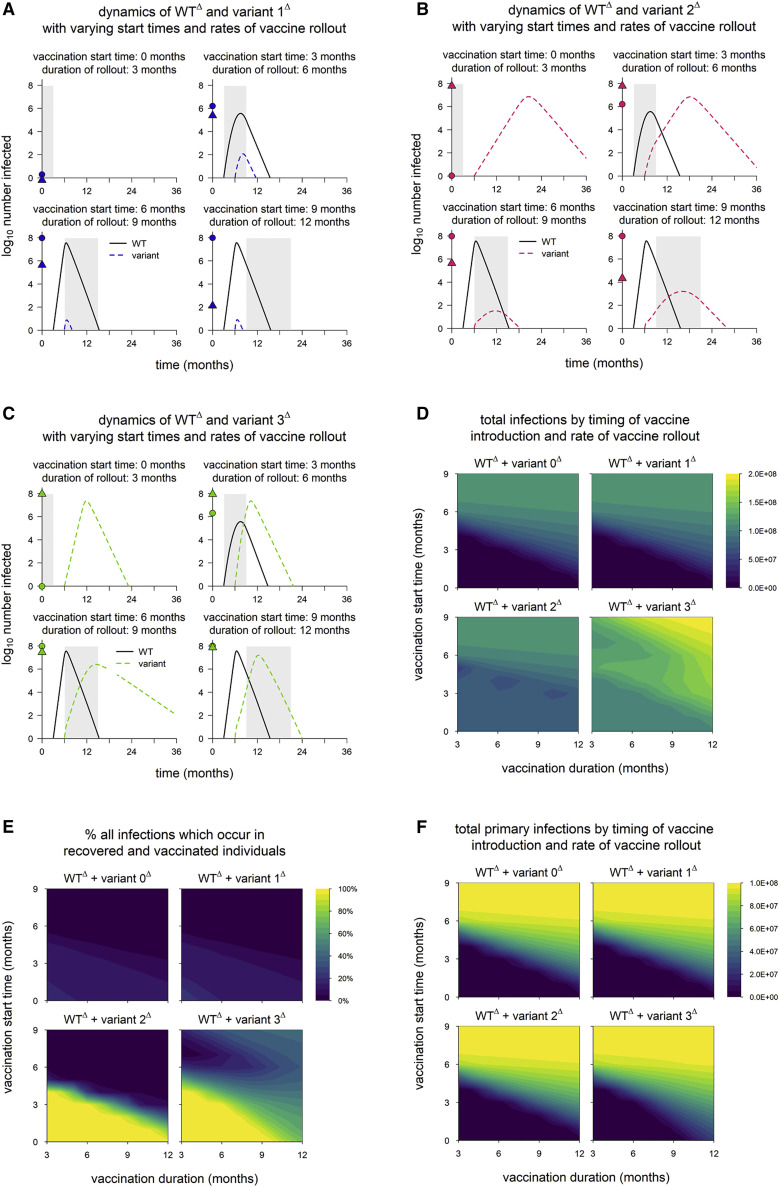
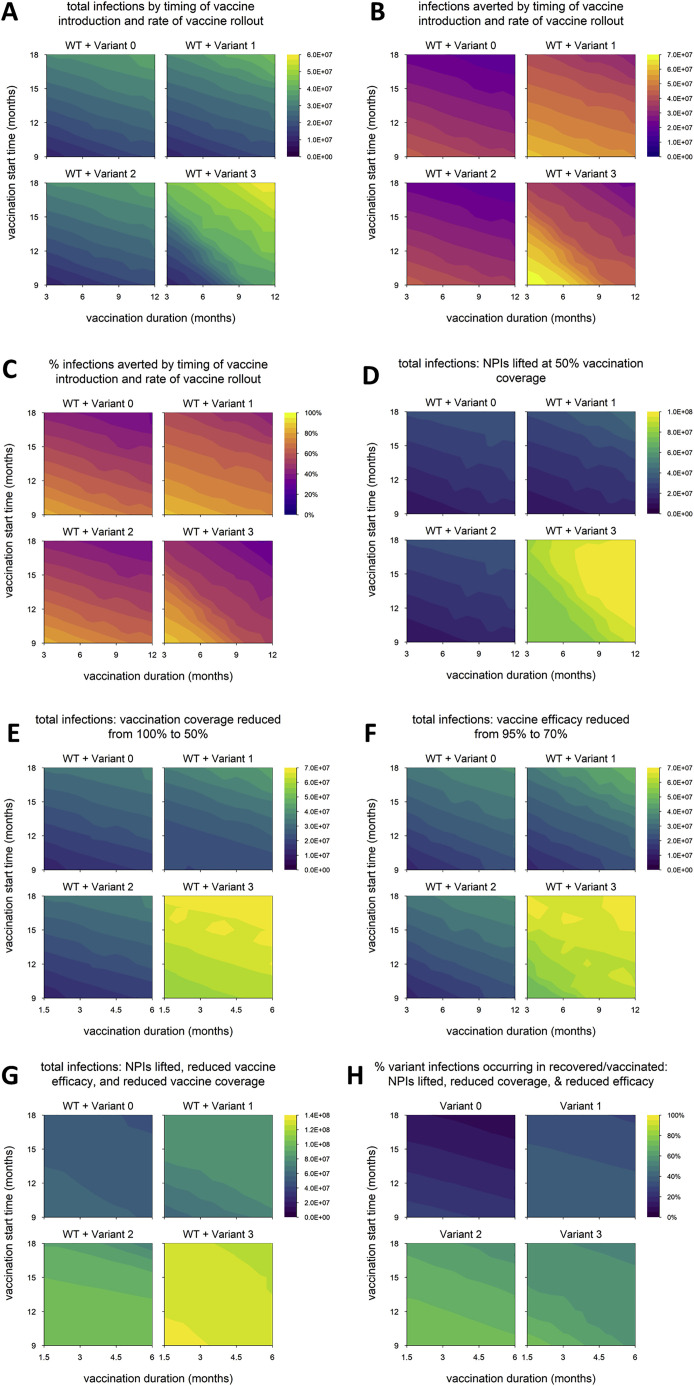
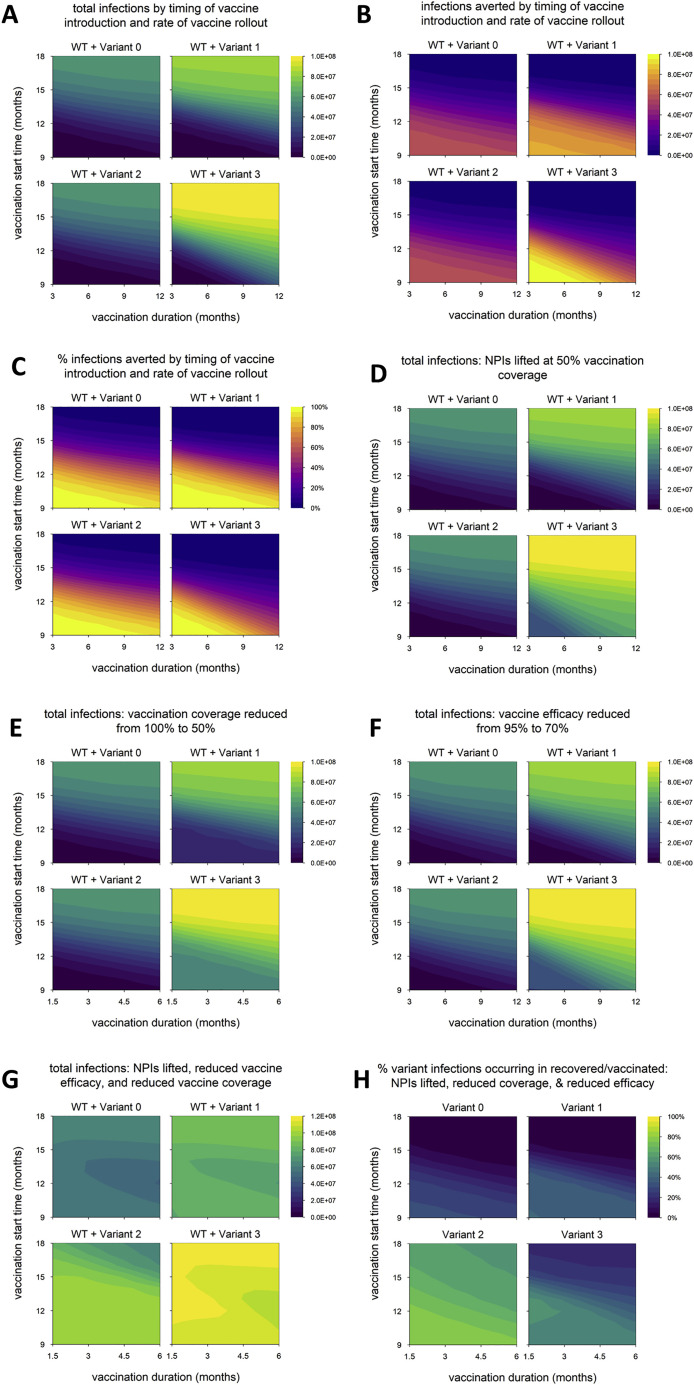
SARS-CoV-2 variants of concern exhibit varying degrees of transmissibility and, in some cases, escape from acquired immunity. Much effort has been devoted to measuring these phenotypes, but understanding their impact on the course of the pandemic-especially that of immune escape-has remained a challenge. Here, we use a mathematical model to simulate the dynamics of wild-type and variant strains of SARS-CoV-2 in the context of vaccine rollout and nonpharmaceutical interventions. We show that variants with enhanced transmissibility frequently increase epidemic severity, whereas those with partial immune escape either fail to spread widely or primarily cause reinfections and breakthrough infections. However, when these phenotypes are combined, a variant can continue spreading even as immunity builds up in the population, limiting the impact of vaccination and exacerbating the epidemic. These findings help explain the trajectories of past and present SARS-CoV-2 variants and may inform variant assessment and response in the future.

Keywords: COVID-19; NPI; SARS-CoV-2; VOC; immune escape; mathematical model; nonpharmaceutical interventions; transmissibility; vaccination; variant of concern.


Conflict of interest statement

Declaration of interests R.K. discloses consulting fees from Partners In Health and the Pan American Health Organization. M.L. received funding through his institution from the CDC, NIH, UK National Institute for Health Research, and Pfizer and consulting fees or honoraria from Merck, Sanofi Pasteur, Janssen, and Bristol Myers Squibb. He is a member of the Scientific Advisory Board for CEPI, the Coalition for Epidemic Preparedness Innovations. W.P.H. serves on the Advisory Board of Biobot Analytics and has received compensation for expert witness testimony on the course of the SARS-CoV-2 pandemic. M.L. and R.K. are on secondments from Harvard to the CDC. The opinions in this paper are those of the authors in their academic capacities and do not reflect those of any government entity.

Figures

None
Graphical abstract
Figure 1
Figure 1
Sample dynamics of hypothetical variants (A) Dynamics of WT and variant strains without vaccination (top row) and with vaccination (bottom row), shown on log scale. Solid/black lines, WT; dashed/colored lines, variants; gray shading, vaccine rollout. Subsequent panels reference the simulations in (A). (B) Total infections with WT and variants with and without vaccination (log scale). Black bars, WT; colored bars, variants; solid bars, without vaccination; hatched bars, with vaccination. (C) WT and variant infections averted by vaccination (log scale). Black bars, WT; colored bars, variants. (D) Total infections (WT + variant) averted by vaccination (linear scale). Dashed line, total infections averted in simulation with variant 0. (E) Percentage of variant infections averted by vaccination (linear scale). Dashed line, percentage averted in simulation with variant 0. (F) Percentage of all infections averted by vaccination (linear scale). Dashed line, percentage averted in simulation with variant 0. In all simulations, the variant is introduced at 9 months; in simulations with vaccination, vaccine rollout starts at 12 months and is spread over 6 months. Variant phenotypes are as follows: variant 0, identical to WT; variant 1, 60% greater transmissibility; variant 2, 40% immune escape; variant 3, 60% greater transmissibility and 40% immune escape.
Figure 2
Figure 2
Epidemic size and vaccination impact vary with the time of vaccine introduction and pace of vaccine rollout (A) Total infections (WT + variant) in simulations with each hypothetical variant, for varying rates of vaccination (duration, x axis) and time of vaccine introduction (start time, y axis); shaded contours represent total infections. (B) Number of infections averted by vaccination. (C) Percentage of infections averted by vaccination. Variant introduced at 9 months in all simulations. (D) Dynamics of WT and variant 1 in simulations with the minimum and maximum values for vaccination duration (fast = 3 months; slow = 12 months) and start time (early = 9 months; late = 18 months). In each panel, the point on the y axis indicates the total number of infections over the entire simulation. Solid/black line, WT; blue/dashed line, variant; gray shading, vaccine rollout. Variant phenotypes are as follows: variant 0, identical to WT; variant 1, 60% greater transmissibility; variant 2, 40% immune escape; variant 3, 60% greater transmissibility and 40% immune escape.
Figure 3
Figure 3
Breakdown of infections by immune status (primary infections versus reinfections/breakthrough infections) (A) Total primary infections. (B) Total infections in recovered and vaccinated individuals (reinfections and breakthrough infections). (C) Percentage of all infections occurring in recovered/vaccinated individuals (reinfections/breakthrough infections), starting from the time of variant emergence. Variant introduced at 9 months in all simulations. (D) Dynamics of WT and variants, stratified by host immune status (susceptible versus recovered/vaccinated). The points on the y axis indicate the total number of primary infections (circles) and reinfections/breakthrough infections (triangles). Black lines, WT; colored lines, variants; solid lines, primary infections; dashed lines, infections in recovered/vaccinated individuals; gray shading, vaccine rollout (starting at 12 months and lasting 6 months). Variant phenotypes are as follows: variant 0, identical to WT; variant 1, 60% greater transmissibility; variant 2, 40% immune escape; variant 3, 60% greater transmissibility and 40% immune escape.
Figure 4
Figure 4
Epidemic size in scenarios with reduced control measures (A) Total infections when nonpharmaceutical interventions (NPIs) are lifted once vaccination coverage reaches 50% (in default model, NPIs are maintained indefinitely). (B) Total infections with vaccination coverage reduced from 100% to 50%. (C) Total infections with vaccine efficacy against WT reduced from 95% to 70%. (D) Dynamics of WT and variant 3 with earlier/faster versus later/slower vaccine rollout and 100% vaccination coverage versus 50% coverage. Simulation conditions as follows: earlier/faster vaccine rollout = starting at 9 months and lasting 3 months (100% coverage) or 1.5 months (50% coverage); later/slower rollout = starting at 12 months and lasting 6 months (100% coverage) or 3 months (50% coverage). Solid/black line, WT; green/dashed line, variant; gray shading, vaccine rollout; dashed red line, 50% vaccination coverage. In each panel, the point on the y axis indicates the total number of infections over the entire simulation. Variant introduced at 9 months in all simulations. Variant phenotypes are as follows: variant 0, identical to WT; variant 1, 60% greater transmissibility; variant 2, 40% immune escape; variant 3, 60% greater transmissibility and 40% immune escape.
Figure 5
Figure 5
Scenario with multiple changes to control measures (vaccination coverage reduced to 50%, vaccine efficacy reduced to 70%, and NPIs lifted when 50% of the population is vaccinated) (A) Total infections. (B) Percentage of variant infections composed of reinfections and breakthrough infections. Variant introduced at 9 months in all simulations. Variant phenotypes are as follows: variant 0, identical to WT; variant 1, 60% greater transmissibility; variant 2, 40% immune escape; variant 3, 60% greater transmissibility and 40% immune escape.
Figure 6
Figure 6
Dynamics of WT and variants in simulations with varying combinations of control measures (A–D) No vaccination, but NPIs are in place throughout. (E–H) Default model conditions (NPIs in place throughout, 100% vaccination coverage, 95% vaccine efficacy against WT). (I–L) NPIs lifted when vaccination coverage reaches 50%. (M–Q) 50% vaccination coverage. (R–U) 70% vaccine efficacy. (V–Y) Combination of three conditions (50% vaccination coverage, 70% vaccine efficacy, and NPIs lifted when 50% of population vaccinated). In each panel, the point on the y axis indicates the log10 total number of infections. Variant introduced at 9 months in all simulations; in simulations with vaccination, the rollout begins at 12 months and lasts 6 months if final coverage is 100% and 3 months if final coverage is 50%. Solid/black lines, WT; colored/dashed lines, variants; gray shading, vaccine rollout; dashed vertical line, 50% population vaccinated. Variant phenotypes are as follows: variant 0, identical to WT; variant 1, 60% greater transmissibility; variant 2, 40% immune escape; variant 3, 60% greater transmissibility and 40% immune escape.
Figure S1
Figure S1
Epidemic outcomes for alternative model with lower degree of immune escape, related to Figures 2, 4, and 5 (A) Total infections (WT + variant) in simulations with each hypothetical variant, for varying rates of vaccination (vaccination duration, x axis) and time of vaccine introduction (vaccination start time, y axis); shaded contours represent total infections. (B) Number of infections averted by vaccination; shading represents number of infections averted. (C) Percentage of infections averted by vaccination; shading represents % infections averted. (D) Total infections with nonpharmaceutical interventions (NPIs) lifted when vaccination coverage reaches 50% (default condition is NPIs continued indefinitely). (E) Total infections with vaccination coverage reduced from 100% to 50%. (F) Total infections with baseline vaccine efficacy (against WT) reduced from 95% to 70%. (G) Total infections with the combination of conditions D through F (vaccination coverage reduced to 50%, vaccine efficacy reduced to 70%, and NPIs lifted when 50% of the population is vaccinated). Shading in panels D-G represents total infections. (H) Percentage of variant infections composed of reinfections and breakthrough infections under the combined conditions of panels D through F; shading represents percentage of variant infections occurring in recovered/vaccinated individuals. Variant introduced at 9 months in all simulations. Variant phenotypes are as follows: variant 0, identical to WT; variant 1, 60% greater transmissibility; variant 2, 20% immune escape; variant 3, 60% greater transmissibility and 20% immune escape.
Figure S2
Figure S2
Dynamics of WT and variants, in simulations with varying combinations of control measures, for alternative model with lower degree of immune escape, related to Figure 6 Dynamics of WT and variants in simulations with varying combinations of control measures. (A-D) No vaccination but NPIs in place throughout. (E-H) Default model conditions (NPIs in place throughout, 100% vaccination coverage, 95% vaccine efficacy against WT). (I-L) NPIs lifted when vaccination coverage reaches 50%. (M-Q) 50% vaccination coverage. (R-U) 70% vaccine efficacy. (V-Y) Combination of three conditions (50% vaccination coverage, 70% vaccine efficacy, and NPIs lifted when 50% of population vaccinated). In each panel, point on y axis indicates log10 total number of infections. Variant introduced at 9 months in all simulations; in simulations with vaccination, rollout begins at 12 months and lasts 6 months if final coverage is 100%, 3 months if final coverage is 50%. Solid/black lines, WT; colored/dashed lines, variants; gray shading, vaccine rollout; dashed vertical line, 50% population vaccinated. Variant phenotypes are as follows: variant 0, identical to WT; variant 1, 60% greater transmissibility; variant 2, 20% immune escape; variant 3, 60% greater transmissibility and 20% immune escape.
Figure S3
Figure S3
Epidemic outcomes for alternative model with higher degree of immune escape, related to Figures 2, 4, and 5 (A) Total infections (WT + variant) in simulations with each hypothetical variant, for varying rates of vaccination (vaccination duration, x axis) and time of vaccine introduction (vaccination start time, y axis); shaded contours represent total infections. (B) Number of infections averted by vaccination; shading represents number of infections averted. (C) Percentage of infections averted by vaccination; shading represents % infections averted. (D) Total infections with nonpharmaceutical interventions (NPIs) lifted when vaccination coverage reaches 50% (default condition is NPIs continued indefinitely). (E) Total infections with vaccination coverage reduced from 100% to 50%. (F) Total infections with baseline vaccine efficacy (against WT) reduced from 95% to 70%. (G) Total infections with the combination of conditions D through F (vaccination coverage reduced to 50%, vaccine efficacy reduced to 70%, and NPIs lifted when 50% of the population is vaccinated). Shading in panels D-G represents total infections. (H) Percentage of variant infections composed of reinfections and breakthrough infections under the combined conditions of panels D through F; shading represents percentage of variant infections occurring in recovered/vaccinated individuals. Variant introduced at 9 months in all simulations. Variant phenotypes are as follows: variant 0, identical to WT; variant 1, 60% greater transmissibility; variant 2, 80% immune escape; variant 3, 60% greater transmissibility and 80% immune escape.
Figure S4
Figure S4
Dynamics of WT and variants, in simulations with varying combinations of control measures, for alternative model with higher degree of immune escape, related to Figure 6 Dynamics of WT and variants in simulations with varying combinations of control measures. (A-D) No vaccination but NPIs in place throughout. (E-H) Default model conditions (NPIs in place throughout, 100% vaccination coverage, 95% vaccine efficacy against WT). (I-L) NPIs lifted when vaccination coverage reaches 50%. (M-Q) 50% vaccination coverage. (R-U) 70% vaccine efficacy. (V-Y) Combination of three conditions (50% vaccination coverage, 70% vaccine efficacy, and NPIs lifted when 50% of population vaccinated). In each panel, point on y axis indicates log10 total number of infections. Variant introduced at 9 months in all simulations; in simulations with vaccination, rollout begins at 12 months and lasts 6 months if final coverage is 100%, 3 months if final coverage is 50%. Solid/black lines, WT; colored/dashed lines, variants; gray shading, vaccine rollout; dashed vertical line, 50% population vaccinated. All simulations run for an extended duration of six years (default condition is three years); variant introduced at 9 months; in simulations with vaccination, rollout begins at 12 months and lasts 6 months if final coverage is 100%, 3 months if final coverage is 50%. Solid/black lines, WT; colored/dashed lines, variants; gray shading, vaccine rollout; dashed vertical line, 50% vaccination coverage. Variant phenotypes are as follows: variant 0, identical to WT; variant 1, 60% greater transmissibility; variant 2, 80% immune escape; variant 3, 60% greater transmissibility and 80% immune escape.
Figure 7
Figure 7
WTΔ and variantΔ dynamics in simulations with full control measures (A) Dynamics of WTΔ and variant 1Δ in simulations with different start times and rates of vaccine rollout. (B) Dynamics of WTΔ and variant 2Δ. (C) Dynamics of WTΔ and variant 3Δ. In (A)–(C), points on the y axis indicate the total numbers of primary infections (circles) and reinfections/breakthrough infections (triangles); gray shading indicates vaccine rollout. (D) Total infections in simulations with each hypothetical variant. (E) Percentage of all infections which occur in recovered/vaccinated individuals (reinfections and breakthrough infections). (F) Total number of primary infections. In all simulations, WTΔ and variantΔ are introduced at 3 and 6 months, respectively. Vaccine coverage and efficacy are assumed to be 100% and 95%, respectively, and NPIs are maintained throughout all simulations. WTΔ is assumed to have R0 = 6, and variantΔ phenotypes are as follows: variant 0Δ, identical to WTΔ; variant 1Δ, 60% greater transmissibility; variant 2Δ, 40% immune escape; variant 3Δ, 60% greater transmissibility and 40% immune escape.
Figure S5
Figure S5
Epidemic outcomes for alternative model with rolling lockdowns, related to Figures 2, 4, and 5 (A) Total infections (WT + variant) in simulations with each hypothetical variant, for varying rates of vaccination (vaccination duration, x axis) and time of vaccine introduction (vaccination start time, y axis); shaded contours represent total infections. (B) Number of infections averted by vaccination; shading represents number of infections averted. (C) Percentage of infections averted by vaccination; shading represents % infections averted. (D) Total infections with nonpharmaceutical interventions (NPIs) lifted when vaccination coverage reaches 50% (default condition is NPIs continued indefinitely). (E) Total infections with vaccination coverage reduced from 100% to 50%. (F) Total infections with baseline vaccine efficacy (against WT) reduced from 95% to 70%. (G) Total infections with the combination of conditions D through F (vaccination coverage reduced to 50%, vaccine efficacy reduced to 70%, and NPIs lifted when 50% of the population is vaccinated). Shading in panels D-G represents total infections. (H) Percentage of variant infections composed of reinfections and breakthrough infections under the combined conditions of panels D through F; shading represents percentage of variant infections occurring in recovered/vaccinated individuals. NPIs switch between low intensity (reduce transmission by 30%) and high intensity (reduce by 70%) when the prevalence of infection (lagged by two weeks) crosses a threshold, which is set to 1% of the population. Variant introduced at 9 months in all simulations. Variant phenotypes are as follows: variant 0, identical to WT; variant 1, 60% greater transmissibility; variant 2, 40% immune escape; variant 3, 60% greater transmissibility and 40% immune escape.
Figure S6
Figure S6
Epidemic outcomes for alternative model with all-or-nothing immunity, related to Figures 2, 4, and 5 (A) Total infections (WT + variant) in simulations with each hypothetical variant, for varying rates of vaccination (vaccination duration, x axis) and time of vaccine introduction (vaccination start time, y axis); shaded contours represent total infections. (B) Number of infections averted by vaccination; shading represents number of infections averted. (C) Percentage of infections averted by vaccination; shading represents % infections averted. (D) Total infections with nonpharmaceutical interventions (NPIs) lifted when vaccination coverage reaches 50% (default condition is NPIs continued indefinitely). (E) Total infections with vaccination coverage reduced from 100% to 50%. (F) Total infections with baseline vaccine efficacy (against WT) reduced from 95% to 70%. (G) Total infections with the combination of conditions D through F (vaccination coverage reduced to 50%, vaccine efficacy reduced to 70%, and NPIs lifted when 50% of the population is vaccinated). Shading in panels D-G represents total infections. (H) Percentage of variant infections composed of reinfections and breakthrough infections under the combined conditions of panels D through F; shading represents percentage of variant infections occurring in recovered/vaccinated individuals. Variant introduced at 9 months in all simulations. Variant phenotypes are as follows: variant 0, identical to WT; variant 1, 60% greater transmissibility; variant 2, 40% immune escape; variant 3, 60% greater transmissibility and 40% immune escape.
Figure S7
Figure S7
Model diagrams and rates of movement between compartments, related to STAR Methods (A) Default model with “leaky” immunity. (B) Alternative model with “all-or-nothing” immunity. Numbered terms at right give rates of movement associated with numbered arrows in each diagram.

Comment in

  • Of variants and vaccines.
    Grubaugh ND, Cobey S. Grubaugh ND, et al. Cell. 2021 Dec 22;184(26):6222-6223. doi: 10.1016/j.cell.2021.11.013. Cell. 2021. PMID: 34942096 Free PMC article.

References

    1. Abu-Raddad L.J., Chemaitelly H., Butt A.A., National Study Group for COVID-19 Vaccination Effectiveness of the BNT162b2 Covid-19 Vaccine against the B.1.1.7 and B.1.351 Variants. N. Engl. J. Med. 2021;385:187–189. - PMC - PubMed
    1. Allen H., Vusirikala A., Flannagan J., Twohig K.A., Zaidi A., Chudasama D., Lamagni T., Groves N., Turner C., Rawlinson C., et al. Household transmission of COVID-19 cases associated with SARS-CoV-2 delta variant (B.1.617.2): national case-control study. Lancet Reg. Health Eur. 2021 doi: 10.1016/j.lanepe.2021.100252. Published online October 28, 2021. - DOI - PMC - PubMed
    1. Ashby B., Thompson R.N. Non-pharmaceutical interventions and the emergence of pathogen variants. medRxiv. 2021 2021.2005.2027.21257938. - PMC - PubMed
    1. Baden L.R., El Sahly H.M., Essink B., Kotloff K., Frey S., Novak R., Diemert D., Spector S.A., Rouphael N., Creech C.B., et al. COVE Study Group Efficacy and Safety of the mRNA-1273 SARS-CoV-2 Vaccine. N. Engl. J. Med. 2021;384:403–416. - PMC - PubMed
    1. Becker M., Dulovic A., Junker D., Ruetalo N., Kaiser P.D., Pinilla Y.T., Heinzel C., Haering J., Traenkle B., Wagner T.R., et al. Immune response to SARS-CoV-2 variants of concern in vaccinated individuals. Nat. Commun. 2021;12:3109. - PMC - PubMed

Publication types

Supplementary concepts