. 2021 Dec 22;184(26):6262-6280.e26.
doi: 10.1016/j.cell.2021.11.031. Epub 2021 Dec 14.

Differential pre-malignant programs and microenvironment chart distinct paths to malignancy in human colorectal polyps

Affiliations

Differential pre-malignant programs and microenvironment chart distinct paths to malignancy in human colorectal polyps

Bob Chen et al. Cell. .

Abstract

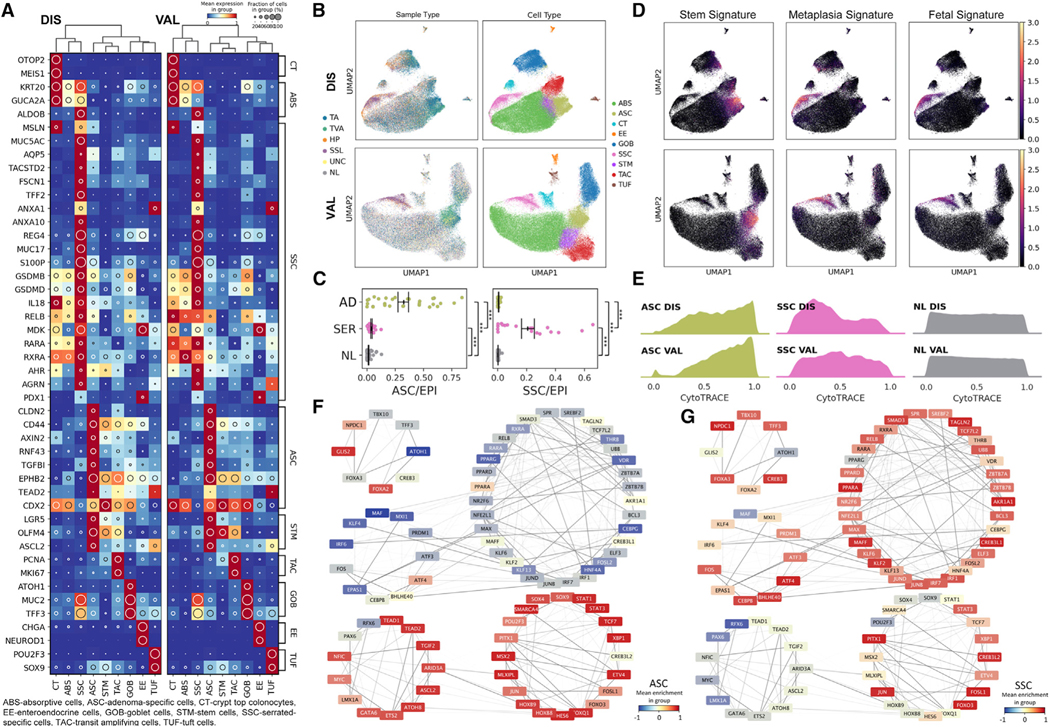
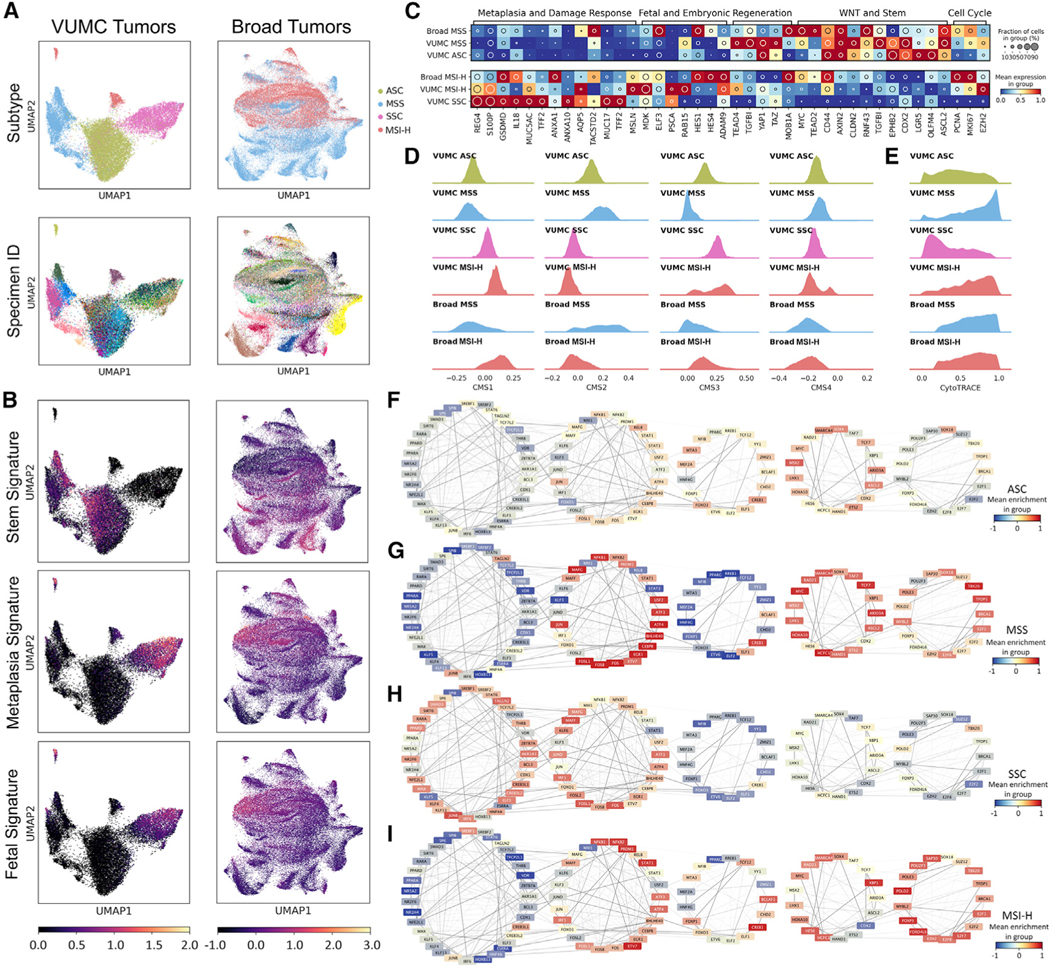
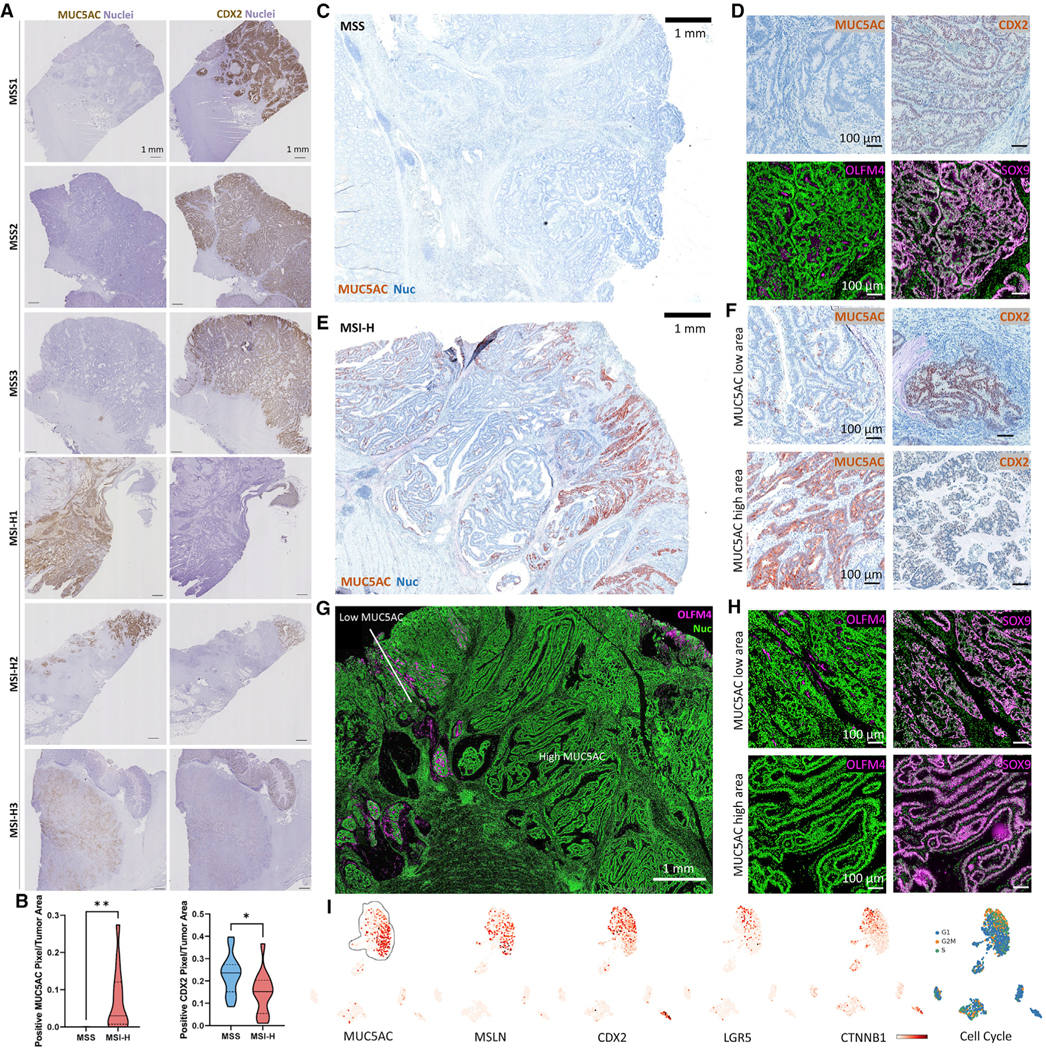
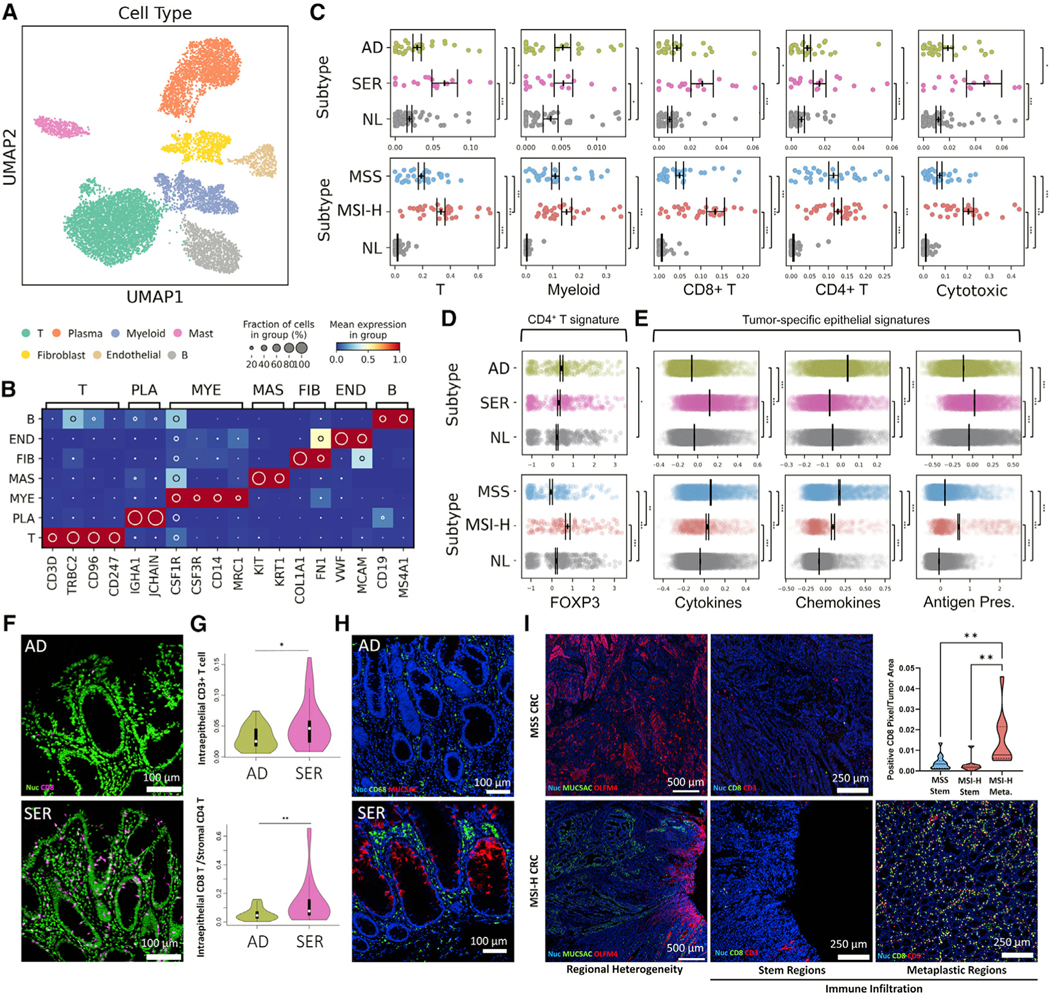
Colorectal cancers (CRCs) arise from precursor polyps whose cellular origins, molecular heterogeneity, and immunogenic potential may reveal diagnostic and therapeutic insights when analyzed at high resolution. We present a single-cell transcriptomic and imaging atlas of the two most common human colorectal polyps, conventional adenomas and serrated polyps, and their resulting CRC counterparts. Integrative analysis of 128 datasets from 62 participants reveals adenomas arise from WNT-driven expansion of stem cells, while serrated polyps derive from differentiated cells through gastric metaplasia. Metaplasia-associated damage is coupled to a cytotoxic immune microenvironment preceding hypermutation, driven partly by antigen-presentation differences associated with tumor cell-differentiation status. Microsatellite unstable CRCs contain distinct non-metaplastic regions where tumor cells acquire stem cell properties and cytotoxic immune cells are depleted. Our multi-omic atlas provides insights into malignant progression of colorectal polyps and their microenvironment, serving as a framework for precision surveillance and prevention of CRC.

Keywords: adenoma; colorectal cancer; cytotoxic; differentiation; metaplasia; multiplex; polyp; serrated; single-cell RNA-seq; stem cells.


Conflict of interest statement

Declaration of interests M.J.S., C.L.S., W.M.G., and K.N. receive funding from Janssen. C.L.S., M.G., and K.N. receive funding from Bristol Myers Squibb. W.M.G. receives funding from Tempus and Pavmed technologies; is a board member for Freenome, Guardant Health, and SEngine; and consults for DiaCarta. A.J.A. receives funding from Mirati Therapeutics, Deerfield, and Novo Ventures and consults for Oncorus, Arrakis Therapeutics, and Merck. G.M.B. receives funding from Palleon Pharmaceuticals, Olink Proteomics, and Takeda Oncology and is a board member for Novartis and Nektar Therapeutics. A.C.A. is a board member for Tizona Therapeutics, Compass Therapeutics, Zumutor Biologics, and ImmuneOncia and consults for iTeos Therapeutics. M.G. and K.N. receive funding from Merck and Servier. K.N. receives funding from Revolution Medicines, Evergrande Group, Pharmavite, and Merck; is a board member for Seattle Genetics and BiomX; and consults for X-Biotix Therapeutics. A. Regev is a founder of and equity holder in Celsius Therapeutics and holds equity in Immunitas Therapeutics. O.R.-R. and A. Regev are employees of Genentech. N.H. holds equity in BioNTech and consults for Related Sciences/Danger Bio. All other authors declare no competing interests.

Figures

Figure 1.
Figure 1.. Features of human colonic pre-cancers
(A) Experimental design for profiling tumor subtypes across multiple datasets. (B) Haematoxylin and eosin (H&E) images of normal colonic tissue and polyp subtypes. Green brackets, crypt portions occupied by neoplastic cells. (C) Oncoplot of somatic mutations by WES for polyps. (Top) Mutation burden represented by bar plot. (Dark-gray boxes) CRC driver genes are grouped into pathways. (Right) Percentage of mutations within subtypes summarized as a table. See also Figure S1 and Table S1.
Figure 2.
Figure 2.. Single-cell gene expression and regulatory network landscape of pre-cancers
(A) Heatmap of top biologically relevant and differentially expressed genes for (left) DIS (n = 62) and (right) VAL (n = 59) epithelial datasets. The inset circle indicates prevalence and intensity represents scaled expression. (B) Regulon-based UMAPs of (top) DIS and (bottom) VAL epithelial datasets color overlaid with (left) tissue or (right) cell type. (C) Scatterplots of normalized (left) ASC or (right) SSC representation per tissue subtype. Points represent individual specimens. Error bars represent SEM of n = 29 for AD, n = 19 for SER, and n = 66 for NL. (D) Stem, metaplasia, and fetal signature scores overlaid onto UMAPs of (C). (E) Ridge plots of CytoTRACE score distributions for ASC, SSC, and NL cell populations across (top) DIS and (bottom) VAL datasets. (F and G) TF target network created from normal and pre-cancer cells, organized into super-regulons for (F) ASCs and (G) SSCs. Color overlays are regulon enrichment scores, while edge opacities are the inferred TF-target weightings. ***p < 0.001. See also Figure S2 and Tables S2, S3, S4, S5, and S6.
Figure 3.
Figure 3.. Inferred origins of pre-cancers
(A–D) Multiplex images of colonic polyps and normal tissues for (A) SOX9, (B) OLFM4, (C) CDX2, and (D) MUC5AC. (Right) Image quantification (n = 20 polyps per subtype). (E) p-Creode analysis on epithelial regulon landscapes, for (top) DIS and (bottom) VAL datasets. For gene overlays, node size represents cell proportion and intensity represents scaled expression. (F) RNA velocity for representative NL, TA, and SSL overlaid on combined UMAP embedding for DIS. Vectors inferring average transitions shown as black arrows. Colored points are cells derived from the representative specimen, and gray points are all other cells in the dataset. *p < 0.05, **p < 0.01, ****p < 0.0001. See also Figure S3.
Figure 4.
Figure 4.. Analysis of CRCs through the lens of pre-cancers
(A) Regulon-based UMAPs for tumor-specific cells overlaid with (top) subtypes and (bottom) specimen for the (left) VUMC and (right) Broad datasets. (B) Stem, metaplasia, and fetal signature scores overlaid onto UMAPs in (A). (C) Heatmap representation of pre-cancer-derived gene sets for VUMC (n = 55 specimens) and Broad (n = 60 specimens) tumor-specific cells. (D) Single-cell CMS scoring based on single sample predictor for tumor-specific cells. (E) Ridge plots of CytoTRACE score distributions for tumor-specific cells. (F–I) TF target network created from tumor-specific cells, organized into super-regulons for (F) ASC, (G) MSS, (H) SSC, and (I) MSI-H. See also Figure S4 and Tables S4, S5, and S7.
Figure 5.
Figure 5.. Heterogeneity of CRCs with metaplastic and stem-like features
(A) IHC scans for MUC5AC and CDX2 of CRCs. (B) Image quantification of n = 17 MSS and n = 14 MSI-H CRCs. (C and D) (C) Low-mag. view and (D) high-mag. view of a MSS CRC with protein markers. (E) Low-mag. view of a MSI-H CRC. (F) High-mag. view of MUC5AC high and low areas for metaplasia markers of the CRC in (E). (G and H) Same as in (E) and (F) but for stem cell markers. Black rectangles in the restitched image represent fields of views that were not scanned. (I) UMAP of scRNA-seq data of the MSI-H CRC in (E) overlaid with markers and cell cycle signatures. *p < 0.05, **p < 0.01.
Figure 6.
Figure 6.. The immune landscape of colonic tumor subtypes
(A) Regulon-based UMAP representation of non-epithelial cells. (B) Heatmap of marker genes defining each cell type in (A). T - T cell, PLA - Plasma B cell, MYE - Myeloid, MAS - Mast, FIB - Fibroblast cell, END - Endothelial cell, B - B cell. (C) Scatterplots of cell type representation of (top) polyp and (bottom) CRC subtypes. Points represent individual specimens. Error bars represent SEM of n = 28 for AD, n = 17 for SER, n = 66 for NL, n = 33 for MSS, and n = 34 for MSI-H. (D and E) Scatterplots of (D) CD4+ T cell and (E) tumor cell-specific signature scores, with each point representing a single cell. Error bars depict SEM of single cells. (F) MxIF images of CD8+ cells in polyps. (G) Image quantification of intraepithelial CD8+ cells for n = 20 polyps per type. (H) MxIF images of CD68+ and MUC5AC+ in cells in polyps. (I) MxIF scans of intratumoral heterogeneous regions within CRCs (OLFM4+ stem regions versus MUC5AC+ metaplastic regions). MSS CRC only has stem regions. MxIF images of CD8 and CD3 within stem and metaplastic regions. The inset is the quantification of CD8-positive pixels in these regions from MxIF scans of n = 15 MSS and n = 10 MSI-H CRCs. *p < 0.05, **p < 0.01, ***p < 0.001. See also Figure S6 and Tables S3, S4, and S5.
Figure 7.
Figure 7.. Functional validation of the tumor cell-differentiation status and the effects on cytotoxic immunity
(A) IF images of Apc-driven colonic tumor and Braf-driven proximal colon villiform metaplasia (white arrows). (B) Quantification of CD8-positive pixels from IF. Red line denotes the mean level detected in adjacent normal colon in Braf mice. Error bars represent SEM from n = 3 animals per group. (C) IF images of CD8+ T cells in tumor, villiform metaplasia (white arrows), and control colon. Dotted line demarcates border between villus and crypt compartments. (D and E) H&E (D) and β-catenin IHC (E) of colonic tissues and tumors of tamoxifen-induced Lrig1 or Mist1 tumor mice 28 days after DSS. (F–H) UMAP of epithelial scRNA-seq data generated from mouse colonic tissues and tumors, with overlays indicating (F) cell type, (G) gene overlays, and (H) biological replicates. (I) Heatmap of genes defining human metaplastic and cell signatures in specified epithelial populations from mouse scRNA-seq. (J and K) Combined UMAP of immune cell scRNA-seq data from mouse colonic tissues and tumors, with overlays indicating (J) conditions and (K) cell type. (L and M) Quantification of (L) general immune cell types and (M) specific lymphocyte populations from Lrig1 (left) and Mist1 (right) scRNA-seq data. (N) UMAP overlays of genes related to immunosuppression or cytotoxicity in myeloid and lymphoid cells. (O) MxIF images of T cells in tumors. (P) Image quantification of T cells. Each dot represents a field of view. Error bars represent SEM from n = 3 animals per group. (Q) CytoTRACE score for TSCs from scRNA-seq. (R) Organoid formation efficiency of single cells isolated from tumors and control colons. Each dot represents data from a well with representative images shown in insets. Error bars represent SEM from n = 4 animals per tumor, 2 for control. (S) SCI, II, and III metagene signatures for TSCs from scRNA-seq. (T) Heatmap of individual antigen-presentation genes at single-cell level. (U) MHCII metagene signature expression for TSCs. (V) Quantification of DQ-OVA+/I-AI-E+ epithelial tumoroid cells from flow plots. Error bars represent SEM from n = 6 animals per condition. (W) Percentage of proliferating T cells determined by CellTrace Violet assay when co-cultured with organoids derived from colonic tumors or normal tissues (+DSS) +/— 50 mg/mL OVA peptide. Error bars represent SEM of organoids from n = 5 mice for tumors and two for normal. *p < 0.05, **p < 0.01, ***p < 0.001, ****p < 0.0001. See also Figure S7 and Table S5.

Comment in

References

    1. Aibar S, González-Blas CB, Moerman T, Huynh-Thu VA, Imrichova H, Hulselmans G, Rambow F, Marine JC, Geurts P, Aerts J, et al. (2017). SCENIC: single-cell regulatory network inference and clustering. Nat. Methods 14, 1083–1086. - PMC - PubMed
    1. Alshetaiwi H, Pervolarakis N, McIntyre LL, Ma D, Nguyen Q, Rath JA, Nee K, Hernandez G, Evans K, Torosian L, et al. (2020). Defining the emergence of myeloid-derived suppressor cells in breast cancer using single-cell transcriptomics. Sci. Immunol 5, eaay6017. - PMC - PubMed
    1. Anderson AC, Joller N, and Kuchroo VK (2016). Lag-3, Tim-3, and TIGIT: Co-inhibitory Receptors with Specialized Functions in Immune Regulation. Immunity 44, 989–1004. - PMC - PubMed
    1. Ansari I, Raddatz G, Gutekunst J, Ridnik M, Cohen D, Abu-Remaileh M, Tuganbaev T, Shapiro H, Pikarsky E, Elinav E, et al. (2020). The microbiota programs DNA methylation to control intestinal homeostasis and inflammation. Nat. Microbiol 5, 610–619. - PubMed
    1. Ayyaz A, Kumar S, Sangiorgi B, Ghoshal B, Gosio J, Ouladan S, Fink M, Barutcu S, Trcka D, Shen J, et al. (2019). Single-cell transcriptomes of the regenerating intestine reveal a revival stem cell. Nature 569, 121–125. - PubMed

Publication types

MeSH terms