. 2022 Feb 7;32(3):545-558.e5.
doi: 10.1016/j.cub.2021.11.055. Epub 2021 Dec 14.

Retinal horizontal cells use different synaptic sites for global feedforward and local feedback signaling

Affiliations

Retinal horizontal cells use different synaptic sites for global feedforward and local feedback signaling

Christian Behrens et al. Curr Biol. .

Abstract

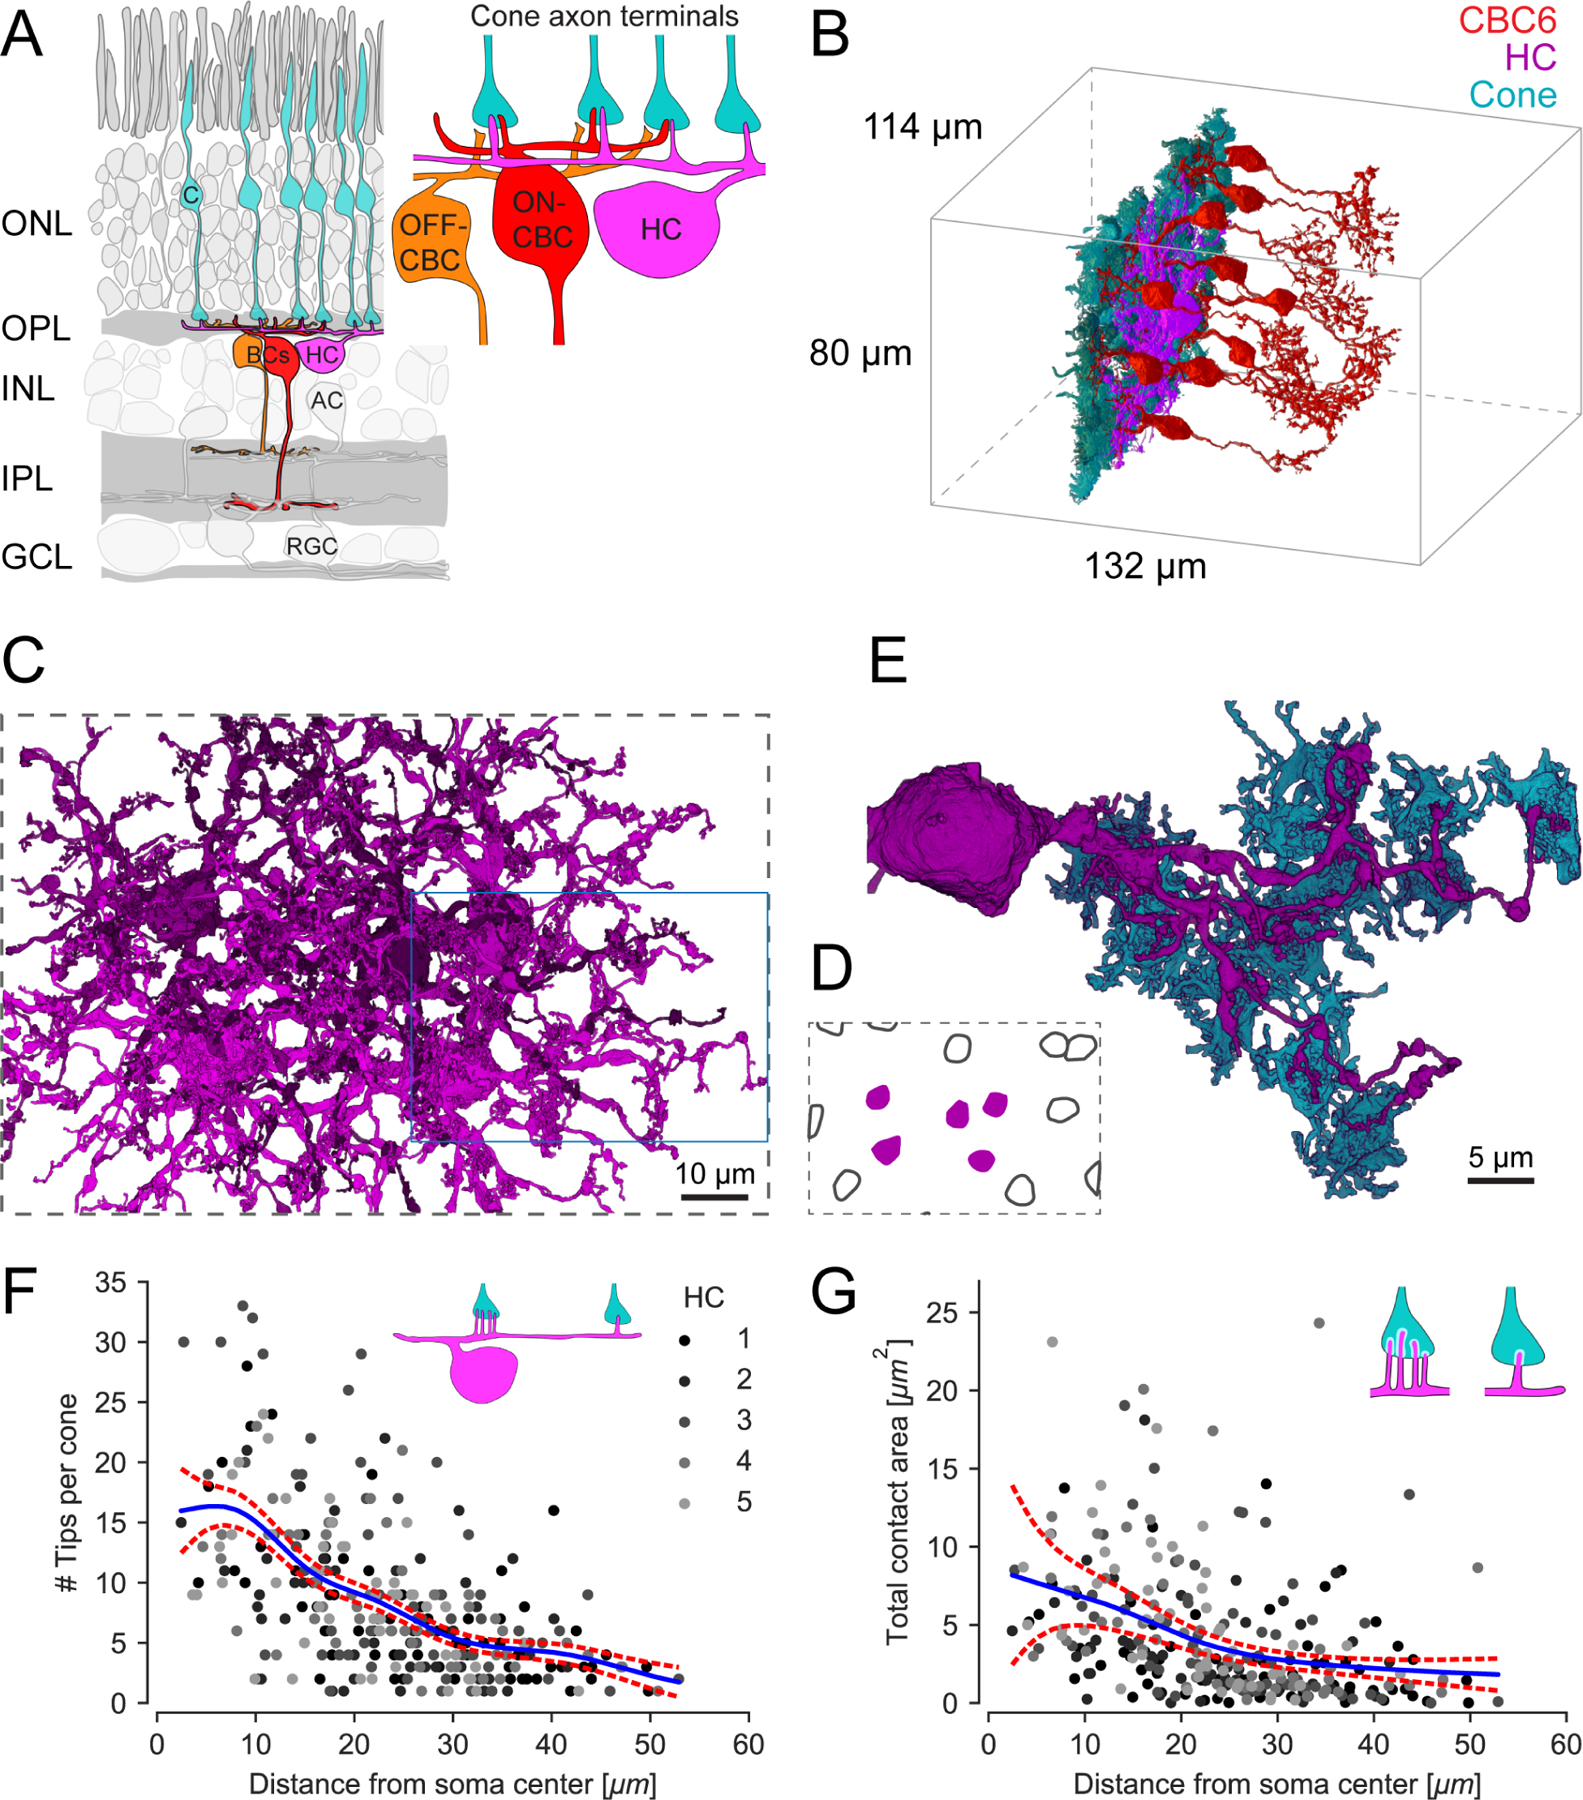
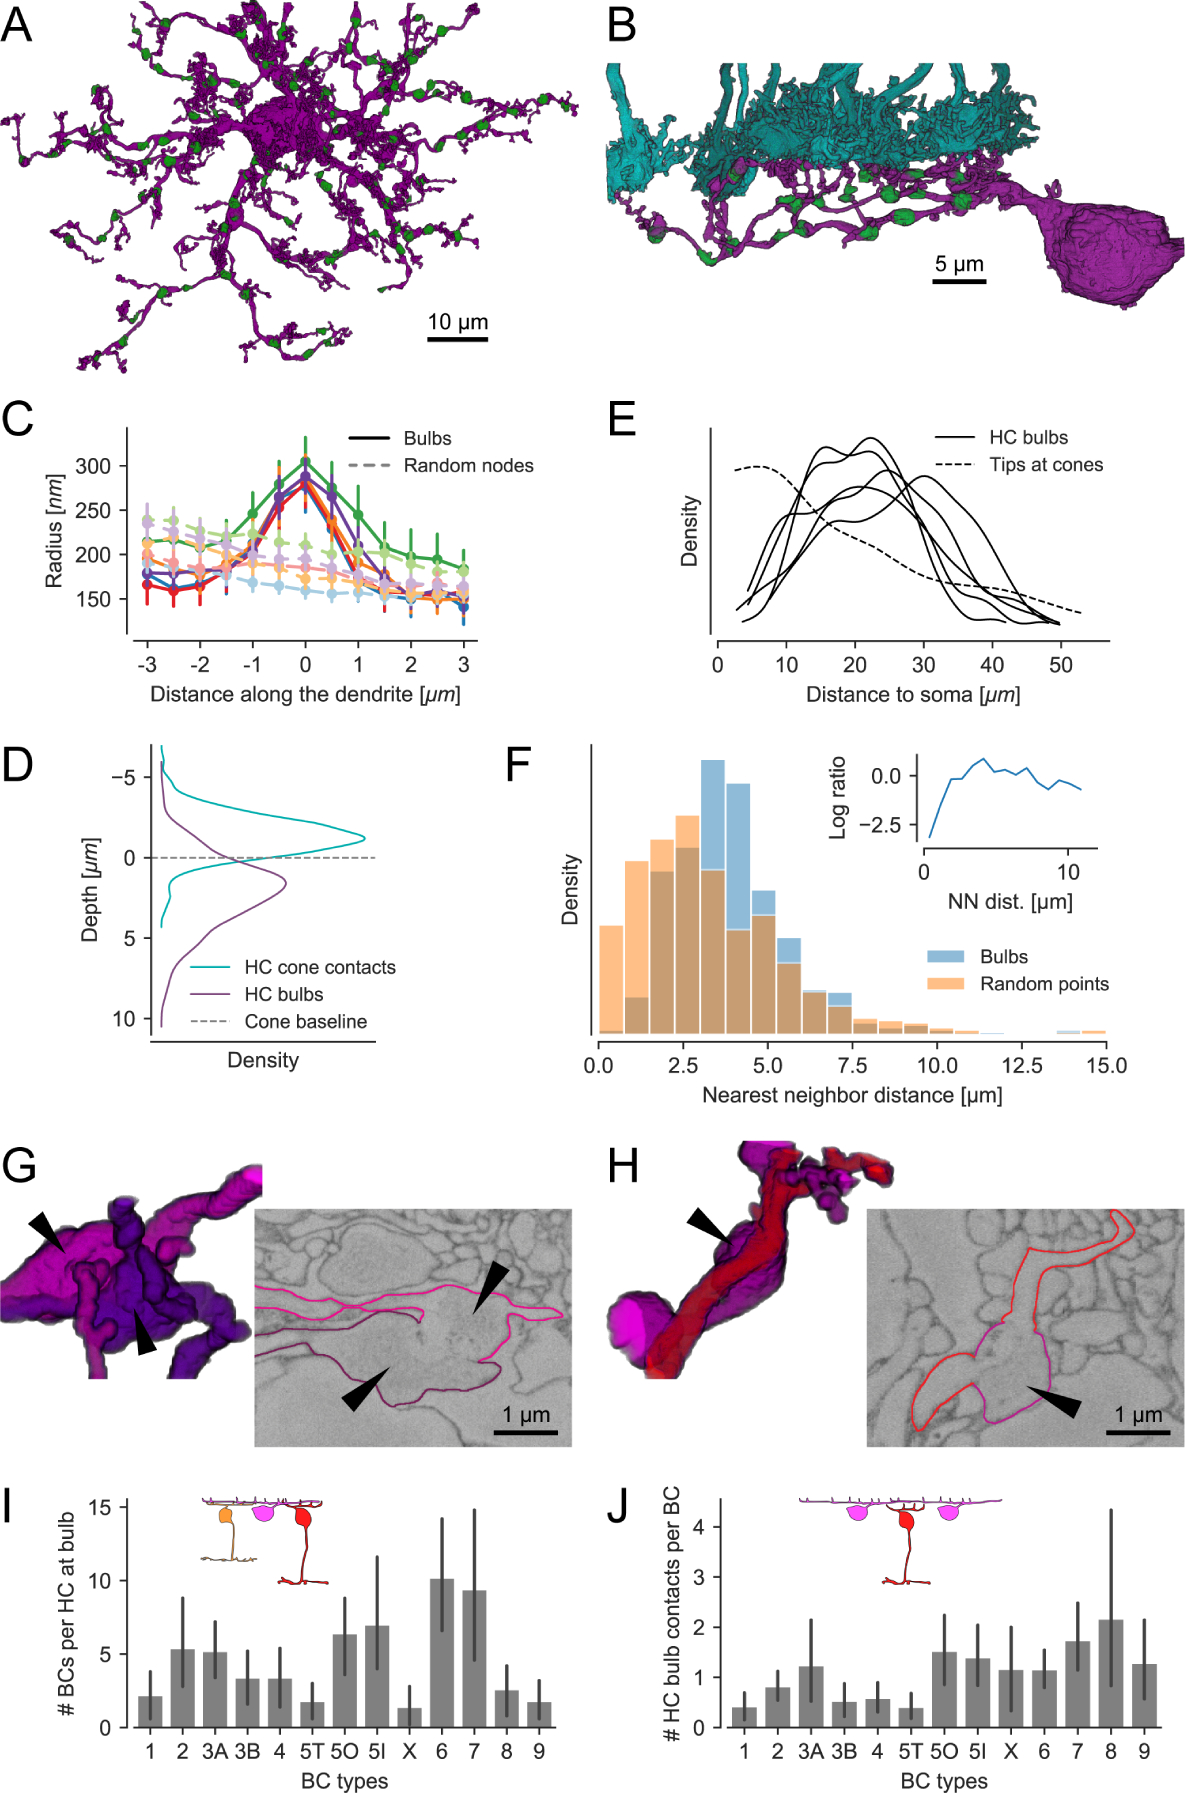
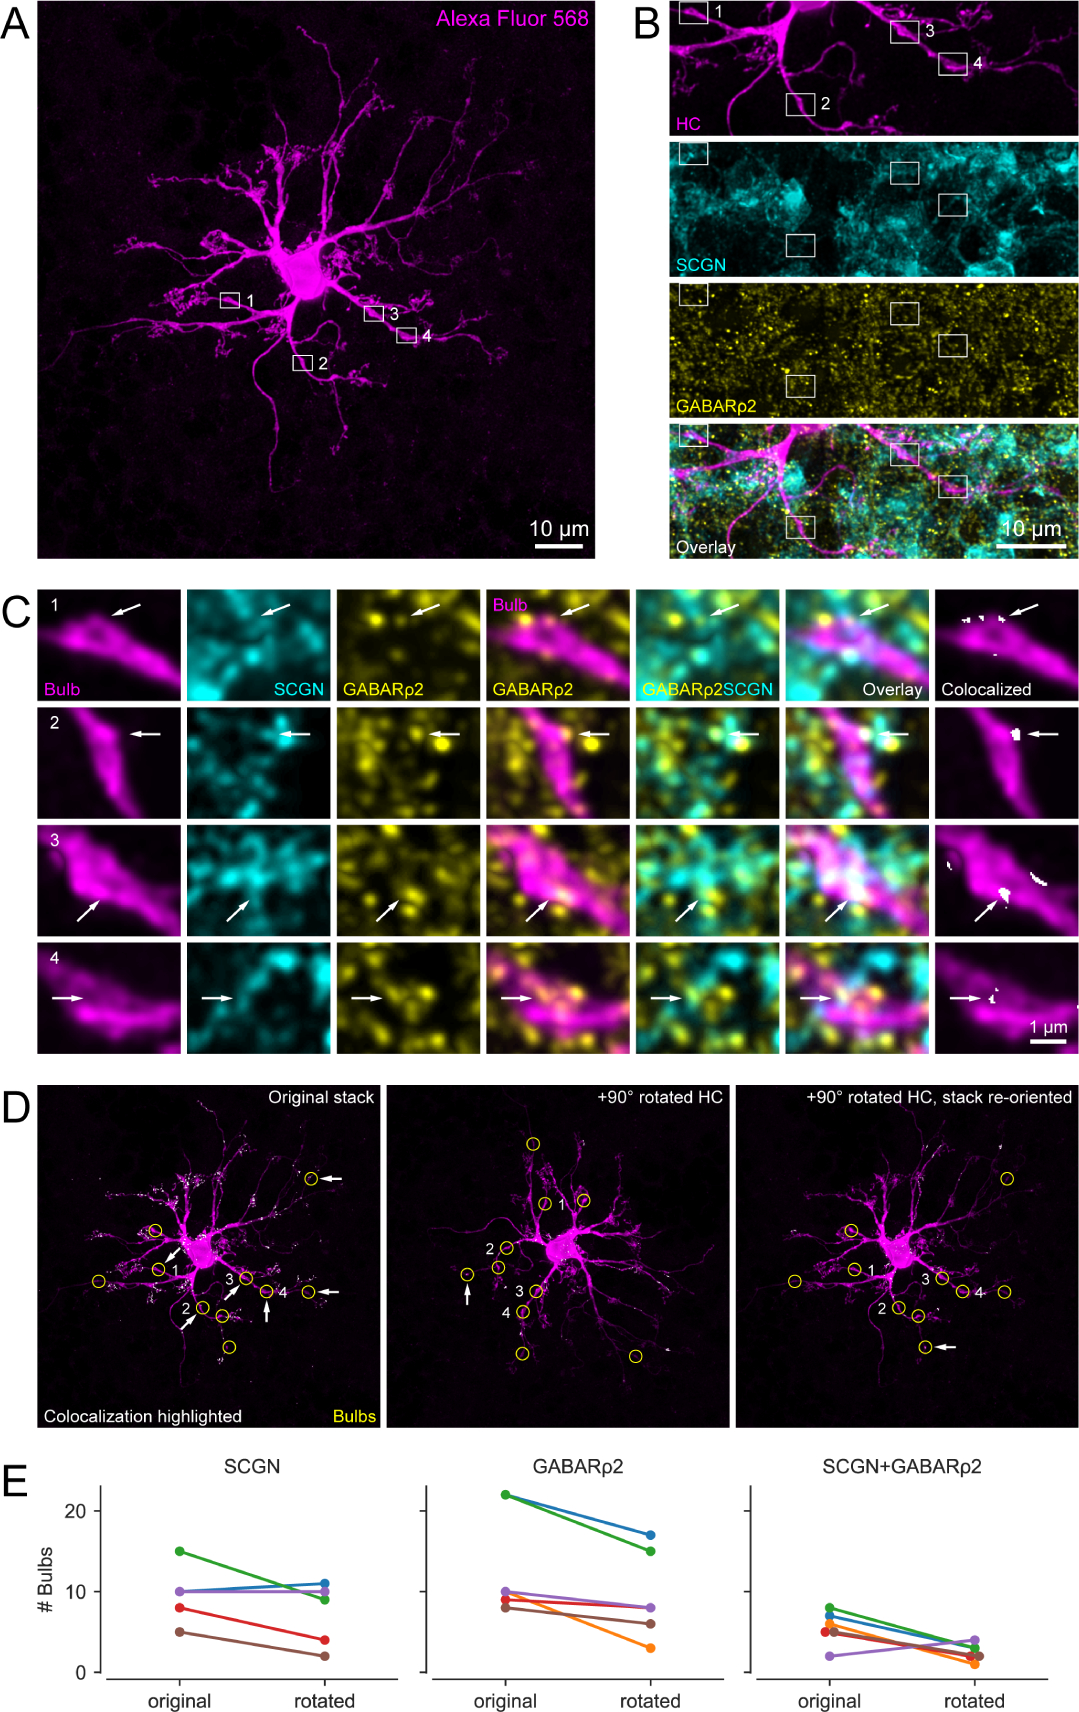
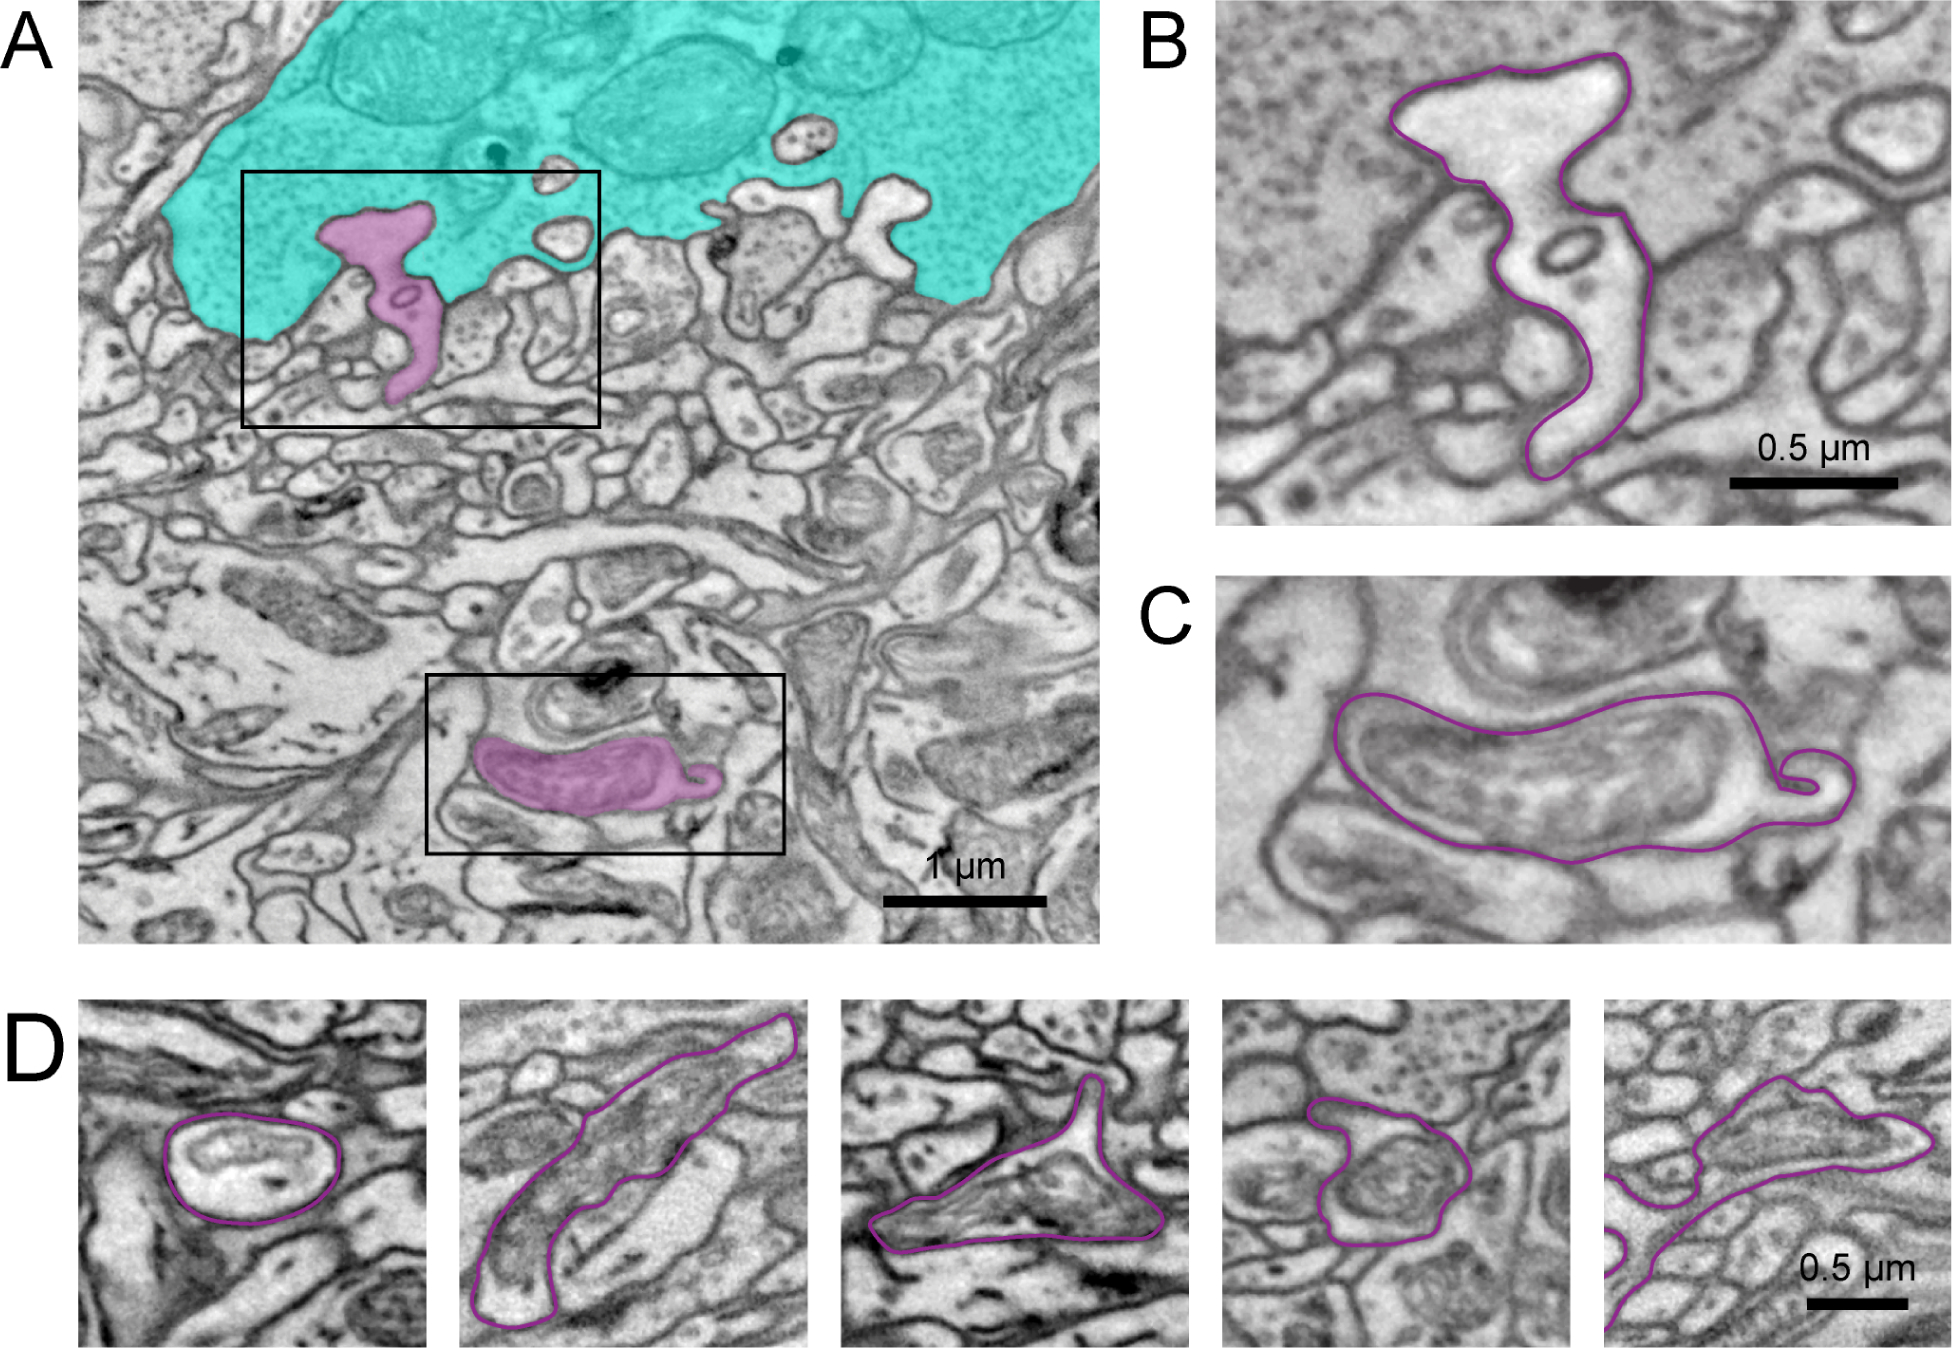
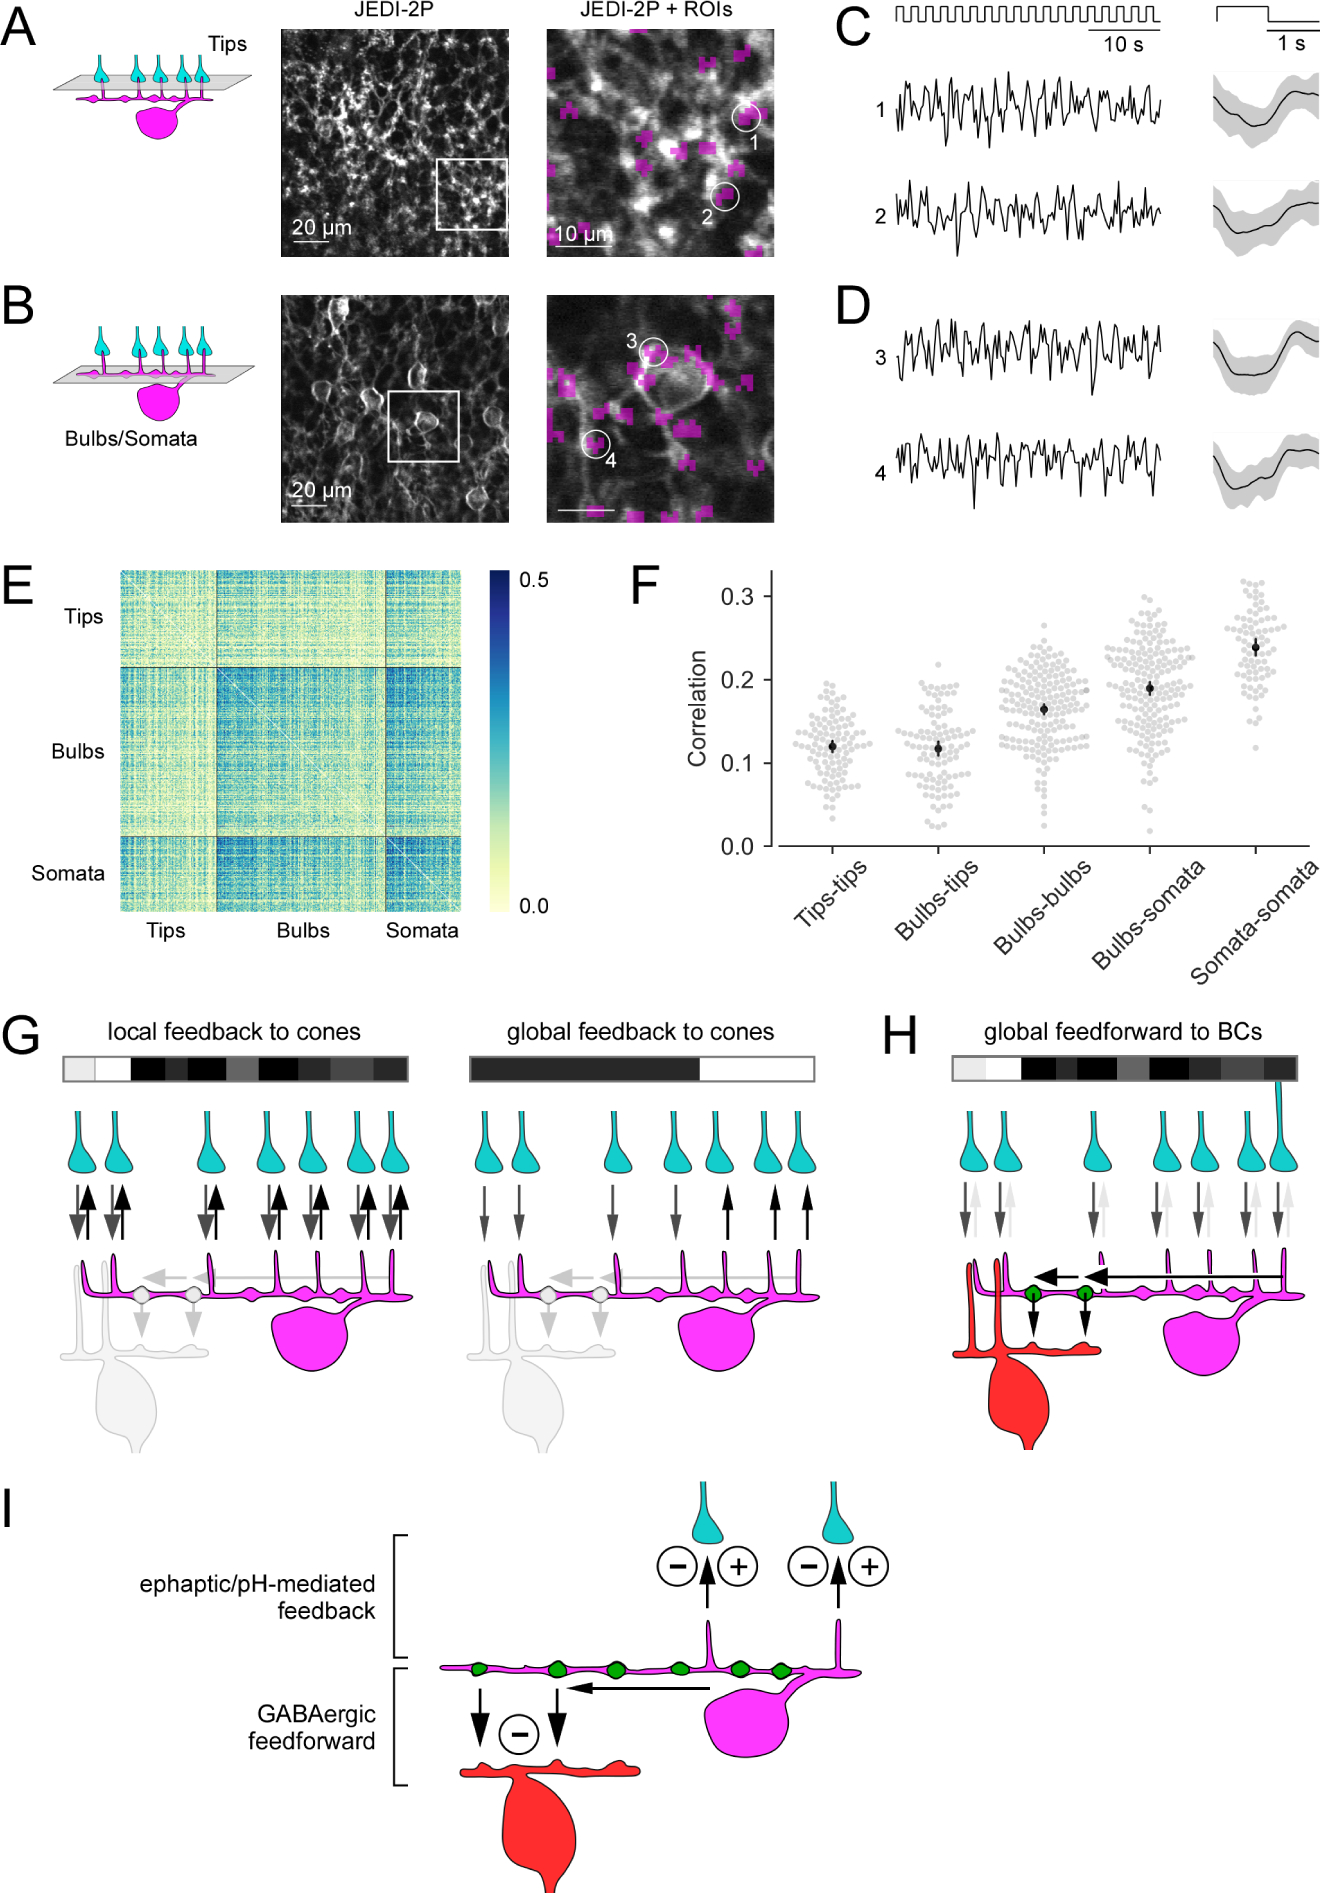
In the outer plexiform layer (OPL) of the mammalian retina, cone photoreceptors (cones) provide input to more than a dozen types of cone bipolar cells (CBCs). In the mouse, this transmission is modulated by a single horizontal cell (HC) type. HCs perform global signaling within their laterally coupled network but also provide local, cone-specific feedback. However, it is unknown how HCs provide local feedback to cones at the same time as global forward signaling to CBCs and where the underlying synapses are located. To assess how HCs simultaneously perform different modes of signaling, we reconstructed the dendritic trees of five HCs as well as cone axon terminals and CBC dendrites in a serial block-face electron microscopy volume and analyzed their connectivity. In addition to the fine HC dendritic tips invaginating cone axon terminals, we also identified "bulbs," short segments of increased dendritic diameter on the primary dendrites of HCs. These bulbs are in an OPL stratum well below the cone axon terminal base and make contacts with other HCs and CBCs. Our results from immunolabeling, electron microscopy, and glutamate imaging suggest that HC bulbs represent GABAergic synapses that do not receive any direct photoreceptor input. Together, our data suggest the existence of two synaptic strata in the mouse OPL, spatially separating cone-specific feedback and feedforward signaling to CBCs. A biophysical model of a HC dendritic branch and voltage imaging support the hypothesis that this spatial arrangement of synaptic contacts allows for simultaneous local feedback and global feedforward signaling by HCs.

Keywords: calcium; dendrite; global; glutamate; horizontal cell; local; mouse; neurons; retina; synapse.


Conflict of interest statement

Declaration of interests The authors declare no competing interests.

Figures

Figure 1.
Figure 1.. Horizontal cell reconstruction from electron microscopy data
(A) Schematic of a vertical section through the mouse retina, highlighting the reconstructed cell types. Inset: Textbook-view of the connectivity of bipolar cells (BCs) and horizontal cell (HC) at the cone (C) axon terminals with invaginating HC (magenta) and ON-CBC (red) dendritic tips and basal OFF-CBC contacts (orange). AC, amacrine cell; RGC, retinal ganglion cell. (B) Outlines of the dataset with volume reconstructed cone axon terminals (cyan), one HC (magenta) and several CBC type 6 (CBC6, red; only 10 of 45 CBC type 6 shown). (C) Volume reconstructions of five HCs (top view); blue rectangle: location of dendrite shown in (E). For renderings of the individual cells see Figure S1. (D) Soma locations of the five reconstructed HCs (magenta, shown in C) and 10 HCs not reconstructed (black outline). (E) Bottom view of the volume reconstruction of a complete single HC primary dendrite (magenta) with contacted cone axon terminals (cyan). HC dendrite taken from inset in (C). (F) HC skeleton tips per contacted cone vs. distance from HC soma. Blue: Poisson GAM fit with 95%-confidence interval (red). Inset illustrates the number of HC tip-to-cone contacts at different locations along the HC dendrite. See Figure S2 for an example EM slice and HC branch skeleton. (G) Contact area between HC and cone axon terminal volume reconstructions per cone vs. distance from HC soma. Blue: Gamma GAM fit with 95%-confidence interval (red). Inset illustrates contact areas (white) for close-to-the-soma contacts (left) and more distant (right) contacts. For contact statistics between cones and ON-CBCs see Figure S3.
Figure 2.
Figure 2.. Identification and properties and contacts of “bulbs” in horizontal cells
(A) Top view of a reconstructed HC with bulbs highlighted in green. (B) Side view of a branch from the same HC with bulbs (green) and cone axon terminals (cyan). (C) Dendritic radius profile at bulb locations (solid curves w/high saturation) compared to randomized points on the dendrites (dashed curves w/low saturation). For each of the five reconstructed HCs we analyzed the distribution of distances from bulbs to soma and dendritic tips. We generated a set of random locations on the HC dendrites so that number and distribution of distances matches the bulb statistics. For both sets of points we extracted the dendritic radius in their vicinity and plotted the averages per HC. Color represents individual HCs; error bars show 95%-confidence intervals. Note that the radius gradually decreases with increasing distance due to the tapering of the dendrite. (D) Depth of bulbs compared to HC-cone contacts. (E) Kernel density estimate of the distance distribution of bulbs relative to the soma for all five HCs. Dashed curve: Model fit showing distribution of HC skeleton tips at cones from Figure 2C. (F) Histogram of bulb nearest neighbor (NN) distances within individual HCs vs. the same number of points randomly distributed on the HC dendrites. Inset: Log ratio between bulb and random point NN distances. (G) Volume rendering and EM slice showing a bulb contact between two HCs. (H) Volume rendering and EM slice showing a contact between HC (magenta) bulb (arrowhead) and ON-CBC (red). (I) BCs contacted by bulbs per HC for all CBC types. (J) HC bulb contacts per BC for all CBC types. Likely, the number of contacts per CBC is underestimated since contacts to not reconstructed HCs are not included. All error bars show 95%-confidence intervals.
Figure 3.
Figure 3.. GABARρ2 receptors are present at the contact points between horizontal cell bulbs and CBC dendrites
(A) Alexa Fluor 568-injected HC with identified bulbs (white boxes indicate examples). Note that the brightness was increased for better visibility. (B) Magnified clipping from (A) showing four representative bulbs (magenta) as well as their corresponding secretagogin (SCGN, cyan) and GABARρ2 (yellow) stainings. The bottom panel represents overlay of the three channels. (C) Enlarged bulbs from boxes in (B) with SCGN and GABARρ2 immunolabeling. Both individual (columns 1–3) and merged channels (columns 4–6) are shown, with arrows indicating colocalization. Colocalization of all three channels at the bulbs (column 7) identified by ‘colocalization highlighter’ plugin in Fiji (see panel D). (D) Colocalizing points highlighted in original (left) and 90-degree rotated HC (center, right), with bulbs encircled (yellow). Arrows denote bulbs with colocalization. (E) Line plots showing number of bulbs (per HC, n = 6 HCs) colocalizing with SCGN (left), GABARρ2 (center) and both (right) for non-rotated (original) and 90-degree rotated condition, see also Table S1. Note that images are maximum projections: (A, D) of the entire HC stack (85 optical slices), (B) of the selected clipping (40 optical slices), and (C) of 5–7 optical slices for better visibility of the bulbs. Optical section thickness was 0.17μm. Colocalization analysis itself were carried out within each optical section.
Figure 4.
Figure 4.. Mitochondrial structure in HC bulbs
(A) Electron micrograph showing a manually traced HC (magenta) with a dendritic tip invaginating in a cone axon terminal (cyan) (B) and the primary dendrite below the cone axon terminal with a HC bulb of the same cell (C). See also the Video S1 visualizing the complete EM stack. (D) Additional examples of HC bulbs (magenta outline). Note the mitochondrial structure in the bulbs. Black rectangles: location of magnifications shown in (B,C).
Figure 5.
Figure 5.. Glutamate imaging in the OPL
(A, B) Horizontal scans of a Cx57cre/+ transgenic mouse retina in which HCs express the fluorescent glutamate sensor iGluSnFR after intravitreal AAV injection (see STAR Methods), with the focal plane in the OPL at the level of the HC tips (A) and at the level of the HC primary dendrites (B). (C) Correlation image (left) indicating hotspots of light-evoked glutamate release at HC tips and resulting regions-of-interest (ROIs; right). (D) Like (C) but at the primary HC dendrite level. Note that a lower correlation threshold was used than in (C) to draw ROIs (see STAR Methods). (E, F) Light-evoked glutamate signals (top, UV-green-white flashes; bottom, local chirp) are only detectable in the plane of the HC tips (E) but not at bulbs (F). (G) Histogram of reliability indices of UV-green-white flash responses for all ROIs (n = 359 at tip level, white bars; n = 166 at bulb level, grey bars) in n = 6 scan fields and n = 3 mice. P < 0.05; two-sided Wilcoxon rank-sum test. For complemental axial (x-z) scans see Figure S4.
Figure 6.
Figure 6.. Biophysical modeling of the signal available at HC bulbs
(A) Side and (B) top view of the modelled HC dendrite with bulbs (green) and cones (cyan). (C, D) Examples of simulated voltage traces recorded at HC dendritic tips below cones, at bulbs and the average over all tips for (C) a random full-field noise stimulus and (D) a random checkerboard noise stimulus, for presentation purpose without synaptic vesicle release noise. (E, F) Correlations from 60 s of (E) full-field and (F) checkerboard stimulation including synaptic vesicle release noise. (G) Mean correlations between different tips, between tips and bulbs, between different bulbs, bulbs and the tip mean and bulbs and the soma for both stimuli, see also Figure S5. Error bars show 95%-confidence intervals. See Table S2 for model parameters.
Figure 7.
Figure 7.. Voltage imaging in the OPL and bilayered synaptic circuitry of horizontal cells in the outer mouse retina
(A, B) Horizontal (x-y) scans of a Cx57cre/+ transgenic mouse retina in which HCs express the fluorescent voltage sensor JEDI-2P after intravitreal AAV injection (see STAR Methods), with the focal plane in the OPL at the level of the HC tips (A) and of the primary dendrites (B). Right: zoomed-in images of the boxed areas. Regions-of-interest (ROIs, purple) were defined by correlation between neighboring pixels, with ROI size clamped to max. 3 μm in diameter. At the primary dendrite level, ROIs were manually sorted into somata (e.g., ROI 3) and bulbs (e.g. ROIs 1, 2, 4). (C, D) Voltage responses (left, single trials; right, averages with s.d. shading) of representative ROIs to full-field white flashes, with the focal plane in the OPL at the level of the HC tips (C) and at the level of the primary dendrites (D). (E) Correlations between single trials of tips (n = 104), bulbs (n = 181) and somata (n = 80). (F) Mean correlations within and between ROI types. Each dot in the swarm plots (gray) corresponds to one ROI and shows its mean correlation with all ROIs of the reference ROI type (mentioned first in the x-axis labels). Black: Mean +-95%-confidence interval. Except for tips-tips vs. tips-bulbs, all neighboring groups of correlations are significantly different (permutation test, all significant p’s < 0.001, see STAR Methods). (G) Dendritic tips of a HC (magenta) receive cone input (grey arrows) and provide local, cone-specific feedback (black arrows) to cone axon terminals (cyan) in the presence of a spatio-temporally uncorrelated white noise stimulus (white/grey/black bar) (left). For a more spatially correlated stimulus patterns, the feedback to cones may contain a global component (right; local feedback component not shown). (H) For an uncorrelated stimulus (like in G, left), the cone input signals (grey arrows) are integrated in the HC dendrite (black arrow) and forwarded as a global signal by a BC-contacting bulb (green) to the BC (red) forming their surround signal. (I) Illustration of the two synaptic computations performed by HCs at the two distinct OPL strata: Ephaptic/pH-mediated negative and positive feedback (minus/plus symbols) to cone axon terminals in the outer OPL and inhibitory GABAergic feedforward synapses (minus symbol) from HC bulbs to BCs in the inner OPL. GABAergic auto-synapses at the distal dendritic tips of HCs are not shown. Black arrows indicate HC synaptic output.

Comment in

References

    1. Thoreson WB, and Mangel SC (2012). Lateral interactions in the outer retina. Prog. Retin. Eye Res. 31, 407–441. - PMC - PubMed
    1. Smith RG (1995). Simulation of an anatomically defined local circuit: The cone-horizontal cell network in cat retina. Vis. Neurosci. 12, 545–561. - PubMed
    1. Drinnenberg A, Franke F, Morikawa RK, Jüttner J, Hillier D, Hantz P, Hierlemann A, Azeredo da Silveira R, and Roska B (2018). How Diverse Retinal Functions Arise from Feedback at the First Visual Synapse. Neuron 99, 117–134.e11. - PMC - PubMed
    1. Ströh S, Puller C, Swirski S, Hölzel M-B, van der Linde LIS, Segelken J, Schultz K, Block C, Monyer H, Willecke K, et al. (2018). Eliminating Glutamatergic Input onto Horizontal Cells Changes the Dynamic Range and Receptive Field Organization of Mouse Retinal Ganglion Cells. J. Neurosci. 38, 0141–17. - PMC - PubMed
    1. Wässle H, Puller C, Müller F, and Haverkamp S (2009). Cone contacts, mosaics, and territories of bipolar cells in the mouse retina. J. Neurosci. 29, 106–117. - PMC - PubMed

Publication types