

Predominant airborne transmission and insignificant fomite transmission of SARS-CoV-2 in a two-bus COVID-19 outbreak originating from the same pre-symptomatic index case
- PMID: 34910996
- PMCID: PMC8656245
- DOI: 10.1016/j.jhazmat.2021.128051
Predominant airborne transmission and insignificant fomite transmission of SARS-CoV-2 in a two-bus COVID-19 outbreak originating from the same pre-symptomatic index case
Abstract
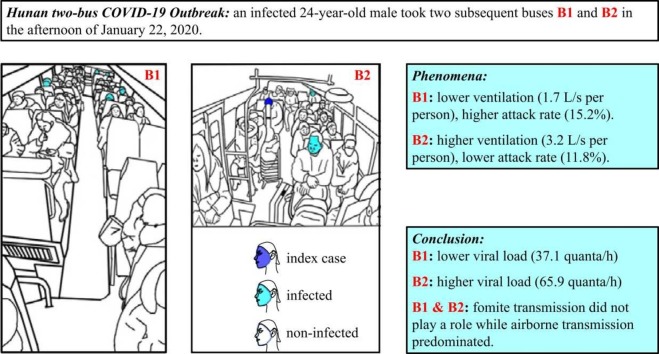
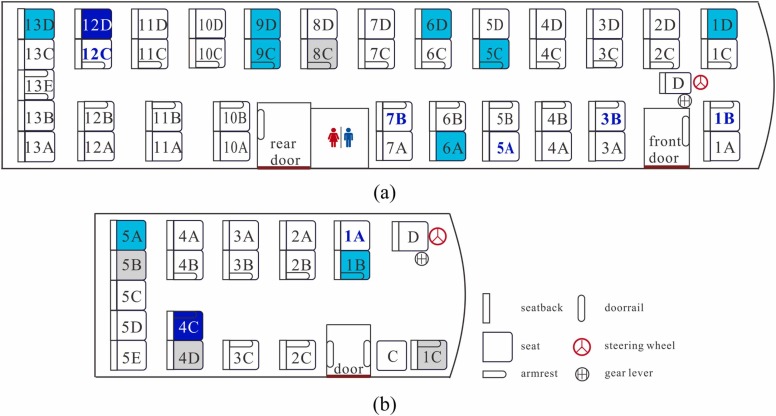
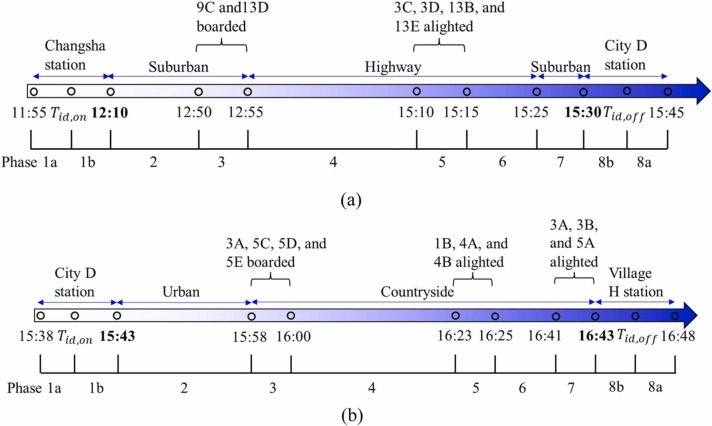
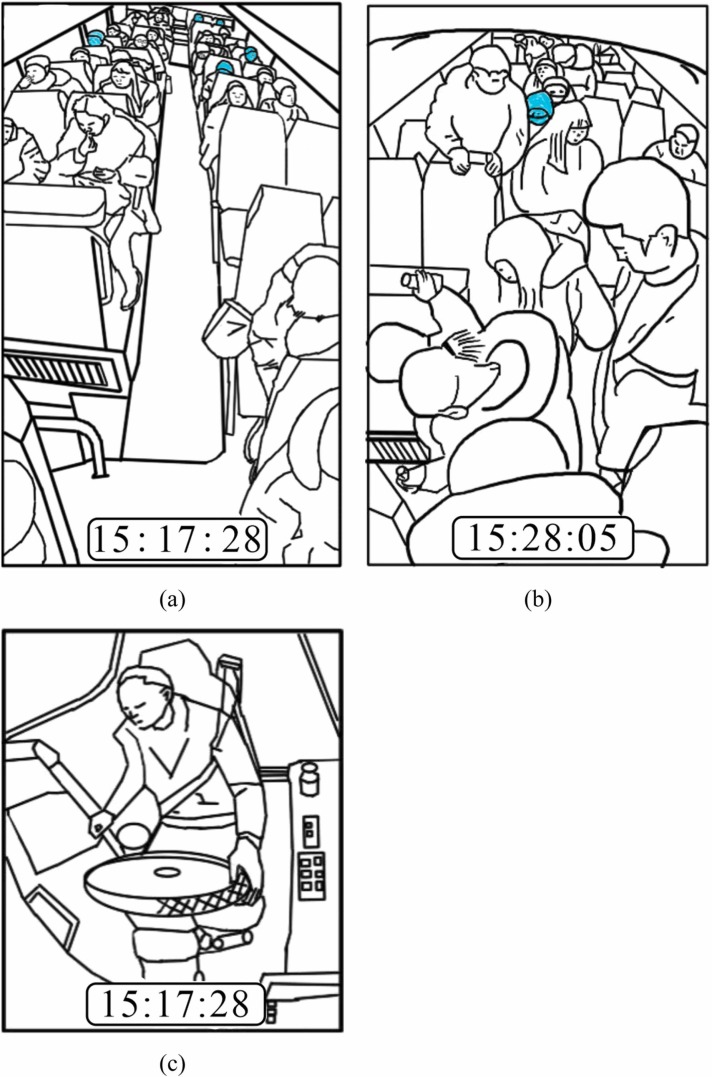
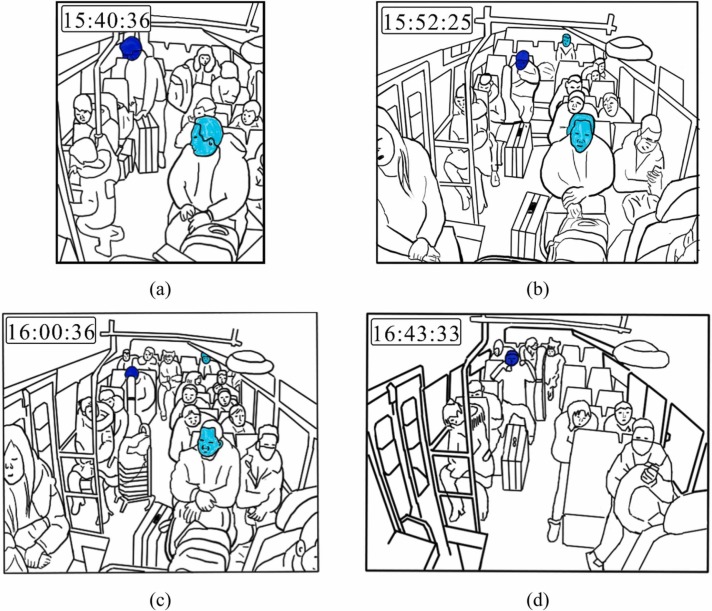
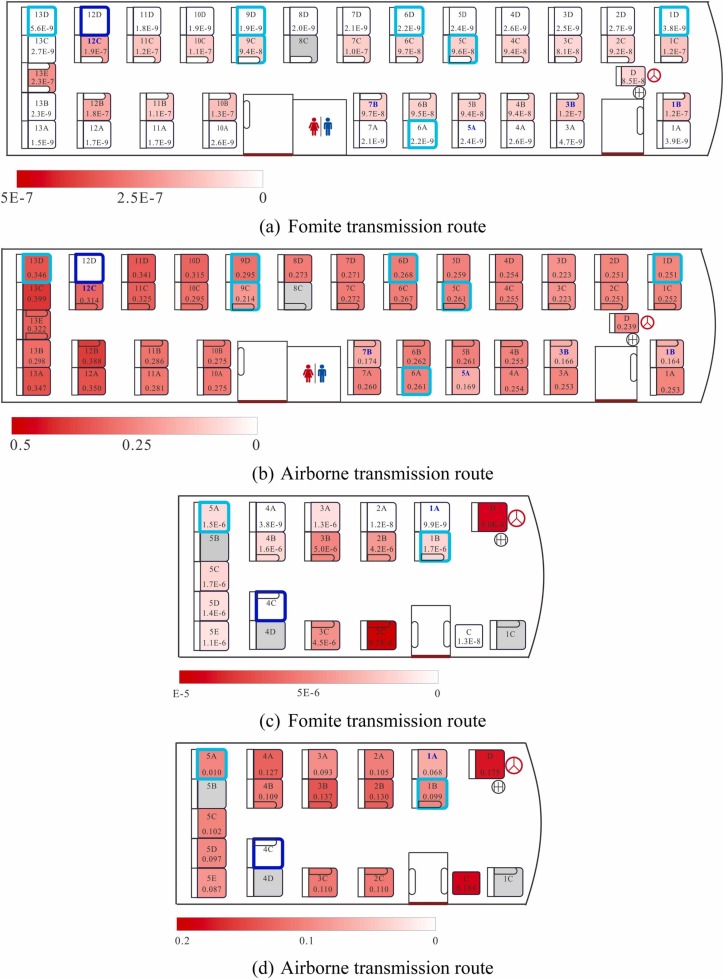
The number of people infected with severe acute respiratory syndrome coronavirus 2 (SARS-CoV-2) continues to increase worldwide, but despite extensive research, there remains significant uncertainty about the predominant routes of SARS-CoV-2 transmission. We conducted a mechanistic modeling and calculated the exposure dose and infection risk of each passenger in a two-bus COVID-19 outbreak in Hunan province, China. This outbreak originated from a single pre-symptomatic index case. Some human behavioral data related to exposure including boarding and alighting time of some passengers and seating position and mask wearing of all passengers were obtained from the available closed-circuit television images/clips and/or questionnaire survey. Least-squares fitting was performed to explore the effect of effective viral load on transmission risk, and the most likely quanta generation rate was also estimated. This study reveals the leading role of airborne SARS-CoV-2 transmission and negligible role of fomite transmission in a poorly ventilated indoor environment, highlighting the need for more targeted interventions in such environments. The quanta generation rate of the index case differed by a factor of 1.8 on the two buses and transmission occurred in the afternoon of the same day, indicating a time-varying effective viral load within a short period of five hours.
Keywords: Airborne transmission; COVID-19; Fomite transmission; Quanta generation rate.
Copyright © 2021 Elsevier B.V. All rights reserved.
Conflict of interest statement
The authors declare that they have no known competing financial interests or personal relationships that could have appeared to influence the work reported in this paper.
Figures
Similar articles
-
Community Outbreak Investigation of SARS-CoV-2 Transmission Among Bus Riders in Eastern China.JAMA Intern Med. 2020 Dec 1;180(12):1665-1671. doi: 10.1001/jamainternmed.2020.5225. JAMA Intern Med. 2020. PMID: 32870239 Free PMC article.
-
Modeling the factors that influence exposure to SARS-CoV-2 on a subway train carriage.Indoor Air. 2022 Feb;32(2):e12976. doi: 10.1111/ina.12976. Epub 2022 Feb 8. Indoor Air. 2022. PMID: 35133673 Free PMC article. Review.
-
Air and environmental sampling for SARS-CoV-2 around hospitalized patients with coronavirus disease 2019 (COVID-19).Infect Control Hosp Epidemiol. 2020 Nov;41(11):1258-1265. doi: 10.1017/ice.2020.282. Epub 2020 Jun 8. Infect Control Hosp Epidemiol. 2020. PMID: 32507114 Free PMC article.
-
Monitoring COVID-19 Transmission Risks by Quantitative Real-Time PCR Tracing of Droplets in Hospital and Living Environments.mSphere. 2021 Jan 6;6(1):e01070-20. doi: 10.1128/mSphere.01070-20. mSphere. 2021. PMID: 33408231 Free PMC article.
-
Environmental factors involved in SARS-CoV-2 transmission: effect and role of indoor environmental quality in the strategy for COVID-19 infection control.Environ Health Prev Med. 2020 Nov 3;25(1):66. doi: 10.1186/s12199-020-00904-2. Environ Health Prev Med. 2020. PMID: 33143660 Free PMC article. Review.
Cited by
-
Explosive outbreak of SARS-CoV-2 Omicron variant is associated with vertical transmission in high-rise residential buildings in Hong Kong.Build Environ. 2022 Aug 1;221:109323. doi: 10.1016/j.buildenv.2022.109323. Epub 2022 Jun 24. Build Environ. 2022. PMID: 35765578 Free PMC article.
-
Relating quanta conservation and compartmental epidemiological models of airborne disease outbreaks in buildings.Sci Rep. 2023 Oct 13;13(1):17335. doi: 10.1038/s41598-023-44527-3. Sci Rep. 2023. PMID: 37833394 Free PMC article.
-
Evidence for fomite transmission of SARS-CoV-2 Omicron variant in a mouse model.mLife. 2025 Jun 24;4(3):332-336. doi: 10.1002/mlf2.70022. eCollection 2025 Jun. mLife. 2025. PMID: 40600053 Free PMC article.
-
Mycobacterium tuberculosis Transmission in High-Incidence Settings-New Paradigms and Insights.Pathogens. 2022 Oct 25;11(11):1228. doi: 10.3390/pathogens11111228. Pathogens. 2022. PMID: 36364978 Free PMC article. Review.
-
Lack of SARS-CoV-2 in environmental samples collected from September 2020-February 2021 in a university that followed CDC reopening guidance.Hyg Environ Health Adv. 2023 Sep;7:100061. doi: 10.1016/j.heha.2023.100061. Epub 2023 May 19. Hyg Environ Health Adv. 2023. PMID: 37305381 Free PMC article.
References
-
- Adams, W.C., 1993. Measurement of Breathing Rate and Volume in Routinely Performed Daily Activities. Final Report. Human Performance Laboratory, Physical Education Department, University of California, Davis. Human Performance Laboratory, Physical Education Department, University of California, Davis. Prepared for the California Air Resources Board, Contract No. A033-205, April 1993.
-
- Atkinson M.P., Wein L.M. Quantifying the routes of transmission for pandemic influenza. Bull. Math. Biol. 2008;70(3):820–867. - PubMed
-
- American Society of Heating Refrigerating and Air-Conditioning Engineers (ASHRAE), 2019. Ventilation for Acceptable Indoor Air Quality, ANSI/ASHRAE Standard 62.1-2019. Atlanta, USA.
-
- Bae S., Kim H., Jung T.Y., Lim J.A., Jo D.H., Kang G.S., Jeong S.H., Choi D.K., Kim H.J., Cheon Y.H., Chun M.K., Kim M., Choi S., Chun C., Shin S.H., Kim H.K., Park Y.J., Park O., Kwon H.J. Epidemiological characteristics of COVID-19 outbreak at fitness centers in Cheonan, Korea. J. Korean Med. Sci. 2020;35(31) - PMC - PubMed
Publication types
MeSH terms
LinkOut - more resources
Full Text Sources
Medical
Miscellaneous
