

Characterization of Cyclic N-Acyliminium Ions by Infrared Ion Spectroscopy
- PMID: 34911145
- PMCID: PMC9302692
- DOI: 10.1002/chem.202104078
Characterization of Cyclic N-Acyliminium Ions by Infrared Ion Spectroscopy
Abstract
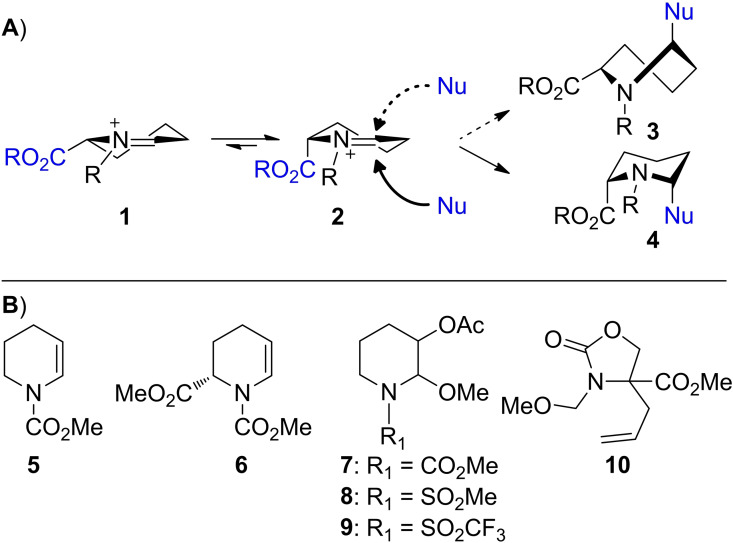
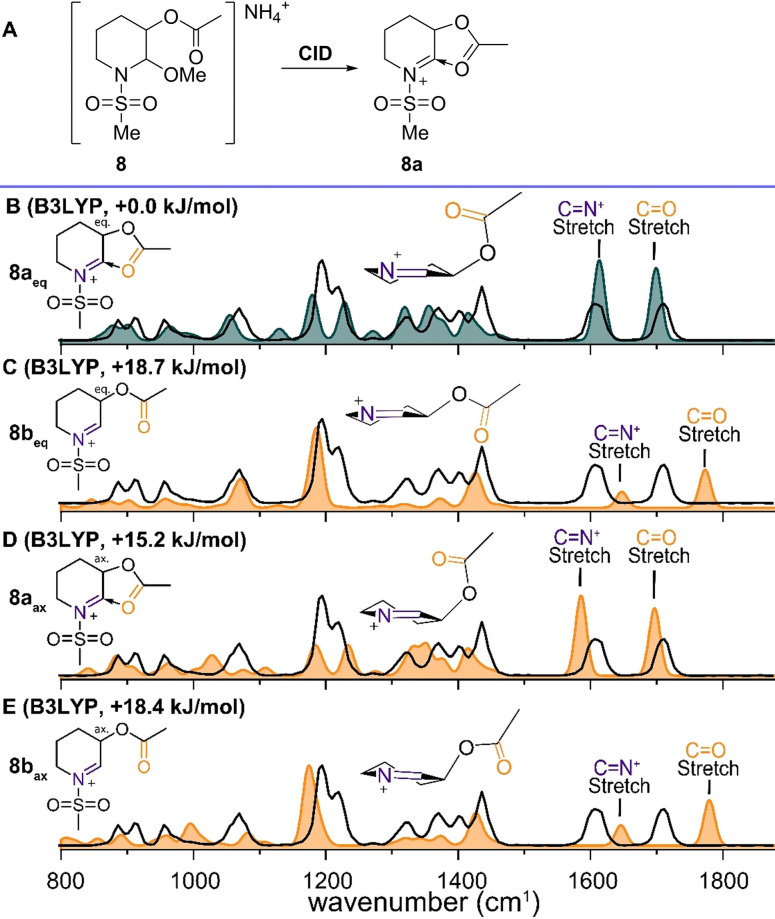
N-Acyliminium ions are highly reactive intermediates that are important for creating CC-bonds adjacent to nitrogen atoms. Here we report the characterization of cyclic N-acyliminium ions in the gas phase, generated by collision induced dissociation tandem mass spectrometry followed by infrared ion spectroscopy using the FELIX infrared free electron laser. Comparison of DFT calculated spectra with the experimentally observed IR spectra provided valuable insights in the conformations of the N-acyliminium ions.
Keywords: DFT calculations; N-acyliminium ion; heterocycles; ion spectroscopy; stereoselectivity.
© 2021 The Authors. Chemistry - A European Journal published by Wiley-VCH GmbH.
Conflict of interest statement
The authors declare no conflict of interest.
Figures


Similar articles
-
Direct Experimental Characterization of Glycosyl Cations by Infrared Ion Spectroscopy.J Am Chem Soc. 2018 May 16;140(19):6034-6038. doi: 10.1021/jacs.8b01236. Epub 2018 May 7. J Am Chem Soc. 2018. PMID: 29656643 Free PMC article.
-
Structural characterization by infrared multiple photon dissociation spectroscopy of protonated gas-phase ions obtained by electrospray ionization of cysteine and dopamine.Anal Bioanal Chem. 2011 Mar;399(7):2463-73. doi: 10.1007/s00216-010-4582-y. Epub 2011 Jan 27. Anal Bioanal Chem. 2011. PMID: 21271241
-
Vibrational spectroscopy of bare and solvated ionic complexes of biological relevance.Mass Spectrom Rev. 2009 May-Jun;28(3):468-94. doi: 10.1002/mas.20215. Mass Spectrom Rev. 2009. PMID: 19241457 Review.
-
Mannich-type reactions in the gas-phase: the addition of enol silanes to cyclic N-acyliminium ions.J Org Chem. 2002 Jul 12;67(14):4652-8. doi: 10.1021/jo016382o. J Org Chem. 2002. PMID: 12098272
-
Enantioselective reactions of N-acyliminium ions using chiral organocatalysts.Chem Asian J. 2013 Dec;8(12):2906-19. doi: 10.1002/asia.201300814. Epub 2013 Sep 12. Chem Asian J. 2013. PMID: 24030776 Review.
Cited by
-
Unusually Chemoselective Photocyclization of 2-(Hydroxyimino)aldehydes to Cyclobutanol Oximes: Synthetic, Stereochemical, and Mechanistic Aspects.J Org Chem. 2022 Nov 4;87(21):13803-13818. doi: 10.1021/acs.joc.2c01503. Epub 2022 Oct 5. J Org Chem. 2022. PMID: 36198009 Free PMC article.
-
Characterization of Elusive Reaction Intermediates Using Infrared Ion Spectroscopy: Application to the Experimental Characterization of Glycosyl Cations.Acc Chem Res. 2022 Jun 21;55(12):1669-1679. doi: 10.1021/acs.accounts.2c00040. Epub 2022 May 26. Acc Chem Res. 2022. PMID: 35616920 Free PMC article. Review.
References
-
- None
-
- Royer J., Bonin M., Micouin L., Chem. Rev. 2004, 104, 2311–2352; - PubMed
-
- Maryanoff B. E., Zhang H.-C., Cohen J. H., Turchi I. J., Maryanoff C. A., Chem. Rev. 2004, 104, 1431–1628; - PubMed
-
- Speckamp W. N., Moolenaar M. J., Tetrahedron 2000, 56, 3817–3856;
-
- Xu Z., Wang Q., Zhu J., J. Am. Chem. Soc. 2015, 137, 6712–6724; - PubMed
MeSH terms
Substances
Grants and funding
- 346 724.011.002/Nederlandse Organisatie voor Wetenschappelijk Onderzoek
- 184.034.022/Nederlandse Organisatie voor Wetenschappelijk Onderzoek
- 2019.062/Nederlandse Organisatie voor Wetenschappelijk Onderzoek
- 758913/ERC_/European Research Council/International
- 715691/ERC_/European Research Council/International
LinkOut - more resources
Full Text Sources
