

Condomless receptive anal intercourse is associated with markers of mucosal inflammation in a cohort of men who have sex with men in Atlanta, Georgia
- PMID: 34911162
- PMCID: PMC8673926
- DOI: 10.1002/jia2.25859
Condomless receptive anal intercourse is associated with markers of mucosal inflammation in a cohort of men who have sex with men in Atlanta, Georgia
Abstract
Introduction: We previously showed that the rectal mucosal immune environment among men who have sex with men (MSM) engaging in condomless receptive anal intercourse (CRAI) is immunologically distinct from that of men who do not engage in anal intercourse (AI). Here, we further examined these differences with quantitative immunohistochemistry to better understand the geographic distribution of immune markers of interest.
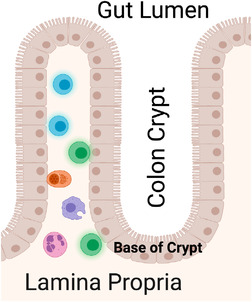
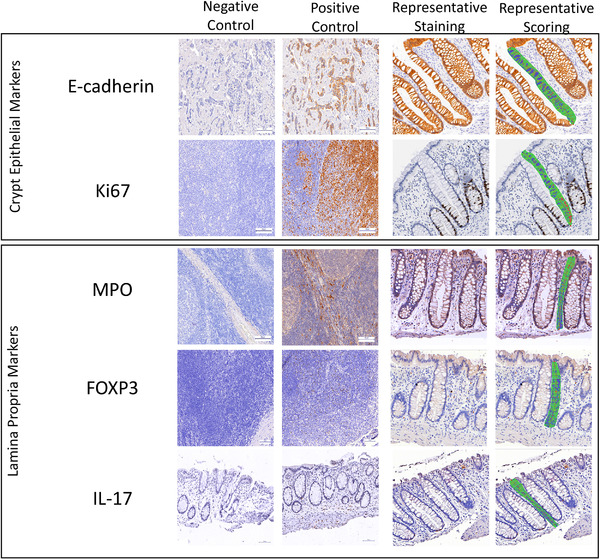
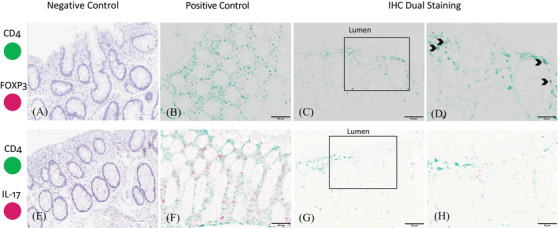
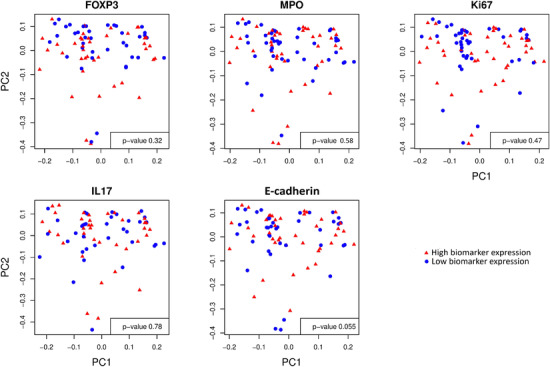
Methods: We enrolled a cohort of MSM engaging in CRAI (n = 41) and men who do not engage in AI (n = 21) between October 2013 and April 2015. Participants were healthy, HIV-negative men aged 18-45 from the metro Atlanta area. We performed rectal mucosal sampling via rigid sigmoidoscopy during two study visits separated by a median of nine weeks and timed with sexual activity for MSM engaging in CRAI. We used standardized, automated immunohistochemistry and quantitative image analysis to investigate the rectal mucosal distribution of neutrophils (MPO), IL-17-producing cells (IL-17) and Tregs (FOXP3) in the lamina propria, and cellular proliferation (Ki67) and adherens junction protein (E-cadherin) in the epithelium. We examined associations between biomarker expression and the rectal mucosal microbiota composition by 16s rRNA sequencing.
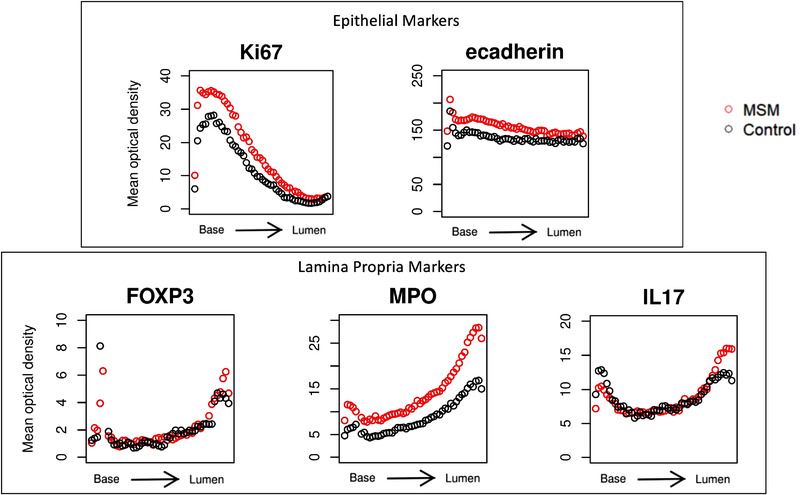
Results: Relative to the colonic crypt base, IL-17, FOXP3, and MPO expression increased towards the rectal lumen, while Ki67 decreased and E-cadherin was more uniformly distributed. Throughout the rectal mucosa distribution examined, MSM engaging in CRAI had higher mean lamina propria MPO expression (p = 0.04) and epithelial Ki67 (p = 0.04) compared to controls. There were no significant differences in IL-17, FOXP3 or E-cadherin expression. We found no significant associations of the five biomarkers with the global rectal microbiota composition or the individual taxa examined.
Conclusions: Understanding the mucosal distribution of inflammatory mediators can enhance our knowledge of the earliest events in HIV transmission. Neutrophil enrichment and crypt epithelial cell proliferation likely represent sub-clinical inflammation in response to CRAI in the rectal mucosa of MSM, which could increase the risk for HIV acquisition. However, the contributory role of the microbiota in mucosal inflammation among MSM remains unclear. HIV prevention may be enhanced by interventions that reduce inflammation or capitalize on the presence of specific inflammatory mechanisms during HIV exposure.
Keywords: HIV transmission; men who have sex with men; microbiome; mucosal immunology; receptive anal intercourse; rectal mucosa.
© 2021 The Authors. Journal of the International AIDS Society published by John Wiley & Sons Ltd on behalf of the International AIDS Society.
Figures
Similar articles
-
Short Communication: Anatomic Site of Sampling and the Rectal Mucosal Microbiota in HIV Negative Men Who Have Sex with Men Engaging in Condomless Receptive Anal Intercourse.AIDS Res Hum Retroviruses. 2018 Mar;34(3):277-281. doi: 10.1089/AID.2017.0206. Epub 2018 Feb 7. AIDS Res Hum Retroviruses. 2018. PMID: 29308654 Free PMC article.
-
The rectal mucosa and condomless receptive anal intercourse in HIV-negative MSM: implications for HIV transmission and prevention.Mucosal Immunol. 2017 Jul;10(4):996-1007. doi: 10.1038/mi.2016.97. Epub 2016 Nov 16. Mucosal Immunol. 2017. PMID: 27848950 Free PMC article.
-
Rectal mucosal inflammation, microbiome, and wound healing in men who have sex with men who engage in receptive anal intercourse.Sci Rep. 2024 Dec 30;14(1):31598. doi: 10.1038/s41598-024-80074-1. Sci Rep. 2024. PMID: 39738273 Free PMC article.
-
Association of nitrite inhalants use and unprotected anal intercourse and HIV/syphilis infection among MSM in China: a systematic review and meta-analysis.BMC Public Health. 2020 Sep 10;20(1):1378. doi: 10.1186/s12889-020-09405-x. BMC Public Health. 2020. PMID: 32912301 Free PMC article.
-
The rectal microbiome: understanding its role in HIV transmission.Curr Opin HIV AIDS. 2025 Mar 1;20(2):159-164. doi: 10.1097/COH.0000000000000906. Epub 2024 Dec 16. Curr Opin HIV AIDS. 2025. PMID: 39773907 Review.
Cited by
-
Nuclear Factor Kappa B p65: A Possible Biomarker for Persistent Inflammation in HIV-1 Infection?Cureus. 2024 Oct 12;16(10):e71308. doi: 10.7759/cureus.71308. eCollection 2024 Oct. Cureus. 2024. PMID: 39529759 Free PMC article. Review.
-
Sexual behavior is linked to changes in gut microbiome and systemic inflammation that lead to HIV-1 infection in men who have sex with men.Commun Biol. 2024 Sep 14;7(1):1145. doi: 10.1038/s42003-024-06816-z. Commun Biol. 2024. PMID: 39277660 Free PMC article.
-
Prevalence and determinants of high-risk human papilloma virus among men who have sex with men in Benin: a cross-sectional study embedded in a demonstration project on pre-exposure prophylaxis against HIV.BMJ Open. 2023 Nov 6;13(11):e074464. doi: 10.1136/bmjopen-2023-074464. BMJ Open. 2023. PMID: 37931972 Free PMC article.
-
The spatial biology of HIV infection.PLoS Pathog. 2025 Jan 24;21(1):e1012888. doi: 10.1371/journal.ppat.1012888. eCollection 2025 Jan. PLoS Pathog. 2025. PMID: 39854613 Free PMC article. Review.
-
Pleasurable and problematic receptive anal intercourse and diseases of the colon, rectum and anus.Nat Rev Gastroenterol Hepatol. 2024 Jun;21(6):377-405. doi: 10.1038/s41575-024-00932-1. Epub 2024 May 19. Nat Rev Gastroenterol Hepatol. 2024. PMID: 38763974 Review.
References
-
- Sullivan PS, Salazar L, Buchbinder S, Sanchez TH. Estimating the proportion of HIV transmissions from main sex partners among men who have sex with men in five US cities. AIDS. 2009;23:1153–62. - PubMed
-
- Centers for Disease Control and Prevention . HIV surveillance report. 2018.
Publication types
MeSH terms
Substances
Grants and funding
LinkOut - more resources
Full Text Sources
Medical
Research Materials
Miscellaneous
