. 2022 Feb 16;60(2):e0178521.
doi: 10.1128/JCM.01785-21. Epub 2021 Dec 15.

Quantitative SARS-CoV-2 Viral-Load Curves in Paired Saliva Samples and Nasal Swabs Inform Appropriate Respiratory Sampling Site and Analytical Test Sensitivity Required for Earliest Viral Detection

Affiliations

Quantitative SARS-CoV-2 Viral-Load Curves in Paired Saliva Samples and Nasal Swabs Inform Appropriate Respiratory Sampling Site and Analytical Test Sensitivity Required for Earliest Viral Detection

Emily S Savela et al. J Clin Microbiol. .

Abstract

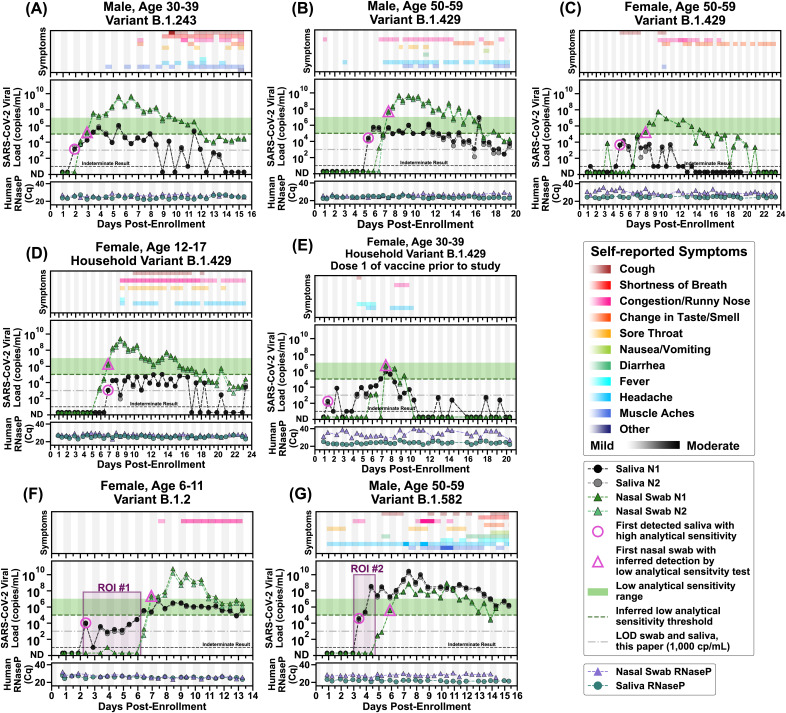
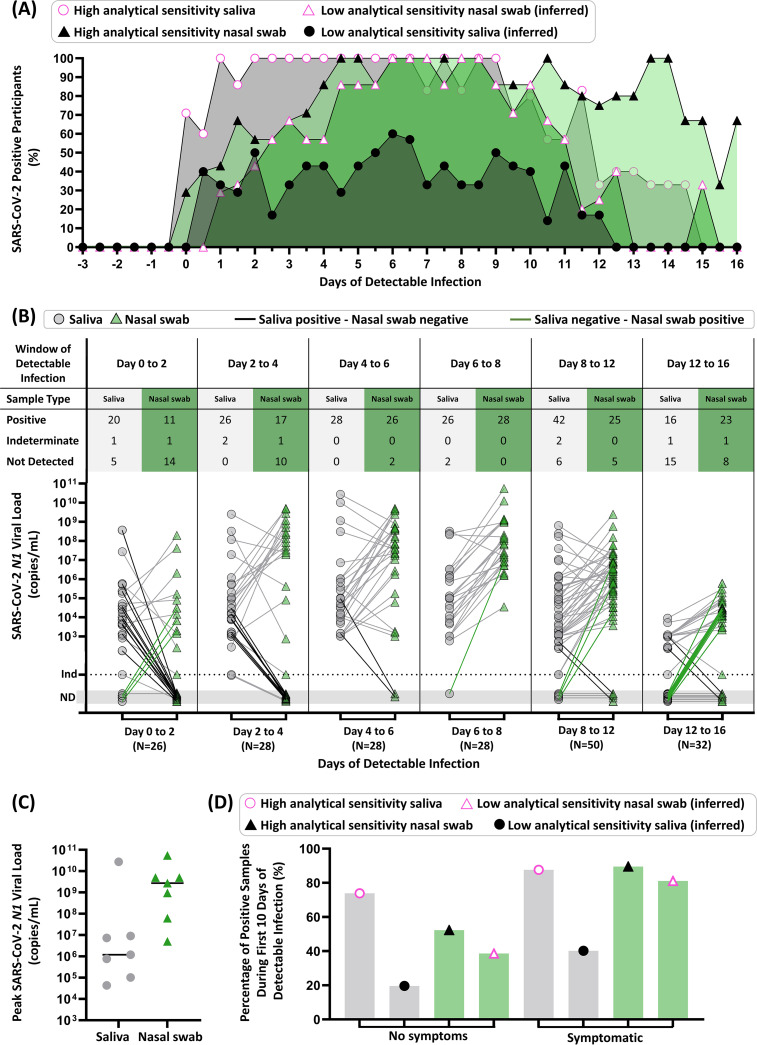
Early detection of SARS-CoV-2 infection is critical to reduce asymptomatic and presymptomatic transmission, curb the spread of variants, and maximize treatment efficacy. Low-analytical-sensitivity nasal-swab testing is commonly used for surveillance and symptomatic testing, but the ability of these tests to detect the earliest stages of infection has not been established. In this study, conducted between September 2020 and June 2021 in the greater Los Angeles County, California, area, initially SARS-CoV-2-negative household contacts of individuals diagnosed with COVID-19 prospectively self-collected paired anterior-nares nasal-swab and saliva samples twice daily for viral-load quantification by high-sensitivity reverse-transcription quantitative PCR (RT-qPCR) and digital-RT-PCR assays. We captured viral-load profiles from the incidence of infection for seven individuals and compared diagnostic sensitivities between respiratory sites. Among unvaccinated persons, testing saliva with a high-analytical-sensitivity assay detected infection up to 4.5 days before viral loads in nasal swabs reached concentrations detectable by low-analytical-sensitivity nasal-swab tests. For most participants, nasal swabs reached higher peak viral loads than saliva but were undetectable or at lower loads during the first few days of infection. High-analytical-sensitivity saliva testing was most reliable for earliest detection. Our study illustrates the value of acquiring early (within hours after a negative high-sensitivity test) viral-load profiles to guide the appropriate analytical sensitivity and respiratory site for detecting earliest infections. Such data are challenging to acquire but critical to designing optimal testing strategies with emerging variants in the current pandemic and to respond to future viral pandemics.

Keywords: COVID-19; RT-qPCR; case-ascertained; diagnostics; household study; longitudinal sampling; nasal swab; presymptomatic; saliva; surveillance; transmission.


Conflict of interest statement

The authors declare a conflict of interest. R.F.I. is a co-founder, consultant, and director and has stock ownership of Talis Biomedical Corp. In addition, R.F.I. is an inventor on a series of patents licensed by the University of Chicago to Bio-Rad Laboratories Inc. in the context of ddPCR.

Figures

FIG 1
FIG 1
SARS-CoV-2 viral-load quantification measured with RT-ddPCR and RT-qPCR. (A) Calibration curves were prepared with contrived saliva and nasal-swab samples. The theoretical SARS-CoV-2 concentration was calculated from a dilution series of contrived samples that were prepared using commercial, inactivated SARS-CoV-2 and commercially available SARS-CoV-2-negative saliva (black circles) or nasal fluid (green triangles) and run with the CDC SARS-CoV-2 RT-qPCR assay. Detailed calibration curves are shown in Fig. S2. (B) Participant nasal-swab or (C) saliva samples positive for SARS-CoV-2 RNA at a range of viral loads were selected. SARS-CoV-2 N1 concentrations (copies/mL) by detection method of RT-ddPCR (gold triangles in panel B, gold circles in panel C) and RT-qPCR (green triangles in panel B, black circles in panel C) are plotted against the geometric mean of RT-qPCR and RT-ddPCR viral-load concentrations (the square root of the product of the two viral-load measurements). A total of 42 nasal swab and 63 saliva samples from study participants were quantified with both methods. The gray line represents x = y. See the supplemental material methods for details of contrived samples, calibration curves, and calculations.
FIG 2
FIG 2
Symptoms and SARS-CoV-2 viral loads in paired saliva and nasal-swab samples of seven participants who became SARS-CoV-2 positive during study participation. (A to G) Self-reported twice-daily symptom data over the course of enrollment are shown as the top panel for each of the participants (see color-coded legend for symptom categories). Details of symptoms are included in the raw data files. Demographic data including any reported medical conditions are included in Table S1. Viral loads are reported for the N1 and N2 genes of SARS-CoV-2 for both saliva (black and gray circles) and nasal-swab samples (dark-green and light-green triangles); ND, not detected for Cqs of ≥40. Samples with an indeterminate result by the CDC RT-qPCR assay are shown along the horizontal black dashed line (see Materials and Methods for details). The limit of detection (LOD) of the assay used for high-analytical-sensitivity measurements is shown with a horizontal gray dashed line. The inferred low-analytical-sensitivity threshold (1.0 × 105 copies/mL) is indicated by the horizontal green dashed line; the low-analytical-sensitivity range (horizontal green bar) is shown. A diagnostic test does not provide reliable detection for samples with viral loads below its LOD. For each participant, the first detected saliva point is emphasized with a pink circle (high analytical sensitivity), and the first nasal-swab point with a viral-load concentration at or above 1.0 × 105 copies/mL (low-analytical-sensitivity threshold) is emphasized with a pink triangle. Vertical shading in gray indicates nighttime (8 pm to 8 am). Internal controls of RNase P gene Cqs from the CDC primer set are provided for each sample to compare self-sampling consistency and sample integrity (failed samples, where RNase P Cq is ≥40, are not plotted). Participant sex, age range, and SARS-CoV-2 variant are given in each panel’s title. Two regions of interest (ROI) are indicated by purple-shaded rectangles and discussed in the main text.
FIG 3
FIG 3
Summary of diagnostic insights from study participants who became infected with SARS-CoV-2 while enrolled in the study. (A) Participant infection time courses were aligned to the first high-sensitivity (LOD of ≤1 × 103 copies/mL) positive result from either saliva or nasal-swab sample type (day 0), and the percentage of positive tests was calculated for each time point (0.5-day intervals) from the first positive sample. The predicted performance of nasal swabs or saliva with low analytical sensitivity was determined using the SARS-CoV-2 N1 viral-load values for each participant shown in Fig. 2, above a viral-load threshold of 1.0 × 105 copies/mL, entering the low-analytical-sensitivity range. We show the percentage of participants who were detected by our high-analytical-sensitivity saliva test (pink circle), high-analytical-sensitivity nasal-swab test (black triangle), or that could be inferred to be detectable by a low-analytical-sensitivity test nasal-swab (pink triangle) or saliva test (black circle) at a given time point. (B) Quantitative SARS-CoV-2 N1 viral loads of paired samples collected during time windows of the infection (aligned to first positive result by high-sensitivity testing of either sample type) are shown for saliva (gray circles) and nasal swabs (green triangles). Paired samples for a given time point are connected with gray lines, with emphasis on paired samples where only saliva (black connecting line) or nasal swab (green connecting line) was positive. ND, not detected; Ind, indeterminate result. (C) Peak SARS-CoV-2 N1 viral loads measured in saliva (gray circles) and nasal swab (green triangles) for each of the seven participants are shown. Horizontal black line indicates the median. (D) Percentage of positive samples (out of all samples of that type and symptom status) are shown for the first 10 days of detectable infection for each participant. Saliva (gray bars with circles) and nasal swab (green bars with triangles) are shown. Positivity by a high-analytical-sensitivity test was observed by our assay, while positivity by a low-analytical-sensitivity test was inferred if the sample had a viral load above 1.0 × 105 copies/mL. The symptom status was classified as symptomatic if the participant reported one or more COVID-19-like symptoms at the time of sample collection. Details of the data analysis are included in the supplemental material methods.

Update of

References

    1. Johansson MA, Quandelacy TM, Kada S, Prasad PV, Steele M, Brooks JT, Slayton RB, Biggerstaff M, Butler JC. 2021. SARS-CoV-2 transmission from people without COVID-19 symptoms. JAMA Netw Open 4:e2035057. 10.1001/jamanetworkopen.2020.35057. - DOI - PMC - PubMed
    1. WHO. 2021. Recommendations for national SARS-CoV-2 testing strategies and diagnostic capacities. https://apps.who.int/iris/bitstream/handle/10665/342002/WHO-2019-nCoV-la....
    1. Scientific Advisory Group for Emergencies (SAGE). 2021. Consensus statement from the Scientific Pandemic Influenza Group on Modelling, Operational sub-group (SPI-M-O) for the Scientific Advisory Group for Emergencies (SAGE). https://www.gov.uk/government/publications/spi-m-o-consensus-statement-o....
    1. Li B, Deng S, Li K, Hu Y, Li Z, Xiong Q, Liu Z, Guo Q, Zou L, Zhang H, Zhang M, Ouyang F, Su J, Su W, Xu J, Lin H, Sun J, Peng J, Jiang H, Zhou P, Hu T, Luo M, Zhang Y, Zheng H, Xiao J, Liu T, Che R, Zeng H, Zheng Z, Huang Y, Yu J, Yu L, Wu J, Chen J, Zhong H, Deng X, Kang M, Pybus OG, Lythgoe KA, Li Y, Yuan J, He J, Lu J. 2021. Viral infection and transmission in a large, well-traced outbreak caused by the SARS-CoV-2 Delta variant. medRxiv 10.1101/2021.07.07.21260122. - DOI - PMC - PubMed
    1. Fisman DN, Tuite AR. 2021. Progressive increase in virulence of novel SARS-CoV-2 variants in Ontario, Canada. medRxiv 10.1101/2021.07.05.21260050. - DOI - PMC - PubMed

Publication types