. 2021 Dec 15;22(1):900.
doi: 10.1186/s12864-021-08209-6.

Mapping pre-harvest sprouting resistance loci in AAC Innova × AAC Tenacious spring wheat population

Affiliations

Mapping pre-harvest sprouting resistance loci in AAC Innova × AAC Tenacious spring wheat population

Raman Dhariwal et al. BMC Genomics. .

Abstract

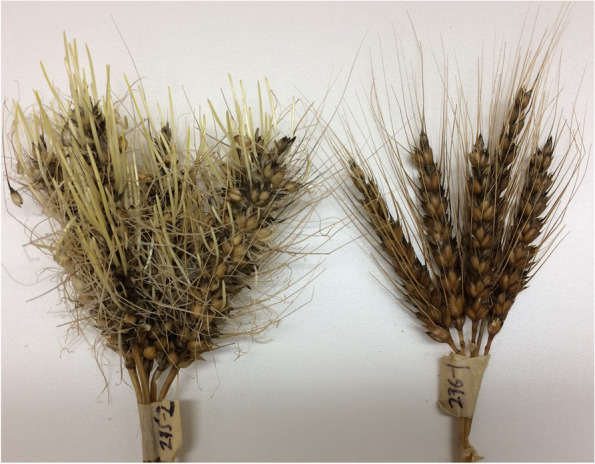
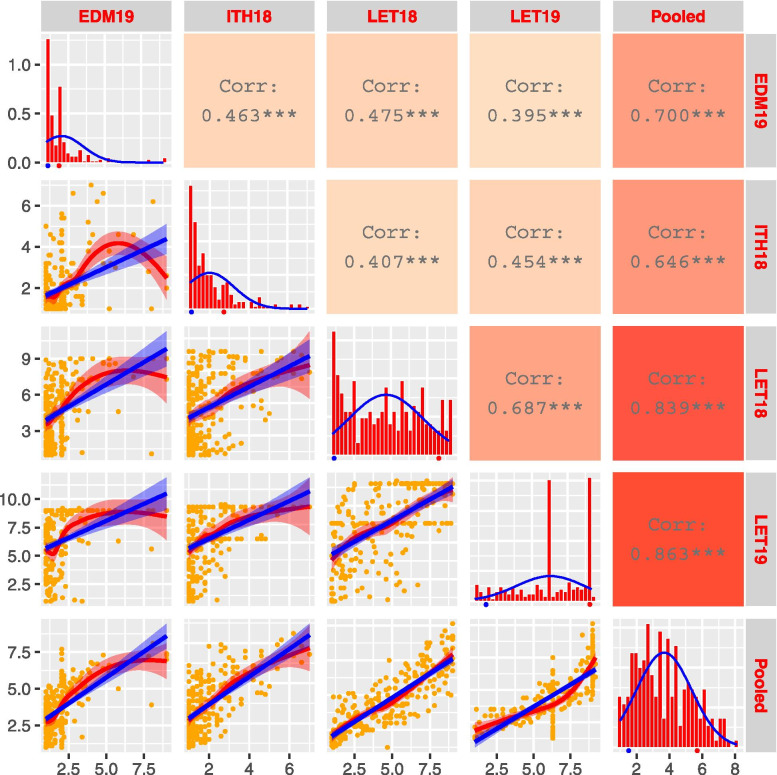
Background: Pre-harvest sprouting (PHS) is a major problem for wheat production due to its direct detrimental effects on wheat yield, end-use quality and seed viability. Annually, PHS is estimated to cause > 1.0 billion USD in losses worldwide. Therefore, identifying PHS resistance quantitative trait loci (QTLs) is crucial to aid molecular breeding efforts to minimize losses. Thus, a doubled haploid mapping population derived from a cross between white-grained PHS susceptible cv AAC Innova and red-grained resistant cv AAC Tenacious was screened for PHS resistance in four environments and utilized for QTL mapping.

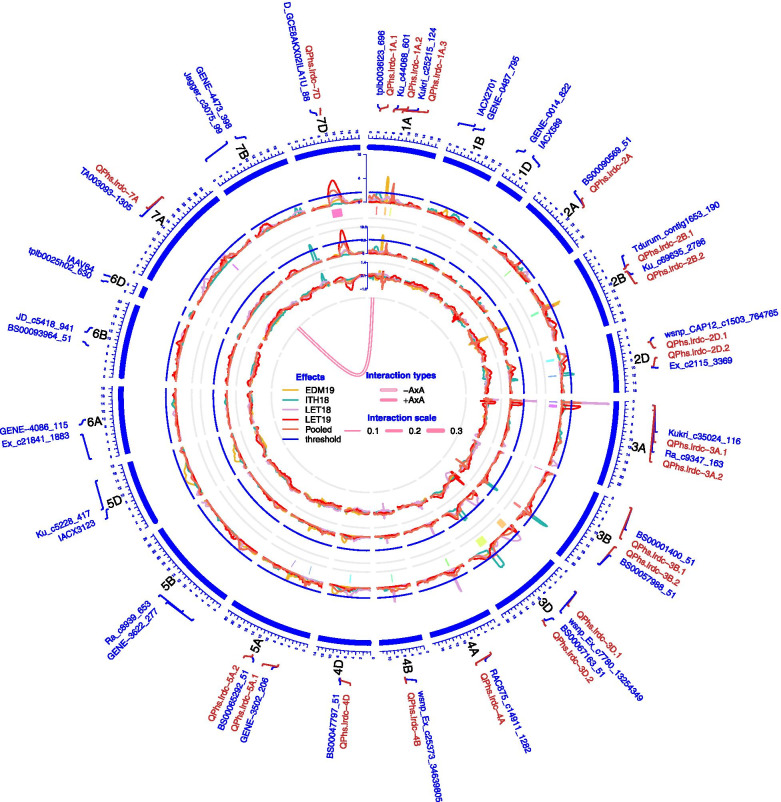
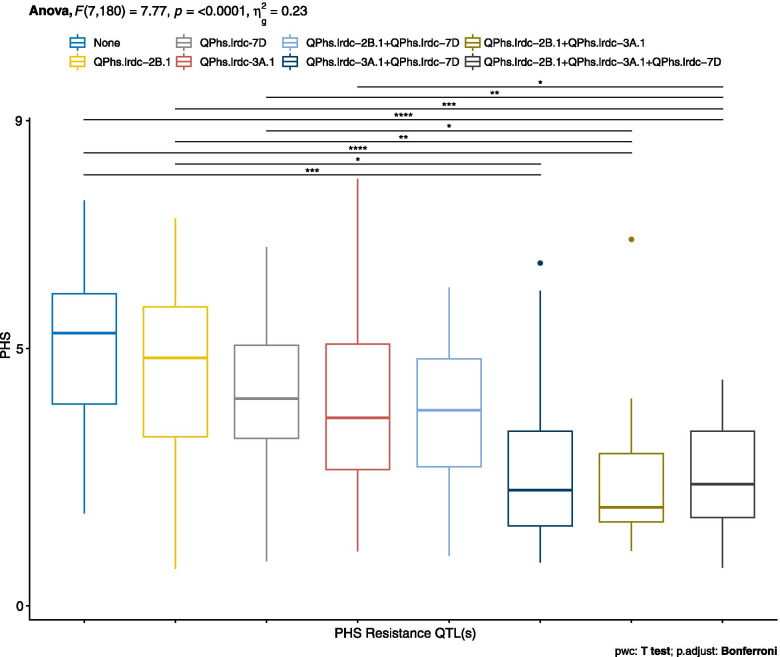
Results: Twenty-one PHS resistance QTLs, including seven major loci (on chromosomes 1A, 2B, 3A, 3B, 3D, and 7D), each explaining ≥10% phenotypic variation for PHS resistance, were identified. In every environment, at least one major QTL was identified. PHS resistance at most of these loci was contributed by AAC Tenacious except at two loci on chromosomes 3D and 7D where it was contributed by AAC Innova. Thirteen of the total twenty-one identified loci were located to chromosome positions where at least one QTL have been previously identified in other wheat genotype(s). The remaining eight QTLs are new which have been identified for the first time in this study. Pedigree analysis traced several known donors of PHS resistance in AAC Tenacious genealogy. Comparative analyses of the genetic intervals of identified QTLs with that of already identified and cloned PHS resistance gene intervals using IWGSC RefSeq v2.0 identified MFT-A1b (in QTL interval QPhs.lrdc-3A.1) and AGO802A (in QTL interval QPhs.lrdc-3A.2) on chromosome 3A, MFT-3B-1 (in QTL interval QPhs.lrdc-3B.1) on chromosome 3B, and AGO802D, HUB1, TaVp1-D1 (in QTL interval QPhs.lrdc-3D.1) and TaMyb10-D1 (in QTL interval QPhs.lrdc-3D.2) on chromosome 3D. These candidate genes are involved in embryo- and seed coat-imposed dormancy as well as in epigenetic control of dormancy.

Conclusions: Our results revealed the complex PHS resistance genetics of AAC Tenacious and AAC Innova. AAC Tenacious possesses a great reservoir of important PHS resistance QTLs/genes supposed to be derived from different resources. The tracing of pedigrees of AAC Tenacious and other sources complements the validation of QTL analysis results. Finally, comparing our results with previous PHS studies in wheat, we have confirmed the position of several major PHS resistance QTLs and candidate genes.

Keywords: Epistasis interactions; Genetic and epigenetic factors; Phytohormones; Seed coat color; Seed dormancy.


Conflict of interest statement

The authors declare that they have no competing interests.

Figures

Fig. 1
Fig. 1
Pre-harvest sprouting (PHS) phenotypes of population parents after 4 days in a mist chamber. PHS-susceptible cultivar AAC Innova is shown on left-hand side while PHS-resistant cultivar AAC Tenacious is shown on right-hand side
Fig. 2
Fig. 2
Frequency distribution and correlation scatterplots for pre-harvest sprouting (PHS) score of doubled haploid (DH) lines. Frequency distribution histograms with normal distribution curve (blue line) for PHS of DH lines grown at Edmonton 2019 (EDM19), Ithaca 2018 (ITH18), Lethbridge 2018 (LET18) and Lethbridge 2019 (LET19) as well as pooled data are shown on main diagonal. The means of the parental genotypes AAC Tenacious and AAC Innova are indicated by blue and red dots, respectively, beneath frequency distribution plots. Scatterplots with regression lines, linear (blue) and exponential (red), for each environment pair are shown on the left side of the main diagonal. Orange dots on scatterplots represent PHS score of DH lines. Correlation coefficients (r) between each pair of environments, and each environment and the pooled data are displayed on the right side of the main diagonal. Color intensity (light red to dark red) on r boxes indicate the depth of association between environments under evaluation
Fig. 3
Fig. 3
Circos diagram. Complete results of quantitative trait loci (QTL) and epistasis interaction identified for pre-harvest sprouting (PHS) resistance from AAC Innova/AAC Tenacious doubled haploid mapping population using composite interval mapping are shown in Circos diagram. The outermost track shows the 21 chromosomes (1A -7D) arranged in clockwise direction with PHS resistance QTLs (in red color font) and their linked or few randomly selected markers (in blue color font) in 0.1X scale (cM). Three inner tracks and line connections in the middle, respectively, represent the mean LOD score (second track from outside), % phenotypic variation (R2) explained (third track from outside), additive effect (AE) (fourth track from outside) of individual QTLs and epistatic effect (AA) of digenic QTL × QTL interactions (line connection in the middle) for PHS resistance in different environments. In the second and third tracks from outside, blue lines show a LOD threshold of 2.5 and R2 threshold of 10%, respectively. QTL confidence intervals are shown in different colors beneath the QTL scans in second track from outside. LOD score, % R2 and AE peaks for different environments are represented by different colors as shown in the effects legend in the middle of the Circos diagram. A negative QTL × QTL interaction between QTLs QPhs.lrdc-1A.1 and QPhs.lrdc-7A, on chromosomes 1A and 7A, is shown as line connection in the middle of the Circos diagram. The width of the line connection represent the strength of AA effect, as shown in the AA interaction scale
Fig. 4
Fig. 4
Boxplot distributions of pre-harvest sprouting (PHS) score in doubled haploid (DH) population. All DH lines produced from the cross AAC Innova/AAC Tenacious were grouped into eight different genotypic (QTL) classes based on three major QTLs QPhs.lrdc-2B.1, QPhs.lrdc-3A.1 and QPhs.lrdc-7D. Effects of positive alleles of single QTL and their combinations on average PHS score are represented alongside negative alleles at all three loci using the pooled phenotypic data (average of all environments). Statistically significant differences among QTLs/QTL combinations were calculated by ANOVA, pairwise T test with Bonferroni corrections and shown by asterisk. Quartiles and medians are represented by boxes and continuous lines, respectively. Whiskers extend to the farthest points that are not outliers, whilst outliers are shown as dots
Fig. 5
Fig. 5
Boxplot distributions of pre-harvest sprouting (PHS) score in population divided into photoperiod-insensitive vs -sensitive groups. All DH lines produced from the cross AAC Innova/AAC Tenacious were grouped into two genotypic classes, photoperiod-insensitive (Ppd-D1a) and -sensitive (Ppd-D1b), based on the domestication allele of the photoperiod gene Ppd-D1. Ppd-D1 is an important candidate gene for QPhs.lrdc-2D.1 QTL on chromosome 2D. Effects of domestication alleles of Ppd-D1 on average PHS score are presented using the pooled phenotypic data (average of all environments). Photoperiod-sensitive allele Ppd-D1b significantly reduced PHS in AAC Innova/AAC Tenacious DH population. Statistically significant difference between alleles is calculated by ANOVA, pairwise T test with Bonferroni corrections and shown by asterisk. Quartiles and medians are represented by boxes and continuous lines, respectively. Whiskers extend to the farthest points that are not outliers

References

    1. Ali A, Cao J, Jiang H, Chang C, Zhang H-P, Sheikh SW, Shah L, Ma C. Unraveling molecular and genetic studies of Wheat (Triticum aestivum L.) resistance against factors causing pre-harvest sprouting. Agronomy. 2019;9(3):117.
    1. Nakamura S, Abe F, Kawahigashi H, Nakazono K, Tagiri A, Matsumoto T, Utsugi S, Ogawa T, Handa H, Ishida H, et al. A wheat homolog of MOTHER OF FT AND TFL1 acts in the regulation of germination. Plant Cell. 2011;23(9):3215–3229. - PMC - PubMed
    1. Morgan G. Texas Co-operative Extension E-336. 2005. Pre-harvest sprouting in wheat.
    1. Torada A, Ikeguchi S, Koike M. Mapping and validation of PCR-based markers associated with a major QTL for seed dormancy in wheat. Euphytica. 2005;143(3):251–255.
    1. Singh M, Singh S, Randhawa H, Singh J. Polymorphic homoeolog of key gene of RdDM pathway, ARGONAUTE4_9 class is associated with pre-harvest sprouting in wheat (Triticum aestivum L.) PLoS One. 2013;8(10):e77009. - PMC - PubMed

LinkOut - more resources