. 2022 Apr 1;12(4):1022-1045.
doi: 10.1158/2159-8290.CD-20-1265.

Ontogeny and Vulnerabilities of Drug-Tolerant Persisters in HER2+ Breast Cancer

Affiliations

Ontogeny and Vulnerabilities of Drug-Tolerant Persisters in HER2+ Breast Cancer

Chewei Anderson Chang et al. Cancer Discov. .

Abstract

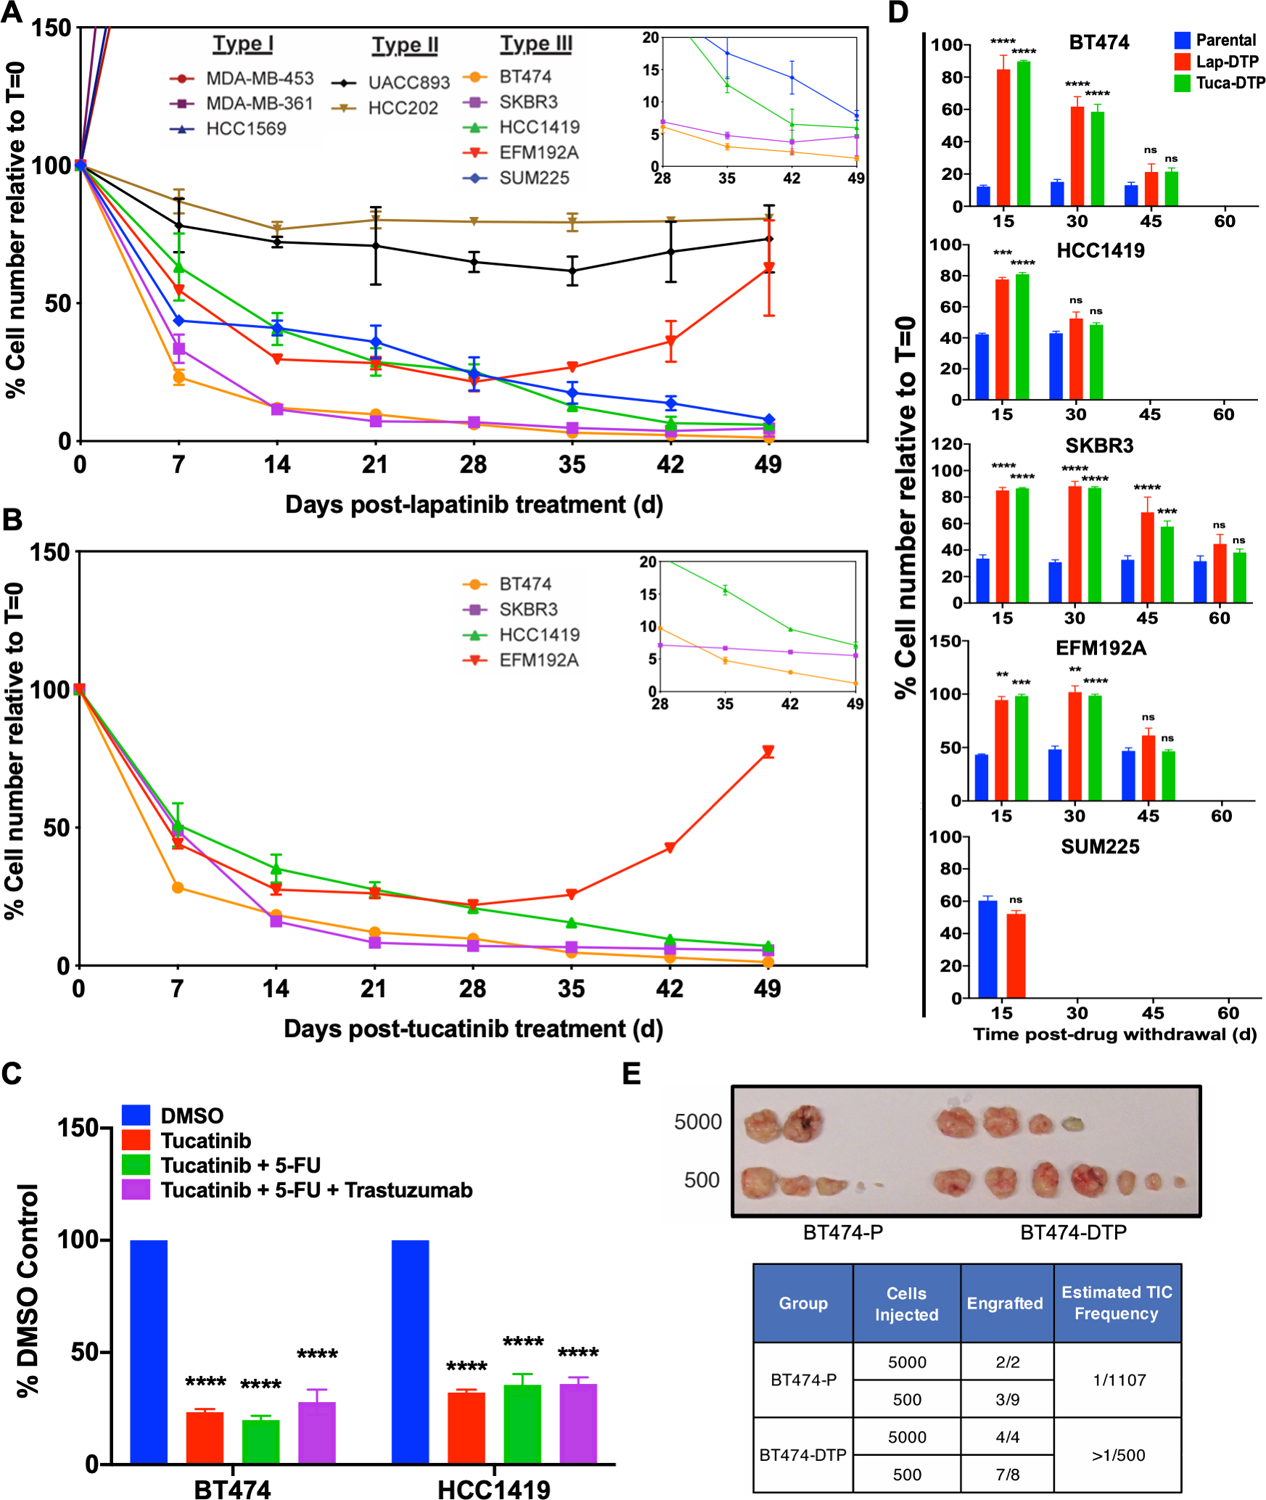
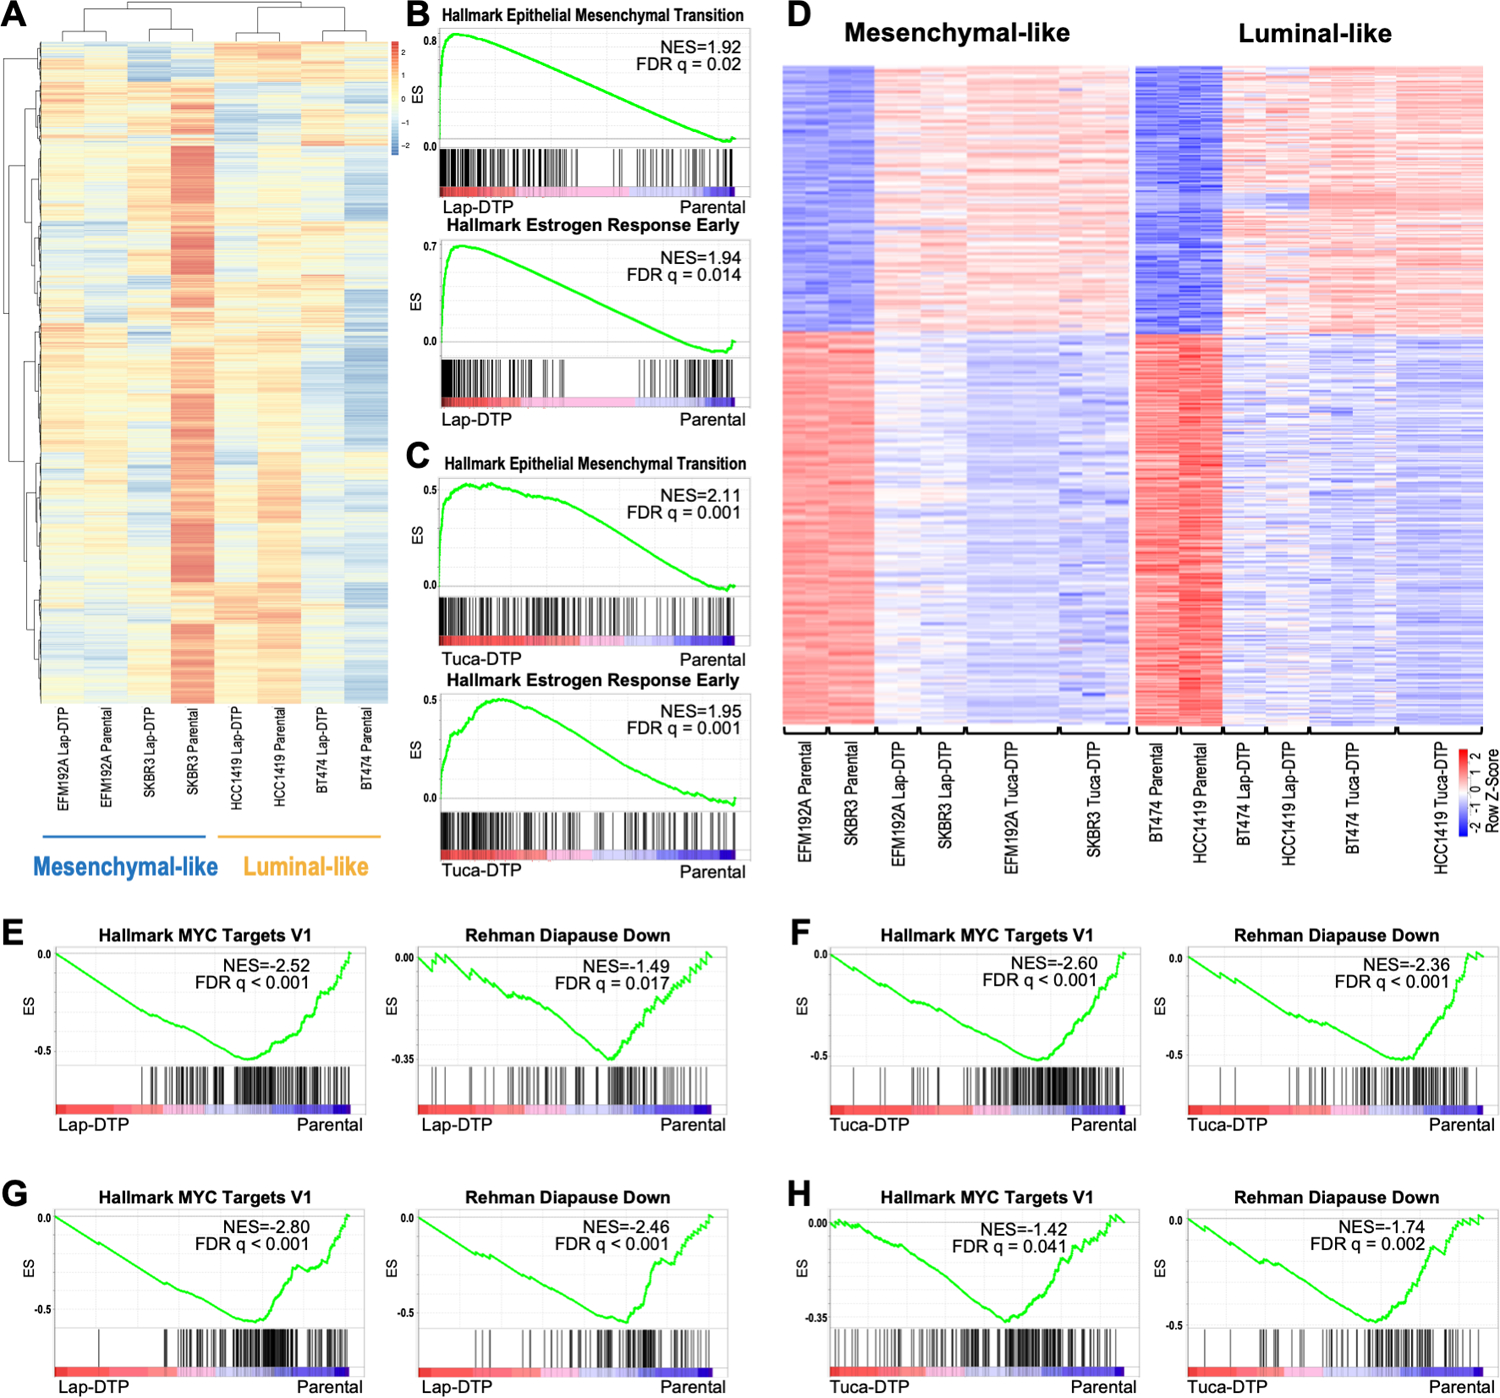
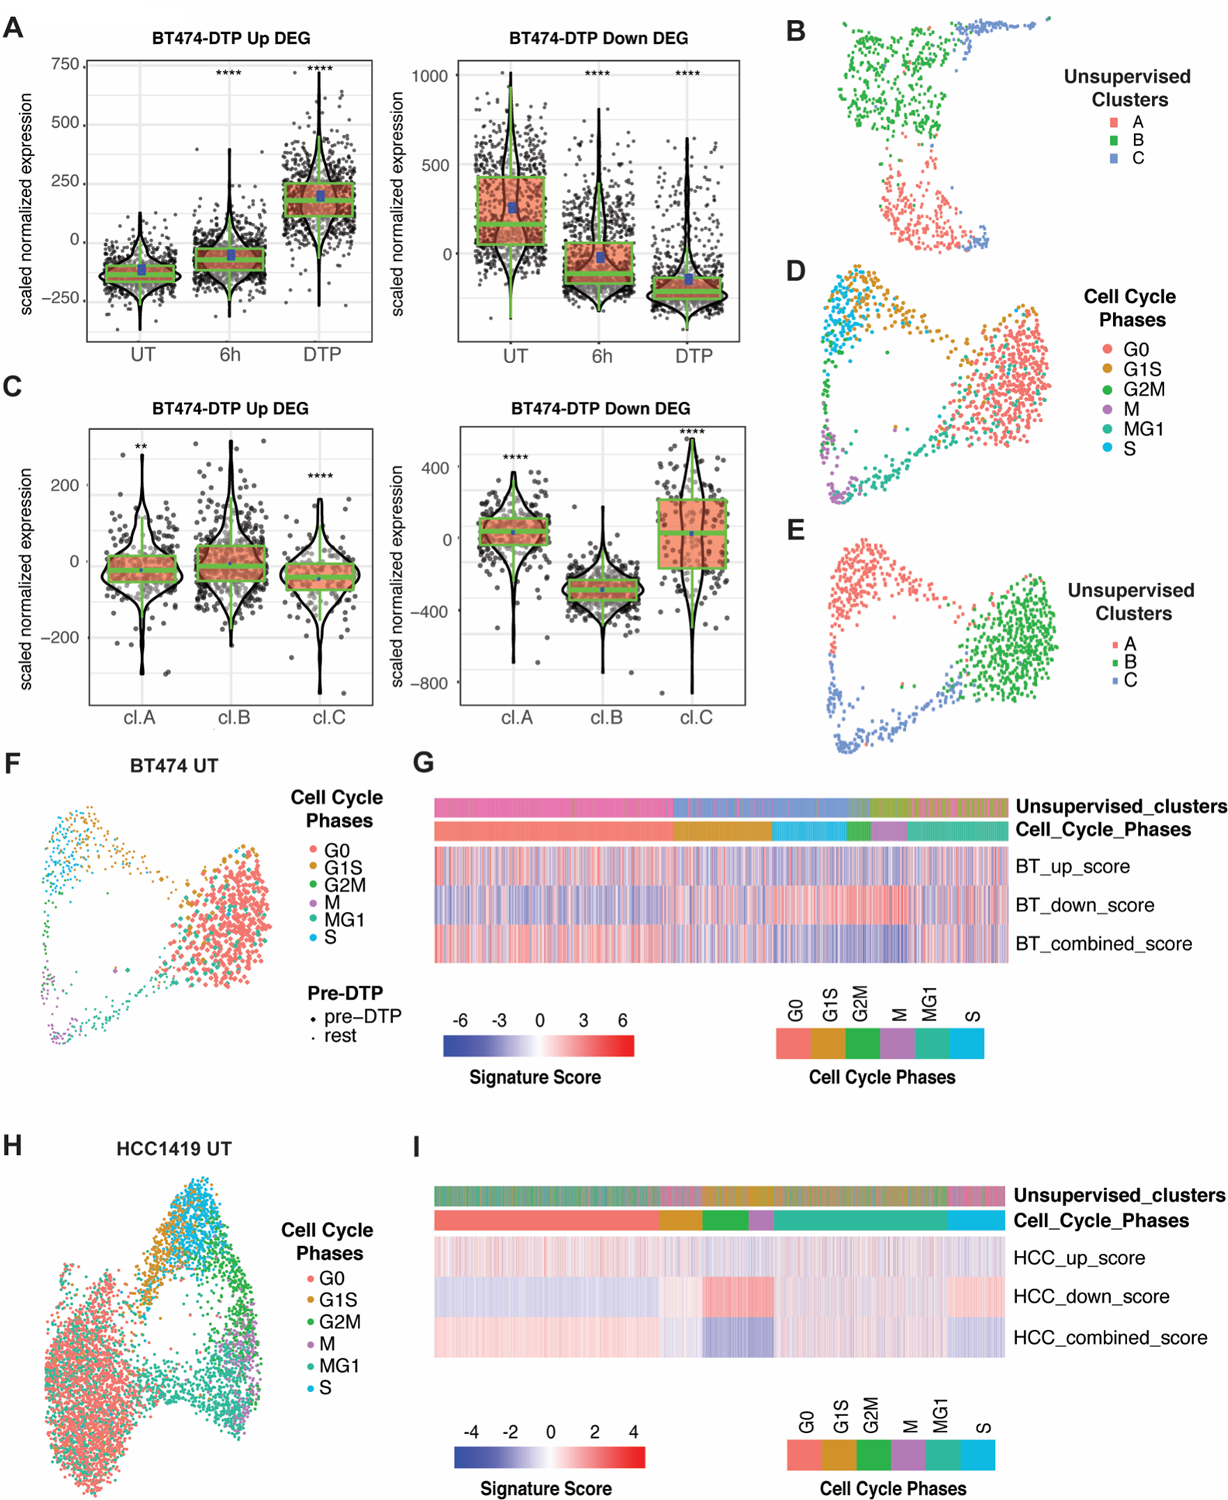
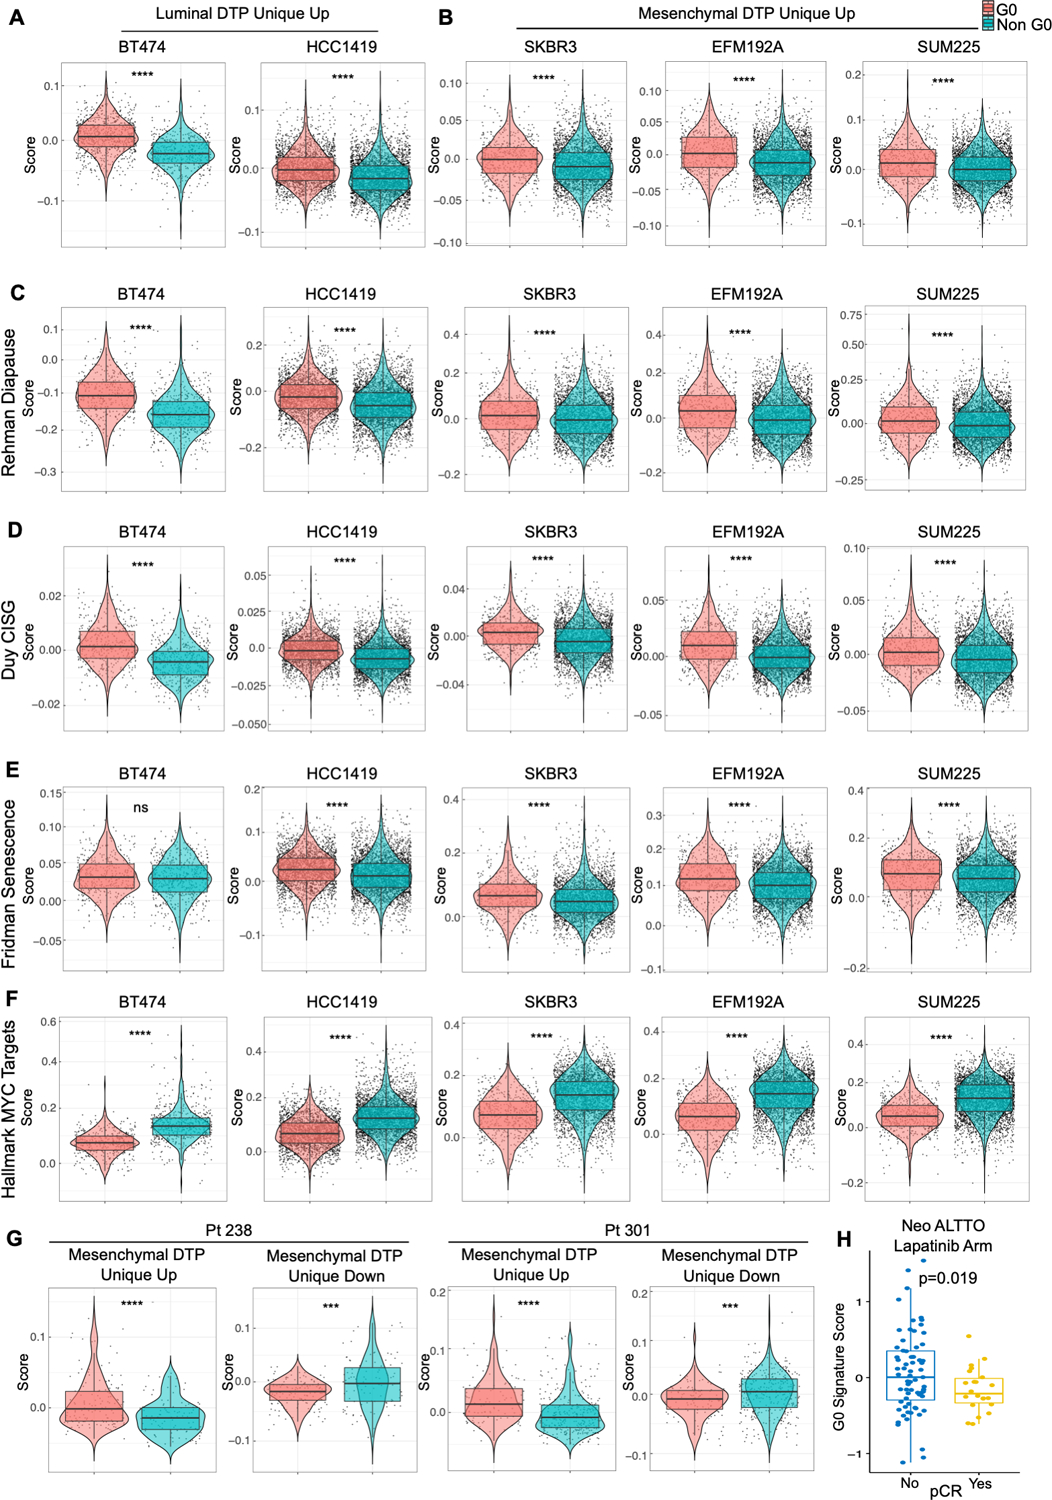
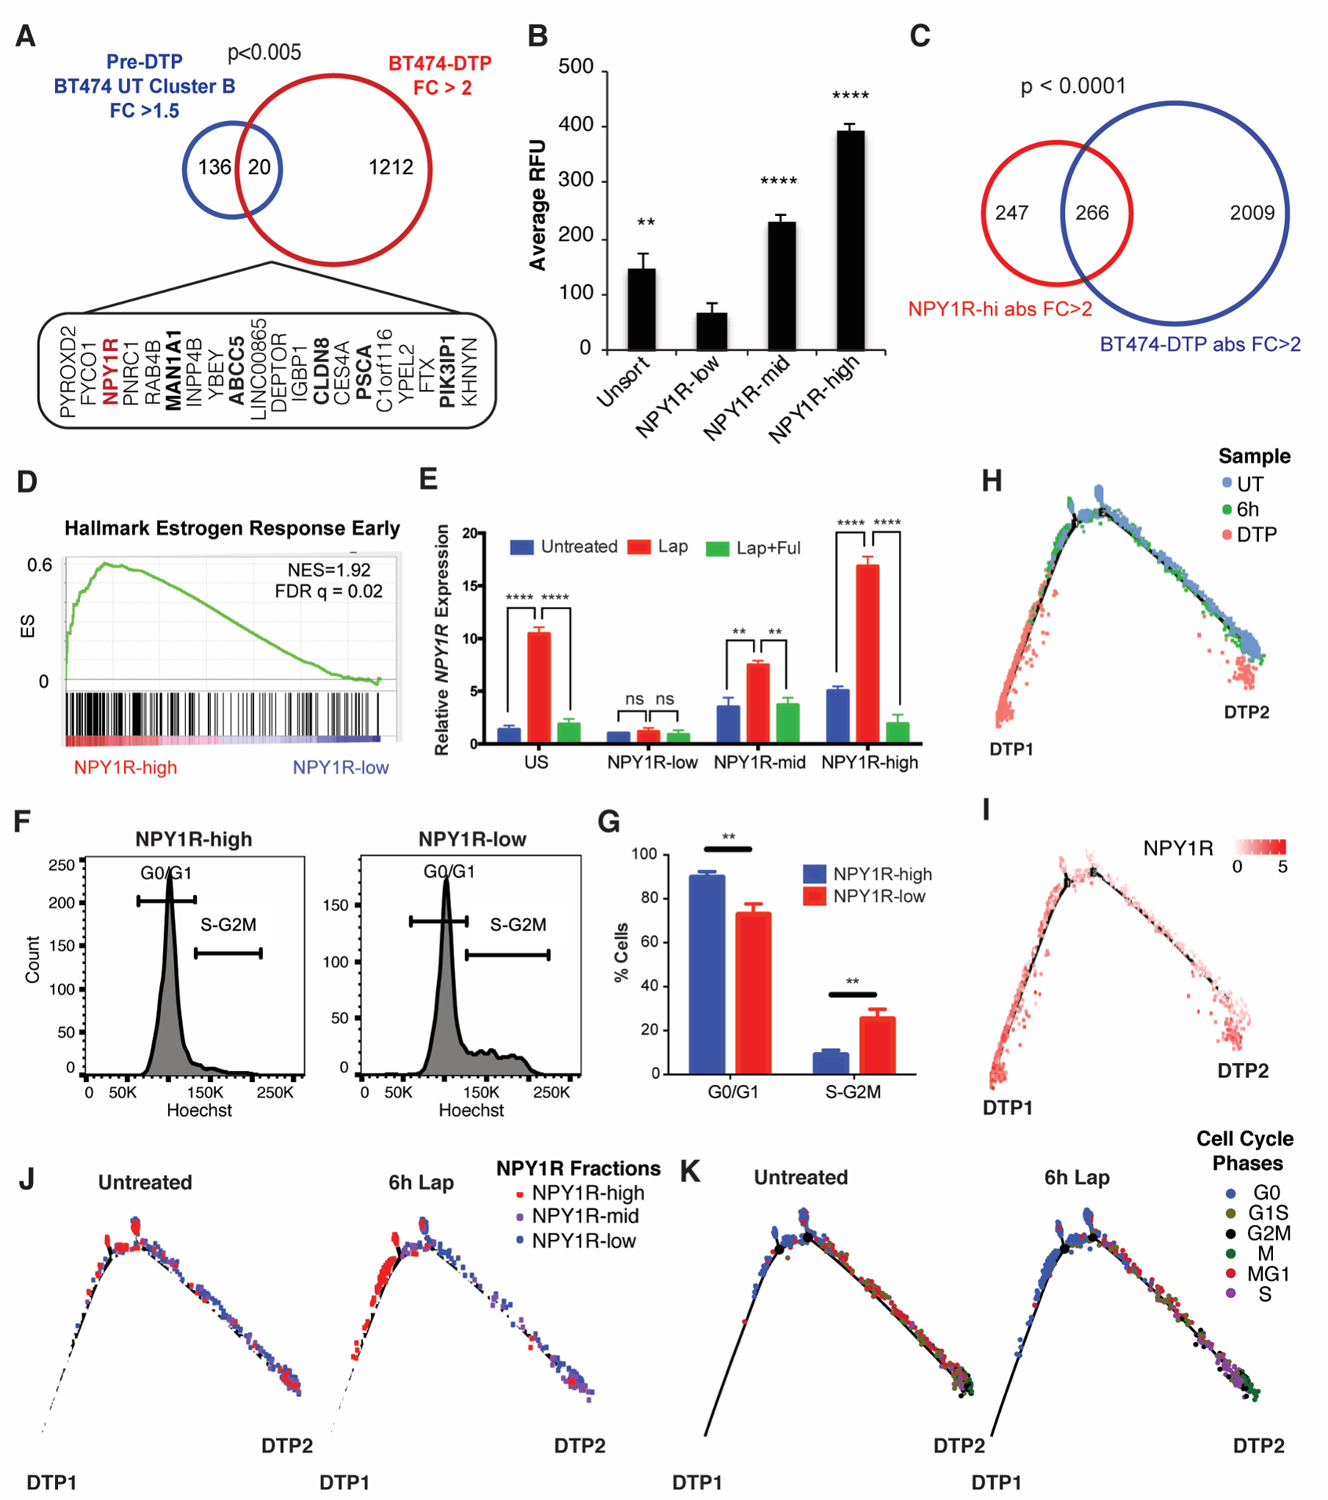
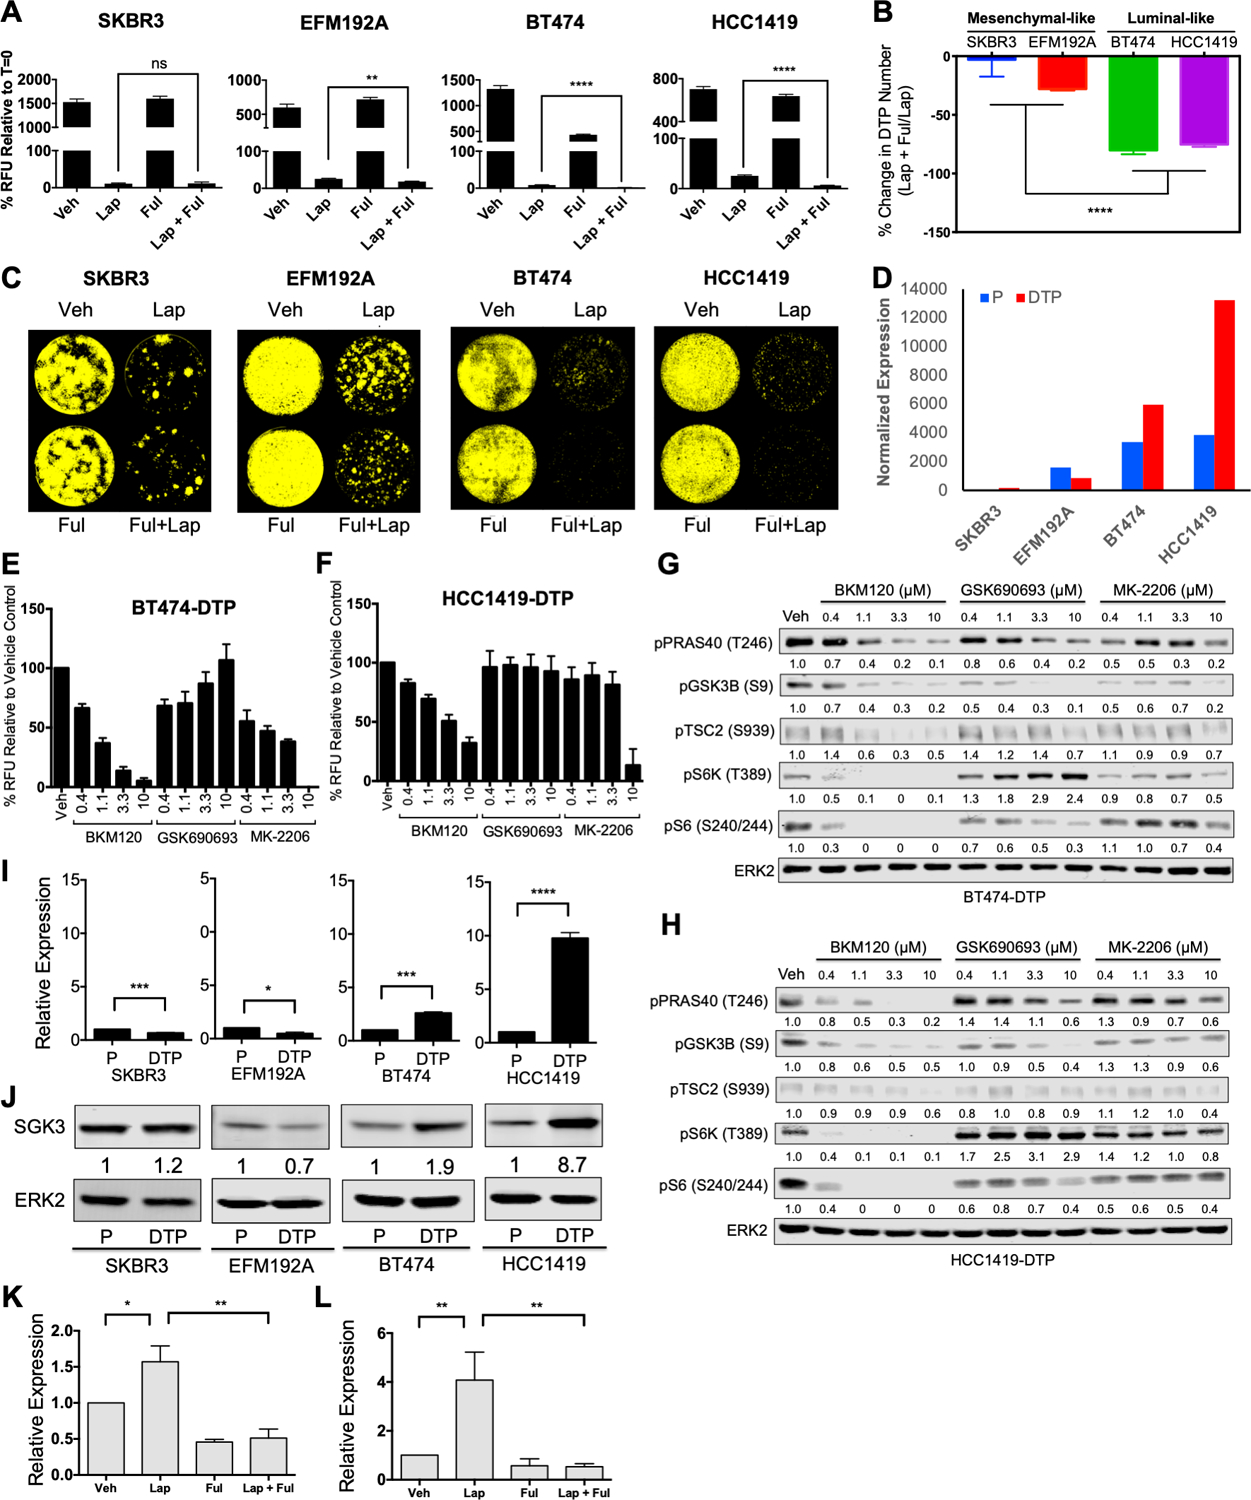
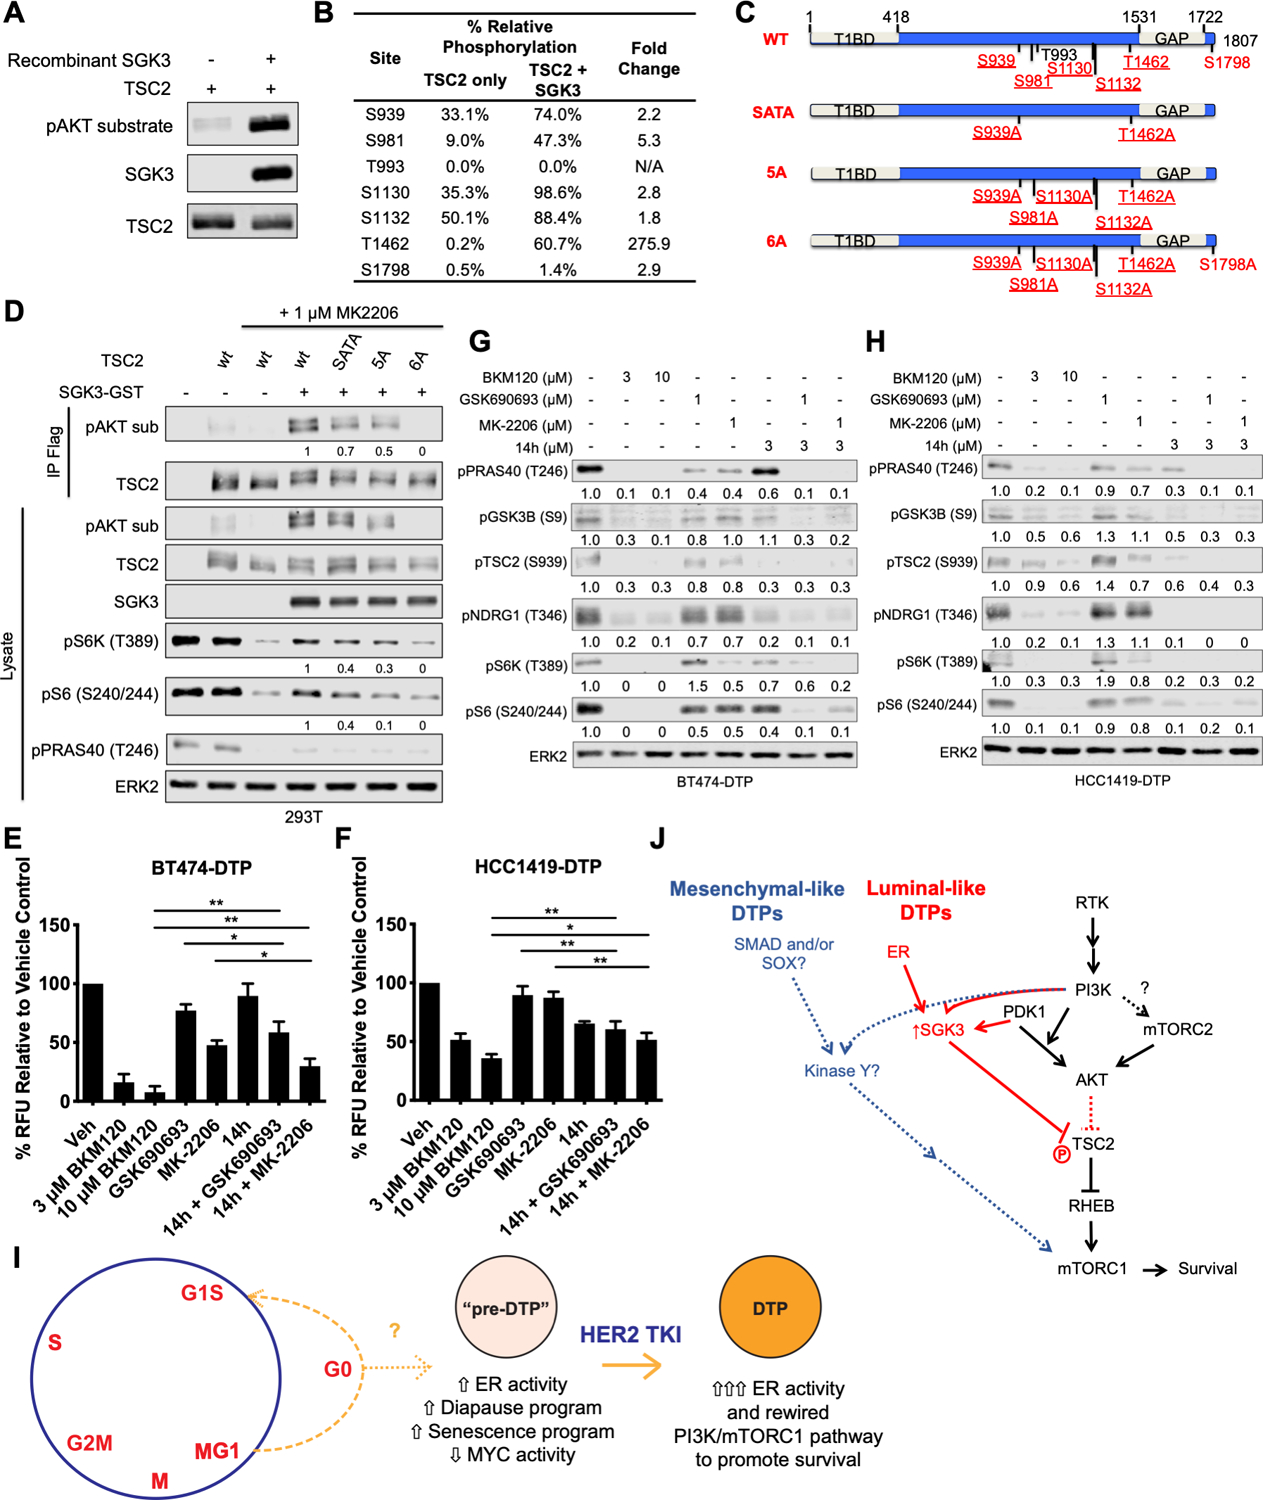
Resistance to targeted therapies is an important clinical problem in HER2-positive (HER2+) breast cancer. "Drug-tolerant persisters" (DTP), a subpopulation of cancer cells that survive via reversible, nongenetic mechanisms, are implicated in resistance to tyrosine kinase inhibitors (TKI) in other malignancies, but DTPs following HER2 TKI exposure have not been well characterized. We found that HER2 TKIs evoke DTPs with a luminal-like or a mesenchymal-like transcriptome. Lentiviral barcoding/single-cell RNA sequencing reveals that HER2+ breast cancer cells cycle stochastically through a "pre-DTP" state, characterized by a G0-like expression signature and enriched for diapause and/or senescence genes. Trajectory analysis/cell sorting shows that pre-DTPs preferentially yield DTPs upon HER2 TKI exposure. Cells with similar transcriptomes are present in HER2+ breast tumors and are associated with poor TKI response. Finally, biochemical experiments indicate that luminal-like DTPs survive via estrogen receptor-dependent induction of SGK3, leading to rewiring of the PI3K/AKT/mTORC1 pathway to enable AKT-independent mTORC1 activation.

Significance: DTPs are implicated in resistance to anticancer therapies, but their ontogeny and vulnerabilities remain unclear. We find that HER2 TKI-DTPs emerge from stochastically arising primed cells ("pre-DTPs") that engage either of two distinct transcriptional programs upon TKI exposure. Our results provide new insights into DTP ontogeny and potential therapeutic vulnerabilities. This article is highlighted in the In This Issue feature, p. 873.


Conflict of interest statement

Competing interests: B.G.N. is a founder of, shareholder in, and receives consulting fees from Navire Pharma and Jengu Therapeutics, and is a founder of, and shareholder in, Northern Biologics, LP. He has a sponsored research agreement with Mirati Therapeutics, receives consulting fees and equity from Arvinas, Inc., holds equity in Recursion Pharma, and received consulting fees from MPM Capital and Gerson Lehrman Group. He also is an expert witness for Johnson and Johnson in the federal talc litigation. His spouse holds equity in Amgen, Inc. and held equity in Moderna and Regeneron at times during this study. J.M. is a founder and shareholder in Northern Biologics, LP, and Pionyr Immunotherapeutics, and is an advisor and shareholder of Century Therapeutics and Aelian Biotechnology. K.K.W. is a founder of and equity holder in G1 Therapeutics and has sponsored research agreements with Takeda, BMS, Mirati, Merus, Alkermes, Ansun Biopharma, Tvardi Therapeutics, Delfi Diagnostics, and Dracen Pharmaceuticals. He has consulting agreements with AstraZeneca, Novartis, Merck, Recursion, Navire, Prelude and Ono and has consulting & sponsored research agreements with Janssen, Pfizer, and Zentalis. S.A. has uncompensated consulting or advisory roles with Bristol Meyers Squibb, Genentech, and Merck as well as research funding to her institution from Amgen, Bristol Meyers Squibb, Celgene, Genentech, Merck, Daiichi, and Novartis. No disclosures were reported by the other authors. C.A.C. is an employee of AbbVie.

Figures

Figure 1.
Figure 1.. Some HER2+ breast cancer cell lines give rise to HER2 TKI drug-tolerant persisters (DTP).
A and B, HER2+ breast cancer cell lines were treated with 2.5 μM lapatinib (A) or with 1.2 μM tucatinib (B), counted at the indicated times, and the percentage of the initial cell number was determined. Mean ± SEM from three independent experiments is displayed shown. The inset shows a magnified view of the residual cells from Days 28–49. C, BT474 and HCC1419 cells were treated with the indicated agents for 14 days and percentage survival was quantified. D, Cells from the indicated lines were cultured in lapatinib or tucatinib (as indicated) for 14 days to generate DTPs. Then drug was withdrawn, and cells were allowed to resume proliferation. At the indicated times, cells were re-challenged with the same drug. Parental cells were used as a control at each time point. Cell survival was assessed by counting viable cells after 7-days of TKI treatment and normalized to the viable cell number at Day 0 (t=0). Mean ± SEM from three independent experiments is displayed. Statistical significance was assessed by two-tailed t-test for SUM225. All other cell lines were assessed by two-way ANOVA with Bonferroni post-hoc analysis (ns, p>0.05, *p<0.05 **p<0.01, ***p<0.001, ****p<0.0001). E, Number of tumors detected and estimated tumor-initiating cell (TIC) frequency of BT474 parental cells and lapatinib-DTPs after injection into the mammary fat pad of NSG mice. The top image shows tumors 5 months post-injection.
Figure 2.
Figure 2.. HER2+ breast cancer cells elicit distinct transcriptional programs after HER2 TKI treatment.
A, Heatmap shows unsupervised clustering of parental and lapatinib-DTP samples. Scale represents the z-score. B and C, GSEA shows enrichment of “Hallmark Epithelial Mesenchymal Transition” genes in mesenchymal-like DTPs (top) and “Hallmark Estrogen Responses Early” in luminal-like DTPs (bottom) evoked by lapatinib (B) or tucatinib (C). D, Heatmaps show supervised clustering of parental, lapatinib-DTPs and tucatinib-DTPs with mesenchymal-DTP DEGs (left) or luminal DTP DEGs (right). Scale represents the z-score. E-H, GSEA shows enrichment of the indicated gene sets in lapatinib-induced (E) and tucatinib-induced (F) mesenchymal-like DTPs, and lapatinib- (G) and tucatinib-induced (H) luminal-like DTPs.
Figure 3.
Figure 3.. A fraction of randomly growing HER2-luminal cells occupies a pre-DTP state characterized by a G0-like signature.
A, Aggregate expression of BT474 lapatinib-DTP Up and Down DEGs in single cells from untreated (UT), 6-hour lapatinib-treated (6h) and DTP (14-day lapatinib) samples. ****P<0.0001, unpaired t-test compared to UT. B, UMAP projection of scRNA-Seq of untreated BT474 cells. Cells are colored by their unsupervised clusters. C, Aggregate expression of BT474 lapatinib-DTP Up and Down DEGs, as indicated, in each unsupervised cluster of untreated BT474 cells from B. **P<0.01, ****P<0.0001, unpaired t-test compared to cluster B. D, UMAP projection of untreated BT474 cells using cell cycle signature genes as defined by Xue et al. (44) with cells colored by cell cycle stage (see Methods for details). E, UMAP projection showing untreated BT474 cells clustered by cell cycle genes as in D, but with cells colored according to their unsupervised clusters (as determined in B). F, Same projection as in D, but with pre-DTPs (based on their BT474-DTP combined DEG score) shown as larger circles compared with other cells. G, Heatmap displaying BT474-DTP Up DEG score, BT474-DTP Down DEG score and BT474-DTP combined DEG score (up DEG score minus down DEG score), in each untreated BT474 cells. The upper panels show the unsupervised clusters from B and their cell cycle phase, determined by expression of the cell cycle genes of Xue et al. (44). H, UMAP projection of supervised clustering of untreated HCC1419 cells by their cell cycle genes. Cells are colored by cell cycle status. I, Heatmap displaying HCC1419-DTP Up DEG score, HCC1419-DTP Down DEG score, and HCC1419-DTP combined DEG score (up minus down DEG score) in single cells from HCC1419. Upper panels display the unsupervised cluster to which each untreated HCC1419 cell belongs and its inferred cell cycle phase.
Figure 4.
Figure 4.. G0-like, pre-DTP cells in HER2+ breast cancer cell lines and patients enrich for gene signatures associated with other DTPs and anti-correlate with pathological response rate (pCR) to lapatinib.
A and B, Cells with G0 signature in luminal-like HER2+ breast cancer lines, BT474 and HCC1419, are enriched for Luminal DTP Unique Up genes (A), while cells with G0 signature in mesenchymal-like HER2+ breast cancer lines, SKBR3, EFM192A and SUM225, are enriched for Mesenchymal DTP Unique Up genes (B). G0-like cells were identified by using cell cycle signatures from Xue et al. (44). C-F, G0 cells in all HER2+ breast cancer cell lines are enriched for Rehman Diapause Up (28) (C), Duy CISG Up (30) (D), and Fridman Senescence Up (30,45) genes (E) and depleted for Hallmark MYC Target genes (F). G, G0 cells in two primary HER2+/ER- breast cancer patients are enriched for Mesenchymal DTP Unique Up genes. H, Distribution of G0 signature scores calculated from Oki et al. (88) in patients with or without pCR in the neoadjuvant lapatinib arm of the NeoALTTO trial, analyzed by two-sided Student’s t-test.
Figure 5.
Figure 5.. Prospective purification of pre-DTPs.
A, Overlap of untreated BT474 cluster B DEGs with fold change (FC) >1.5 and BT474 lapatinib-DTP DEGs with FC > 2. The 20 overlapping genes and the p-values from Fisher’s exact test are displayed. Genes encoding surface proteins are shown in bold. B, FACS-isolated NPY1Rhi, NPY1Rmid, and NPY1Rlo cells were treated with lapatinib for 14 days. Average RFU indicates the Alamar Blue readings at the experimental endpoint. Mean ± SEM for three independent experiments is displayed. Significance was evaluated by two-tailed t-test (**p<0.01, ****p<0.0001). C, Overlap of NPY1R and BT474 lapatinib-DTP DEGs with directionality of the DEGs matched in the analysis and p-value from Fisher’s exact test is displayed. D, GSEA shows enrichment for “Hallmark Estrogen Response Early” genes in NPY1Rhi versus NPY1Rlo cells. E, qRT-PCR for NPY1R in FACS-isolated NPY1Rhi, NPY1Rmid, and NPY1Rlo cells that were either left untreated, treated with lapatinib for 6 hours (Lap), or treated with lapatinib and fulvestrant for 6 hours (Lap + Ful). Relative NPY1R expression represents the 2-ΔΔCT relative to the untreated NPY1Rlo sample. The mean ± SEM of three independent experiments is displayed (ns, p>0.05, **p<0.01, ****p<0.0001, two-tailed t-test). F, BT474 cells were stained with Hoechst 33342 and for surface NPY1R; the NPY1Rhi and NPY1Rlo populations are displayed. G, Quantification of cells in G0/G1 and S-G2M from panel F (**p<0.01, two-tailed t-test). H and I, Pseudotime analysis of cells from untreated BT474 cells, 6h lap-treated cells, and DTP samples with cells colored by sample condition (H) or NPY1R expression (I). J, Cells from BT474 untreated and 6h Lap sample were isolated (computationally), and their respective positions on the pseudotime trajectory are displayed. Cells are colored by their relative NPY1R expression level. K, Cells from untreated and 6h lapatinib-treated BT474 cells were isolated (computationally), and their respective positions on the pseudotime trajectory are displayed. Cells are colored by their cell cycle phase.
Figure 6.
Figure 6.. Luminal-like lapatinib-DTPs are more sensitive to PI3K than AKT inhibition and transcriptionally up-regulate SGK3 via estrogen receptor.
A, Alamar Blue readings of SKBR3, EFM192A, BT474, and HCC1419 cells treated as indicated for 7 days. Relative fluorescence units (RFU) were normalized to t=0. B, Changes in DTP numbers following fulvestrant plus lapatinib treatment compared with lapatinib treatment alone; Mean ± SEM of three independent experiments is displayed. Significance was assessed by two-tailed t-test (****p<0.0001). C, Incucyte images of SKBR3, EFM192A, BT474, and HCC1419 cells treated as indicated for 14 days and then cultured drug-free for 14 days to assess regrowth. Representative images from three independent experiments are displayed. D, DESeq2 normalized expression of ESR1 is displayed for parental cells and lapatinib-DTPs of each cell line. E and F, Lapatinib-DTPs from BT474 (E) or HCC1419 (F) cells were treated with increasing doses of BKM120 (pan-PI3K inhibitor), GSK690693 (AKT catalytic inhibitor), or MK-2206 (AKT allosteric inhibitor) for 96 hours, and cell number was determined by Alamar Blue viability assay. Mean ± SEM from three independent experiments is shown. G and H, Differential effect of PI3K and AKT inhibitors on PI3K pathway components. Cells were treated with the indicated inhibitors or vehicle (DMSO) for one hour before lysis. Whole cell lysates were resolved by SDS-PAGE and immunoblotted with the indicated antibodies to assess pathway activation. Numbers under blots represent relative band intensities compared to vehicle control. Representative blots from one of two independent experiments are shown. I, Relative SGK3 mRNA expression, quantified by RT-qPCR, normalized to TBP and to the parental cells in the indicated cell lines. Data represent Mean ± SEM from three independent experiments (*p< 0.05, ***p<0.001, ****p<0.0001, two-tailed t-test). J, SGK3 levels in whole cell lysates from the indicated parental cells and lapatinib-DTPs, quantified by immunoblotting. ERK2 serves as a loading control. Numbers under blots represent the normalized relative intensity compared to parental cells. Representative blots from three independent experiments are shown. K and L, Relative SGK3 expression, quantified by qRT-PCR, from BT474 (K) and HCC1419 (L) cells treated with DMSO vehicle (Veh), lapatinib (Lap), fulvestrant (Ful), or lapatinib plus fulvestrant (Lap + Ful) for 48 hours. Expression values were normalized to TBP and to the vehicle control. Mean ± SEM from three independent experiments is displayed. (*p<0.05, **p<0.01, two-tailed t-test).
Figure 7.
Figure 7.. SGK3 phosphorylates TSC2 to activate mTORC1.
A, FLAG-tagged TSC2 expression construct was transfected into 293T cells, which were then treated with 1 μM BKM120 for one hour to dephosphorylate PI3K-dependent sites. TSC2 was recovered from cell lysates by immunoprecipitation with ANTI-FLAG M2 agarose beads and incubated with 100 ng recombinant SGK3 at 30°C for 30 minutes in presence of 100 μM ATP. Immunoprecipitates and lysates were subjected to immunoblot analysis with the indicated antibodies. Representative blots from two independent experiments are shown. B, A scaled-up in vitro kinase reaction was performed as in A and analyzed by mass spectrometry. Table shows relative phosphorylation of each pAKT motif site, compared with the TSC2-only control. C, Schematic showing wild type (WT) TSC2 and positions of S/T->A TSC2 phosphorylation mutants. Sites conforming to the AKT substrate motif sequence (RXRXXS/T) are displayed with reported AKT phosphorylation sites underlined. SGK3 sites identified by mass spectrometry are highlighted in red. Specific S/T->A mutants analyzed also are shown. D, 293T cells were transfected with expression constructs for FLAG-tagged wild type (WT) or mutant TSC2 with or without SGK3-GST, as indicated, and then serum-starved overnight. Where indicated, cells were treated with 1 μM MK-2206 for 30 minutes prior to stimulation with 50 ng/ml IGF1 for 30 minutes, and whole cell lysates and TSC2 immunoprecipitates were immunoblotted with the indicated antibodies. Numbers under the blots represent relative intensities compared with those from cells co-transfected with wt-TSC2 and SGK3-GST + MK-2206; signals from the wt-TSC2 + MK-2206 lanes were subtracted from each before quantification. Representative blots from one of two independent experiments are displayed. E and F, BT474 lapatinib-DTPs (E) and HCC1419 lapatinib-DTPs (F) were treated alone or in combination with 3 μM or 10 μM BKM120, 1 μM GSK690693, 1 μM MK-2206, or 3 μM 14h for 96 hours, and cell survival was assessed by Alamar Blue assay. Mean ± SEM of the normalized relative fluorescence units from three independent experiments is displayed (*p<0.05, **p < 0.01, two-tailed t-test). G and H, BT474 lapatinib-DTPs (G) and HCC1419 lapatinib-DTPs (H) were treated with the inhibitors for one hour, and whole cell lysates were subjected to immunoblot analysis with the indicated antibodies. Numbers under the blots indicate relative intensity compared with the vehicle control. Representative blots from two independent experiments are displayed. I, Proposed model for luminal-like DTP ontogeny. As luminal-like HER2+ breast cancer cells cycle through late mitosis, the population bifurcates, with a subset of cells (M/G1) cycling into G1, while another sub-population transits into G0. The latter state (or a subset of cells within this state, indicated by “?”) is “primed” to become DTPs upon TKI exposure. Pre-DTPs also show selective activation of ER target genes and activation/repression of genes associated with DTPs in other systems (diapause, senescence, and MYC targets). Upon exposure to a HER2 TKI, some pre-DTPs further increase their expression of estrogen receptor target genes, including SGK3. SGK3 rewires the PI3K/mTORC1 pathway to enable PI3K-dependent, AKT-independent survival. J, Distinct survival programs are activated in luminal-like and mesenchymal-like DTPs. In luminal-like DTPs, ER transcriptionally up-regulates SGK3, which phosphorylates and inhibits TSC2 to mediate mTORC1 activation and survival. By contrast, mesenchymal-like DTPs exhibit an epithelial-to-mesenchymal (EMT)-like transcriptional program evoked by (an) unidentified transcription factor (s). Mesenchymal-like DTPs also activate mTORC1 in an AKT-independent manner by means of an as yet unidentified kinase.

References

    1. Pondé N, Brandão M, El-Hachem G, Werbrouck E, Piccart M. Treatment of advanced HER2-positive breast cancer: 2018 and beyond. Cancer Treat Rev 2018;67:10–20. - PubMed
    1. Pernas S, Tolaney SM. HER2-positive breast cancer: new therapeutic frontiers and overcoming resistance. Ther Adv Med Oncol 2019;11:175883591983351. - PMC - PubMed
    1. Scaltriti M, Rojo F, Ocaña A, Anido J, Guzman M, Cortes J, et al. Expression of p95HER2, a truncated form of the HER2 receptor, and response to anti-HER2 therapies in breast cancer. J Natl Cancer Inst 2007;99:628–38. - PubMed
    1. Rusnak DW, Lackey K, Affleck K, Wood ER, Alligood KJ, Rhodes N, et al. The effects of the novel, reversible epidermal growth factor receptor/ErbB-2 tyrosine kinase inhibitor, GW2016, on the growth of human normal and tumor-derived cell lines in vitro and in vivo. Mol Cancer Ther 2001;1:85–94. - PubMed
    1. Geyer CE, Forster J, Lindquist D, Chan S, Romieu CG, Pienkowski T, et al. Lapatinib plus capecitabine for HER2-positive advanced breast cancer. N Engl J Med 2006;355:2733–43. - PubMed

Publication types