. 2022 Feb;10(2):162-181.
doi: 10.1158/2326-6066.CIR-21-0539. Epub 2021 Dec 15.

NKG7 Is a T-cell-Intrinsic Therapeutic Target for Improving Antitumor Cytotoxicity and Cancer Immunotherapy

Affiliations

NKG7 Is a T-cell-Intrinsic Therapeutic Target for Improving Antitumor Cytotoxicity and Cancer Immunotherapy

Ti Wen et al. Cancer Immunol Res. 2022 Feb.

Abstract

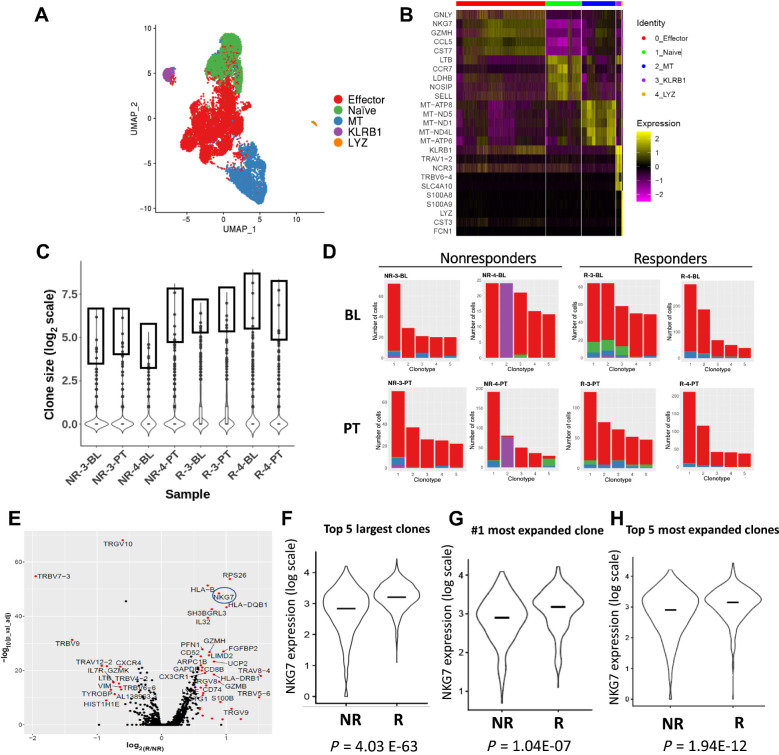
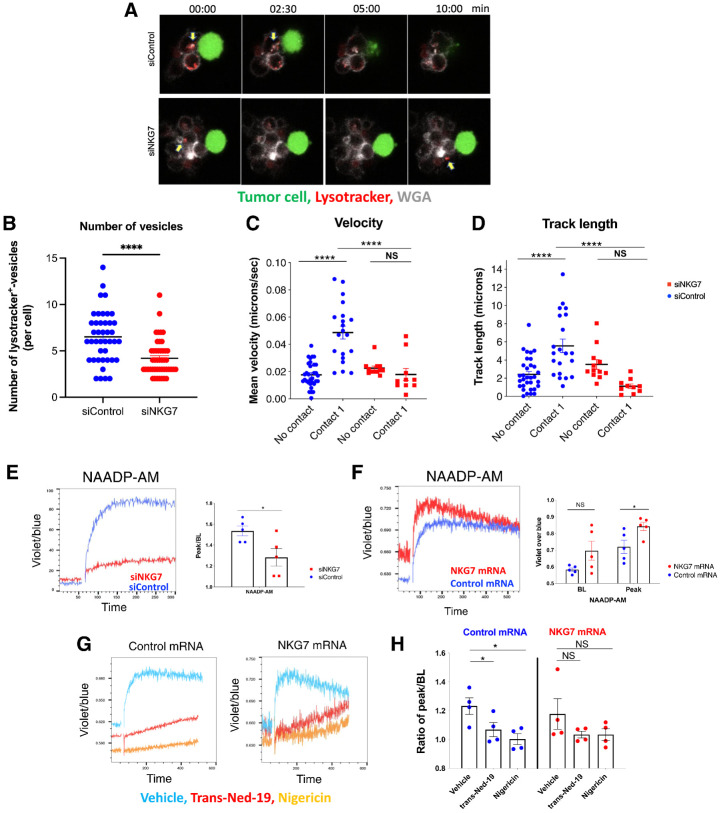
Cytotoxic CD8+ T cells (CTL) are a crucial component of the immune system notable for their ability to eliminate rapidly proliferating malignant cells. However, the T-cell intrinsic factors required for human CTLs to accomplish highly efficient antitumor cytotoxicity are not well defined. By evaluating human CD8+ T cells from responders versus nonresponders to treatment with immune checkpoint inhibitors, we sought to identify key factors associated with effective CTL function. Single-cell RNA-sequencing analysis of peripheral CD8+ T cells from patients treated with anti-PD-1 therapy showed that cells from nonresponders exhibited decreased expression of the cytolytic granule-associated molecule natural killer cell granule protein-7 (NKG7). Functional assays revealed that reduced NKG7 expression altered cytolytic granule number, trafficking, and calcium release, resulting in decreased CD8+ T-cell-mediated killing of tumor cells. Transfection of T cells with NKG7 mRNA was sufficient to improve the tumor-cell killing ability of human T cells isolated from nonresponders and increase their response to anti-PD-1 or anti-PD-L1 therapy in vitro. NKG7 mRNA therapy also improved the antitumor activity of murine tumor antigen-specific CD8+ T cells in an in vivo model of adoptive cell therapy. Finally, we showed that the transcription factor ETS1 played a role in regulating NKG7 expression. Together, our results identify NKG7 as a necessary component for the cytotoxic function of CD8+ T cells and establish NKG7 as a T-cell-intrinsic therapeutic target for enhancing cancer immunotherapy.See related article by Li et al., p. 154.


Figures

Figure 1. Expression of NKG7 mRNA decreases in the CD8+ cytotoxic T cells of patients who fail anti–PD-1 therapy. A, Schematic overview of study. B, UMAP for cell expression profiles from eight samples: R-1, R-2, NR-1, and NR-2 at BL and PT timepoints. R-1-BL (n = 767 cells), R-1-PT (n = 1,238), R-2-BL (n = 1,586), R-2-PT (n = 1,964), NR-1-BL (n = 1,631), NR-1-PT (n = 1,810), NR-2-BL (n = 2,525), NR-2-PT (n = 2,089). UMAP resolution of 0.06 identifies four cell subsets: naïve-like (green), effector (red), effector exhausted (KLRB1, purple), and a cluster high in mitochondrial gene expression (blue). C, Heatmap of top 5 enriched gene markers for the clusters detected. D, Expression of four known cytolytic molecules. E, Pie charts show distribution of cells in the clusters of each dataset in the integration analysis of eight samples (BL, n = 4 patients; PT, n = 4), percentage shown for the major two clusters (colors are consistent with B). F, Analysis strategy. G, Venn diagram shows the number of differentially expressed genes (PT vs. BL) in the effector clusters of 4 patients, filtered by absolute value of fold change (FC) >1.1 and P value < 0.05. NKG7 was the only gene with opposite trends in both nonresponders (NR; downregulated) and both responders (R; upregulated). H, Violin plots demonstrate NKG7 expression in NR samples (downregulation) and R samples (upregulation). Bar, median. P values were obtained from differential gene expression analysis (PT vs. BL) at sample level. I, Feature plot of NKG7 expression.
Figure 1.
Expression of NKG7 mRNA decreases in the CD8+ cytotoxic T cells of patients who fail anti–PD-1 therapy. A, Schematic overview of study. B, UMAP for cell expression profiles from eight samples: R-1, R-2, NR-1, and NR-2 at BL and PT timepoints. R-1-BL (n = 767 cells), R-1-PT (n = 1,238), R-2-BL (n = 1,586), R-2-PT (n = 1,964), NR-1-BL (n = 1,631), NR-1-PT (n = 1,810), NR-2-BL (n = 2,525), NR-2-PT (n = 2,089). UMAP resolution of 0.06 identifies four cell subsets: naïve-like (green), effector (red), effector exhausted (KLRB1, purple), and a cluster high in mitochondrial gene expression (blue). C, Heatmap of top 5 enriched gene markers for the clusters detected. D, Expression of four known cytolytic molecules. E, Pie charts show distribution of cells in the clusters of each dataset in the integration analysis of eight samples (BL, n = 4 patients; PT, n = 4), percentage shown for the major two clusters (colors are consistent with B). F, Analysis strategy. G, Venn diagram shows the number of differentially expressed genes (PT vs. BL) in the effector clusters of 4 patients, filtered by absolute value of fold change (FC) >1.1 and P value < 0.05. NKG7 was the only gene with opposite trends in both nonresponders (NR; downregulated) and both responders (R; upregulated). H, Violin plots demonstrate NKG7 expression in NR samples (downregulation) and R samples (upregulation). Bar, median. P values were obtained from differential gene expression analysis (PT vs. BL) at sample level. I, Feature plot of NKG7 expression.
Figure 2. Expanded CD8+ T-cell clones of nonresponders to anti–PD-1 therapy exhibit lower expression of NKG7 mRNA. A, UMAP shows 5 cell subtypes from the integrated analysis of 8 samples: R-3, R-4, NR-3, and NR-4 datasets (BL, n = 4 patients; PT, n = 4). UMAP resolution of 0.08. The major four color-coded clusters are consistent with those in Fig. 1B. B, Heatmap of top five genes significantly enriched in each cluster. C, Violin plots show clone size distribution in each dataset. Boxes highlight the top five largest clones (by size) in each sample. D, Bar plots show cell distribution by cluster of the top five largest clones. Color-coded clusters are consistent with those in A. E, Volcano plot of gene expression ratio (R/NR) versus P value adjusted in the top five largest clones of BL samples. R/NR ratio (NKG7) = 1.85. F, Violin plot of NKG7 expression in the top 5 largest clones of NR-3, NR-4 and R-3, R-4 samples (n = 2,592 cells). G, NKG7 gene expression level in the most expanded clone from NRs versus Rs (n = 933 cells). Expanded clones were defined as being those with more cells in PT sample versus BL sample and have ≥ 10 cells in PT samples. H, NKG7 gene expression level in the top five most expanded clones from NRs versus Rs (n = 1,217 cells). Note that R-4 only had 3 expanded clones detected. Bars in F–H are median. P values obtained from differential gene expression analysis (R vs. NR) using the same data.
Figure 2.
Expanded CD8+ T-cell clones of nonresponders to anti–PD-1 therapy exhibit lower expression of NKG7 mRNA. A, UMAP shows 5 cell subtypes from the integrated analysis of 8 samples: R-3, R-4, NR-3, and NR-4 datasets (BL, n = 4 patients; PT, n = 4). UMAP resolution of 0.08. The major four color-coded clusters are consistent with those in Fig. 1B. B, Heatmap of top five genes significantly enriched in each cluster. C, Violin plots show clone size distribution in each dataset. Boxes highlight the top five largest clones (by size) in each sample. D, Bar plots show cell distribution by cluster of the top five largest clones. Color-coded clusters are consistent with those in A. E, Volcano plot of gene expression ratio (R/NR) versus P value adjusted in the top five largest clones of BL samples. R/NR ratio (NKG7) = 1.85. F, Violin plot of NKG7 expression in the top 5 largest clones of NR-3, NR-4 and R-3, R-4 samples (n = 2,592 cells). G,NKG7 gene expression level in the most expanded clone from NRs versus Rs (n = 933 cells). Expanded clones were defined as being those with more cells in PT sample versus BL sample and have ≥ 10 cells in PT samples. H,NKG7 gene expression level in the top five most expanded clones from NRs versus Rs (n = 1,217 cells). Note that R-4 only had 3 expanded clones detected. Bars in FH are median. P values obtained from differential gene expression analysis (R vs. NR) using the same data.
Figure 3. Flow cytometry of peripheral blood samples and bulk RNA-seq of tumor biopsies confirm lower levels of NKG7 expression in nonresponders to anti–PD-1 therapy. A, Percent of CD8+ T cells positive for NKG7 was compared in the CX3CR1+ versus CX3CR1− populations from PBMCs of patients with melanoma using flow cytometry (BL and PT samples used). Cells were first gated on CD8+CD11ahi populations, then CX3CR1+ versus CX3CR1− subsets. Mann–Whitney used (n = 20 patients; ***, P < 0.001, lines are mean and SEM). B, Percent of CD8+ T cells double positive for NKG7+CX3CR1+ was compared between patients who eventually responded or progressed on anti–PD-1 therapy. BL and PT time points were analyzed separately. Unpaired t test was used (n = 15 responders, n = 11 non-responders; *, P < 0.05, lines are mean and SEM). C, Brown cytoplasmic staining is positive for NKG7; blue nuclear stain is hematoxylin. Staining positive in normal human tonsil, metastatic melanoma (met to small bowel), and squamous cell carcinoma (excised from tongue). D, Log2 normalized NKG7 mRNA expression in primary tumor biopsies according to response (n = 25 responders, n = 22 nonresponders). Unpaired t test used (***, P < 0.001, lines are mean and SEM). E, ROC curve for NKG7 mRNA expression in the tumor biopsies of eventual responders versus nonresponders to anti–PD-1/L1 therapy (n = 47 patients as in D, AUC 0.81, ***, P < 0.001). Note that in the ROC curve, sensitivity represents the true positive rate (TPR) and specificity is 1– false positive rate (1-FPR). A random classifier that has no predictive value would give points lying along the diagonal (FPR = TPR).
Figure 3.
Flow cytometry of peripheral blood samples and bulk RNA-seq of tumor biopsies confirm lower levels of NKG7 expression in nonresponders to anti–PD-1 therapy. A, Percent of CD8+ T cells positive for NKG7 was compared in the CX3CR1+ versus CX3CR1 populations from PBMCs of patients with melanoma using flow cytometry (BL and PT samples used). Cells were first gated on CD8+CD11ahi populations, then CX3CR1+ versus CX3CR1 subsets. Mann–Whitney used (n = 20 patients; ***, P < 0.001, lines are mean and SEM). B, Percent of CD8+ T cells double positive for NKG7+CX3CR1+ was compared between patients who eventually responded or progressed on anti–PD-1 therapy. BL and PT time points were analyzed separately. Unpaired t test was used (n = 15 responders, n = 11 non-responders; *, P < 0.05, lines are mean and SEM). C, Brown cytoplasmic staining is positive for NKG7; blue nuclear stain is hematoxylin. Staining positive in normal human tonsil, metastatic melanoma (met to small bowel), and squamous cell carcinoma (excised from tongue). D, Log2 normalized NKG7 mRNA expression in primary tumor biopsies according to response (n = 25 responders, n = 22 nonresponders). Unpaired t test used (***, P < 0.001, lines are mean and SEM). E, ROC curve for NKG7 mRNA expression in the tumor biopsies of eventual responders versus nonresponders to anti–PD-1/L1 therapy (n = 47 patients as in D, AUC 0.81, ***, P < 0.001). Note that in the ROC curve, sensitivity represents the true positive rate (TPR) and specificity is 1– false positive rate (1-FPR). A random classifier that has no predictive value would give points lying along the diagonal (FPR = TPR).
Figure 4. Reduced NKG7 expression results in decreased CD8+ T-cell killing of tumor cells. A, Activated primary human CD8+ T cells stained for indicated proteins. B, Pearson Correlation Coefficient for colocalization with NKG7. Each dot represents an individual cell at high resolution. Line is median. C, CD8+ T cells from healthy donors were transfected with control or NKG7 siRNA, activated for 48 hours with anti-CD3/CD28, and then cocultured with calcein-labeled MCF-7 tumor cells at indicated target to effector ratios. After 4 hours, calcein release in supernatant was measured and percent cytotoxicity calculated. Symbols are mean; lines are SEM. Same data visualized as an x,y plot in C, dot plot in D. Paired t test (n = 9 separate donors; each dot is the average of triplicate wells). Bar height is mean; bars are SEM. E, CRISPR/Cas9 RNP complexes were used to knock-out NKG7 from primary CD8+ T cells isolated from peripheral blood of n = 4 healthy donors. Graph shows percentage of CD107a+ cells among CD8+CD16/32− population after coculture with activated P815 target cells. Paired t test, *, P < 0.05. F, Knock-out cells were transfected with either control or NKG7 mRNA. Western blot (WB) confirms knock-out of NKG7 in T cells from a representative donor (gNKG7_KO), as compared with cells from the same donor that did not receive the NKG7-specific control siRNA (gControl). Western blot also shows that the addition of NKG7 mRNA (red “N7”) resulted in increased abundance of NKG7 protein in both gControl and gNKG7_KO cells. GAPDH loading control. Representative of 3 healthy donors. G, The activated gControl or gNKG7-KO CD8+ T cells rescued with NKG7 mRNA or control mRNA were used in test of their degranulation as in E at a 1:1 ratio. Dots are average of 3 healthy donors. Paired t test used. (*, P < 0.05). h, hours. H, TEM images of CD8+ T cells from healthy donors transfected with siRNA, activated with anti-CD3/CD28, and then cocultured with MCF-7 tumor cells prior to analysis. Images are representative of 5 images/condition analyzed from 3 different donors. I, Number of granules within T cell at the T cell–tumor cell interface quantified (each dot is a separate image). Unpaired t test used (**, P < 0.01). Bar height is mean, and lines are SEM.
Figure 4.
Reduced NKG7 expression results in decreased CD8+ T-cell killing of tumor cells. A, Activated primary human CD8+ T cells stained for indicated proteins. B, Pearson Correlation Coefficient for colocalization with NKG7. Each dot represents an individual cell at high resolution. Line is median. C, CD8+ T cells from healthy donors were transfected with control or NKG7 siRNA, activated for 48 hours with anti-CD3/CD28, and then cocultured with calcein-labeled MCF-7 tumor cells at indicated target to effector ratios. After 4 hours, calcein release in supernatant was measured and percent cytotoxicity calculated. Symbols are mean; lines are SEM. Same data visualized as an x,y plot in C, dot plot in D. Paired t test (n = 9 separate donors; each dot is the average of triplicate wells). Bar height is mean; bars are SEM. E, CRISPR/Cas9 RNP complexes were used to knock-out NKG7 from primary CD8+ T cells isolated from peripheral blood of n = 4 healthy donors. Graph shows percentage of CD107a+ cells among CD8+CD16/32 population after coculture with activated P815 target cells. Paired t test, *, P < 0.05. F, Knock-out cells were transfected with either control or NKG7 mRNA. Western blot (WB) confirms knock-out of NKG7 in T cells from a representative donor (gNKG7_KO), as compared with cells from the same donor that did not receive the NKG7-specific control siRNA (gControl). Western blot also shows that the addition of NKG7 mRNA (red “N7”) resulted in increased abundance of NKG7 protein in both gControl and gNKG7_KO cells. GAPDH loading control. Representative of 3 healthy donors. G, The activated gControl or gNKG7-KO CD8+ T cells rescued with NKG7 mRNA or control mRNA were used in test of their degranulation as in E at a 1:1 ratio. Dots are average of 3 healthy donors. Paired t test used. (*, P < 0.05). h, hours. H, TEM images of CD8+ T cells from healthy donors transfected with siRNA, activated with anti-CD3/CD28, and then cocultured with MCF-7 tumor cells prior to analysis. Images are representative of 5 images/condition analyzed from 3 different donors. I, Number of granules within T cell at the T cell–tumor cell interface quantified (each dot is a separate image). Unpaired t test used (**, P < 0.01). Bar height is mean, and lines are SEM.
Figure 5. Reduced NKG7 expression compromises cytolytic granule number, trafficking, and calcium flux in CD8+ T cells. A, Representative images from real-time imaging. Min, minutes. B, Count of lysotracker positive particles per individual T cell. Average of 10 to 12 cells per image, four images per condition (siControl vs. siNKG7). Mann–Whitney test used. C and D, Mean velocity and track length measured for individual granules within T cells in contact with MCF-7 (Contact 1) or contact-free (no contact). Each dot represents mean velocity and track length per cell analyzed. Images were acquired every minute for 30 minutes. Two independent experiments were performed, and data combined. Three regions/condition were randomly selected for time-lapse imaging (n ≥ 10 granules/condition, n = 2 healthy donors). One-way ANOVA with Tukey test. Sec, second. E, Calcium flux assay. T cells from healthy donors were transfected with control or NKG7 siRNA, then labeled with Indo-1 AM. Using a flow cytometer, baseline fluorescence acquisition was acquired for 1 minute. Then, NAADP-AM was added and acquisition immediately resumed. Representative flow data are shown as violet (405 nm) over blue (510 nm). Quantification shown at right as ratio of peak/BL (n = 5 healthy donors). Unpaired t test. F, Calcium flux assay using cells transfected with control or NKG7 mRNA. Representative flow data are shown as violet (405 nm) over blue (510 nm). Quantification shown at right (n = 5 healthy donors). Data separated into BL and peak for each sample. Unpaired t test used. G and H, As in F, inhibitors (Trans-Ned-19 or Nigericin) were added 30 minutes before stimulation with NAADP-AM. Data are presented as ratio of peak/BL calcium flux with 4 donors. *, P < 0.05, **, P < 0.01, ***, P < 0.001, ****, P < 0.0001. Bars, mean; error bars, SEM throughout. NS, not significant.
Figure 5.
Reduced NKG7 expression compromises cytolytic granule number, trafficking, and calcium flux in CD8+ T cells. A, Representative images from real-time imaging. Min, minutes. B, Count of lysotracker positive particles per individual T cell. Average of 10 to 12 cells per image, four images per condition (siControl vs. siNKG7). Mann–Whitney test used. C and D, Mean velocity and track length measured for individual granules within T cells in contact with MCF-7 (Contact 1) or contact-free (no contact). Each dot represents mean velocity and track length per cell analyzed. Images were acquired every minute for 30 minutes. Two independent experiments were performed, and data combined. Three regions/condition were randomly selected for time-lapse imaging (n ≥ 10 granules/condition, n = 2 healthy donors). One-way ANOVA with Tukey test. Sec, second. E, Calcium flux assay. T cells from healthy donors were transfected with control or NKG7 siRNA, then labeled with Indo-1 AM. Using a flow cytometer, baseline fluorescence acquisition was acquired for 1 minute. Then, NAADP-AM was added and acquisition immediately resumed. Representative flow data are shown as violet (405 nm) over blue (510 nm). Quantification shown at right as ratio of peak/BL (n = 5 healthy donors). Unpaired t test. F, Calcium flux assay using cells transfected with control or NKG7 mRNA. Representative flow data are shown as violet (405 nm) over blue (510 nm). Quantification shown at right (n = 5 healthy donors). Data separated into BL and peak for each sample. Unpaired t test used. G and H, As in F, inhibitors (Trans-Ned-19 or Nigericin) were added 30 minutes before stimulation with NAADP-AM. Data are presented as ratio of peak/BL calcium flux with 4 donors. *, P < 0.05, **, P < 0.01, ***, P < 0.001, ****, P < 0.0001. Bars, mean; error bars, SEM throughout. NS, not significant.
Figure 6. NKG7 mRNA transfection increases the antitumor cytotoxicity of CD8+ T cells and improves response to immune checkpoint inhibitors. A, Schematic of experimental protocol. B, Percent cytotoxicity calculated after calcein release assay. Lines connect paired samples from same individual. Target cells were human melanoma cell line A375, assayed at 1:20 target to effector ratio. C, Summary graph of data from B. Mann–Whitney test used (n = 6 patients for media, pembrolizumab; n = 5 of those also run with atezolizumab; each dot is average of triplicate wells). D, Cells isolated from the spleen of OT-1 transgenic mice were transfected with control mRNA or NKG7 mRNA, then activated with OVA257–264 peptide. After 48 hours of activation, remaining NKG7 mRNA levels were quantified via qRT-PCR. Each dot represents average of triplicate wells for a single mouse (n = 3 mice). Unpaired t test used. E, Cells transfected and activated as in D were cocultured with calcein-labeled EL4 tumor cells pulsed with OVA257–264 peptide at target to effector ratio of 1:10. Unpaired t test used (n = 4 separate experiments; each dot is the average of four replicate wells in a single experiment). F, Schematic of in vivo experimental protocol. d, days. G, Average growth curves for each group (n = 8 untreated, n = 7 control OT-1, n = 6 NKG7 OT-1). Unpaired t test used. H, Survival curve of mice to humane endpoint. Log-rank (Mantel–Cox) test. Data are representative of three separate in vivo experiments. *, P < 0.05, **, P < 0.01. Bars, mean; error bars, SEM throughout.
Figure 6.
NKG7 mRNA transfection increases the antitumor cytotoxicity of CD8+ T cells and improves response to immune checkpoint inhibitors. A, Schematic of experimental protocol. B, Percent cytotoxicity calculated after calcein release assay. Lines connect paired samples from same individual. Target cells were human melanoma cell line A375, assayed at 1:20 target to effector ratio. C, Summary graph of data from B. Mann–Whitney test used (n = 6 patients for media, pembrolizumab; n = 5 of those also run with atezolizumab; each dot is average of triplicate wells). D, Cells isolated from the spleen of OT-1 transgenic mice were transfected with control mRNA or NKG7 mRNA, then activated with OVA257–264 peptide. After 48 hours of activation, remaining NKG7 mRNA levels were quantified via qRT-PCR. Each dot represents average of triplicate wells for a single mouse (n = 3 mice). Unpaired t test used. E, Cells transfected and activated as in D were cocultured with calcein-labeled EL4 tumor cells pulsed with OVA257–264 peptide at target to effector ratio of 1:10. Unpaired t test used (n = 4 separate experiments; each dot is the average of four replicate wells in a single experiment). F, Schematic of in vivo experimental protocol. d, days. G, Average growth curves for each group (n = 8 untreated, n = 7 control OT-1, n = 6 NKG7 OT-1). Unpaired t test used. H, Survival curve of mice to humane endpoint. Log-rank (Mantel–Cox) test. Data are representative of three separate in vivo experiments. *, P < 0.05, **, P < 0.01. Bars, mean; error bars, SEM throughout.
Figure 7. The transcription factor ETS1 is a negative regulator of NKG7 expression. A, Diagram of NKG7 gene (exons shown in gray) and 500-bp sequence upstream of the transcriptional start site (black). B, NKG7 mRNA expression quantified via qRT-PCR in Hut78 cells at 48 hours posttransfection of siRNA. Dot represents average of triplicate qRT-PCR assays from a single donor. C, ChIP-qPCR was performed on CD8+ T cells from healthy donors; ETS1 antibody pull-down followed by qPCR using primers specific for either exons 1 and 2 of NKG7 (gray bars) or the NKG7 promoter (black bars). Primers for the cFos promoter (open bars), were used as a positive control. Data is represented as fold enrichment over nonspecific Rabbit IgG control (n = 4 donors). D, Primary CD8+ T cells from healthy donors were transfected with control siRNA or ETS1 siRNA and ETS1 mRNA expression quantified at 24 hours posttransfection via qRT-PCR (**P = 0.0031, paired t test; n = 4 donors). E, CD8+ T cells from healthy donors were transfected as in D and collected at 48 hours posttransfection. qRT-PCR detected relative levels of NKG7 mRNA (*P = 0.02, paired t test; n = 7 donors). Bars, mean; error bars, SEM. F, Primary CD8+ T cells analyzed via Western blot. β-actin loading control. Densitometry quantification at right represented as fold increase in NKG7 over each donor's control-transfected sample (n = 4 donors). Control values were normalized to 1. G, CD8+ T cells transfected with control siRNA or ETS1 siRNA, activated with anti-CD3/CD28, and then cocultured with MCF-7 tumor cells in a calcein-based cytotoxicity assay (*P = 0.025, paired t test; n = 6 donors; lines connect paired samples from same donor). H, Velocity vector analysis of scRNA-seq data, overlaid on UMAP from Fig. 1B. Arrows indicate the extrapolated future state of peripheral CD8+ T cells. Cells are colored by cell type. I, Velocity of NKG7 and ETS1 mRNA with positive velocity indicating upregulation (dark green), or negative velocity indicating downregulation (dark red) of the gene.
Figure 7.
The transcription factor ETS1 is a negative regulator of NKG7 expression. A, Diagram of NKG7 gene (exons shown in gray) and 500-bp sequence upstream of the transcriptional start site (black). B,NKG7 mRNA expression quantified via qRT-PCR in Hut78 cells at 48 hours posttransfection of siRNA. Dot represents average of triplicate qRT-PCR assays from a single donor. C, ChIP-qPCR was performed on CD8+ T cells from healthy donors; ETS1 antibody pull-down followed by qPCR using primers specific for either exons 1 and 2 of NKG7 (gray bars) or the NKG7 promoter (black bars). Primers for the cFos promoter (open bars), were used as a positive control. Data is represented as fold enrichment over nonspecific Rabbit IgG control (n = 4 donors). D, Primary CD8+ T cells from healthy donors were transfected with control siRNA or ETS1 siRNA and ETS1 mRNA expression quantified at 24 hours posttransfection via qRT-PCR (**P = 0.0031, paired t test; n = 4 donors). E, CD8+ T cells from healthy donors were transfected as in D and collected at 48 hours posttransfection. qRT-PCR detected relative levels of NKG7 mRNA (*P = 0.02, paired t test; n = 7 donors). Bars, mean; error bars, SEM. F, Primary CD8+ T cells analyzed via Western blot. β-actin loading control. Densitometry quantification at right represented as fold increase in NKG7 over each donor's control-transfected sample (n = 4 donors). Control values were normalized to 1. G, CD8+ T cells transfected with control siRNA or ETS1 siRNA, activated with anti-CD3/CD28, and then cocultured with MCF-7 tumor cells in a calcein-based cytotoxicity assay (*P = 0.025, paired t test; n = 6 donors; lines connect paired samples from same donor). H, Velocity vector analysis of scRNA-seq data, overlaid on UMAP from Fig. 1B. Arrows indicate the extrapolated future state of peripheral CD8+ T cells. Cells are colored by cell type. I, Velocity of NKG7 and ETS1 mRNA with positive velocity indicating upregulation (dark green), or negative velocity indicating downregulation (dark red) of the gene.

References

    1. Hellstrom I, Hellstrom KE, Pierce GE, Yang JP. Cellular and humoral immunity to different types of human neoplasms. Nature 1968;220:1352–4. - PubMed
    1. Dieckmann NM, Frazer GL, Asano Y, Stinchcombe JC, Griffiths GM. The cytotoxic T lymphocyte immune synapse at a glance. J Cell Sci 2016;129:2881–6. - PubMed
    1. Ham H, Billadeau DD. Human immunodeficiency syndromes affecting human natural killer cell cytolytic activity. Front Immunol 2014;5:2. - PMC - PubMed
    1. Pitt JM, Marabelle A, Eggermont A, Soria JC, Kroemer G, Zitvogel L. Targeting the tumor microenvironment: removing obstruction to anticancer immune responses and immunotherapy. Ann Oncol 2016;27:1482–92. - PubMed
    1. Gajewski TF, Schreiber H, Fu YX. Innate and adaptive immune cells in the tumor microenvironment. Nat Immunol 2013;14:1014–22. - PMC - PubMed

Publication types