Comment
. 2022 Feb;21(2):310-321.
doi: 10.1158/1535-7163.MCT-21-0580. Epub 2021 Dec 15.

Cellular-Resolution Imaging of Bystander Payload Tissue Penetration from Antibody-Drug Conjugates

Affiliations
Comment

Cellular-Resolution Imaging of Bystander Payload Tissue Penetration from Antibody-Drug Conjugates

Eshita Khera et al. Mol Cancer Ther. 2022 Feb.

Abstract

After several notable clinical failures in early generations, antibody-drug conjugates (ADC) have made significant gains with seven new FDA approvals within the last 3 years. These successes have been driven by a shift towards mechanistically informed ADC design, where the payload, linker, drug-to-antibody ratio, and conjugation are increasingly tailored to a specific target and clinical indication. However, fundamental aspects needed for design, such as payload distribution, remain incompletely understood. Payloads are often classified as "bystander" or "nonbystander" depending on their ability to diffuse out of targeted cells into adjacent cells that may be antigen-negative or more distant from tumor vessels, helping to overcome heterogeneous distribution. Seven of the 11 FDA-approved ADCs employ these bystander payloads, but the depth of penetration and cytotoxic effects as a function of physicochemical properties and mechanism of action have not been fully characterized. Here, we utilized tumor spheroids and pharmacodynamic marker staining to quantify tissue penetration of the three major classes of agents: microtubule inhibitors, DNA-damaging agents, and topoisomerase inhibitors. PAMPA data and coculture assays were performed to compare with the 3D tissue culture data. The results demonstrate a spectrum in bystander potential and tissue penetration depending on the physicochemical properties and potency of the payload. Generally, directly targeted cells show a greater response even with bystander payloads, consistent with the benefit of deeper ADC tissue penetration. These results are compared with computational simulations to help scale the data from in vitro and preclinical animal models to the clinic.


Conflict of interest statement

Conflict of Interest Statement: LdB and FLvD were employees of Synaffix at the time of this work. GMT has served as a consultant for AstraZeneca/MedImmune, Advanced Proteome Therapeutics, Abbvie, Bristol Myers Squibb, Crescendo Biologics, CytomX Therapeutics, Eli Lilly, ImmunoGen, Immunomedics, InVicro, Lumicell, Nodus Therapeutics, Novartis, Mersana Therapeutics, Roche/Genentech, Seattle Genetics, and Takeda Pharmaceuticals.

Figures

Figure 1.
Figure 1.. High resolution imaging of payload penetration in spheroids.
(A) Schematic of pharmacodynamic marker (PD) manifestation for bystander and non-bystander ADC payloads. (B) Immunofluorescence microscopy of spheroids treated with 25 nM AF680-trastuzumab (green) conjugated to three different microtubule inhibitors. The PD signal (red) shows different extents of penetration into the spheroids. Nuclei are labeled with Hoechst (blue).
Figure 2.
Figure 2.. High resolution imaging of DNA damage payload penetration in spheroids.
Immunofluorescence microscopy of spheroids treated with 25 nM AF680-trastuzumab (green) conjugated to DNA-interacting payloads (CaliD, PBD, CaliG) or topoisomerase inhibitors (exatecan, DXd, SN-38) (A) at early time points (B) at later time points. The PD marker is shown in red, and nuclei in blue (Hoechst). Note that the CaliD ADC time points are 24 hrs earlier than other payloads.
Figure 3.
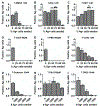
Figure 3.. Quantification of payload penetration.
(A-C) Microtubule inhibitors, (D-F) DNA interacting agents, (G-I) Topoisomerase 1 inhibitors. Mean ± SD across N=7 spheroids per group Green = AF680 ADC; solid orange = 24 hours PD signal, dashed red = 48 hours PD signal, dashed purple = 72 hours PD signal, Dotted black = pH3 autofluorescence. PD signal depicted here has been adjusted to non-specific signal from untreated spheroids (diffuse fluorescence not originating from cells).
Figure 4.
Figure 4.. Cytotoxicity and permeability provide valuable but incomplete information for in vivo bystander killing efficiency.
(A) Cytotoxic IC50 of trastuzumab-payload conjugates in HCC1954 cells (log scale), (B) Permeability of free payloads as measured using PAMPA, (C) Cytotoxic IC50 of free payloads in HCC1954 cells (log scale). *Ogitani et al. 2016(14)
Figure 5.
Figure 5.. In vitro bystander co-culture assay with HCC1954 (Ag+) and MDA-MB-468
(Ag−). The fraction of Ag- cells in treated wells versus Ag- cells in untreated wells is shown for different ratios of Ag+ and Ag- cell coculture. ADC dose was fixed to be above the IC90 for Ag+ cells and below the IC50 for Ag- cells where possible (Supplementary Figure 6). The ADC is internalized, and the payload is released inside the Ag+ cells. For a non-bystander payload, the payload is unable to escape the Ag+ cells, and therefore incapable of killing the surrounding Ag- cells. Therefore, the fraction of surviving Ag- cells (y axis) is ≥ 1 regardless of the ratio of Ag+ to Ag- cells (e.g. T-DM1). On the other hand, a bystander payload can escape Ag+ cells and efficiently accumulate in surrounding Ag- cells, leading to fraction of surviving Ag- cells (y axis) < 1 in the presence of Ag+ cells, approaching 0 with increasing ratio of Ag+ to Ag- cells. The more efficient the bystander effect, the smaller the number of Ag+ cells needed to drive the y-axis to 0.
Figure 6.
Figure 6.. Predictive simulations to distinguish bystander effects from bystander killing.
(A) Spheroid payload concentration patterns highlighting bystander distribution/effects, along with corresponding Da (200µm), (B) Conversion of payload concentration to expected pharmacodynamic response, highlighting the pattern of bystander killing.

Comment on

  • Selected Articles from This Issue.
    [No authors listed] [No authors listed] Mol Cancer Ther. 2022 Feb;21(2):243. doi: 10.1158/1535-7163.MCT-21-2-HI. Mol Cancer Ther. 2022. PMID: 35135870 No abstract available.

References

    1. Coats S, Williams M, Kebble B, Dixit R, Tseng L, Yao NS, et al. Antibody-Drug Conjugates: Future Directions in Clinical and Translational Strategies to Improve the Therapeutic Index. Clinical cancer research : an official journal of the American Association for Cancer Research 2019;25(18):5441–8 doi 10.1158/1078-0432.CCR-19-0272. - DOI - PubMed
    1. Nessler I, Khera E, Vance S, Kopp A, Qiu Q, Keating TA, et al. Increased Tumor Penetration of Single-Domain Antibody-Drug Conjugates Improves In Vivo Efficacy in Prostate Cancer Models. Cancer Res 2020;80(6):1268–78 doi 10.1158/0008-5472.CAN-19-2295. - DOI - PMC - PubMed
    1. Cazzamalli S, Dal Corso A, Widmayer F, Neri D. Chemically Defined Antibody- and Small Molecule-Drug Conjugates for in Vivo Tumor Targeting Applications: A Comparative Analysis. J Am Chem Soc 2018;140(5):1617–21 doi 10.1021/jacs.7b13361. - DOI - PMC - PubMed
    1. Tumey LN. Next Generation Payloads for ADCs. In: Damelin M, editor. Innovations for Next-Generation Antibody-Drug Conjugates Cham: Springer International Publishing; 2018. p 187–214.
    1. Burton JK, Bottino D, Secomb TW. A Systems Pharmacology Model for Drug Delivery to Solid Tumors by Antibody-Drug Conjugates: Implications for Bystander Effects. AAPS J 2019;22(1):12 doi 10.1208/s12248-019-0390-2. - DOI - PMC - PubMed

Publication types