. 2021 Dec 15;12(1):7299.
doi: 10.1038/s41467-021-27157-z.

Small molecule splicing modifiers with systemic HTT-lowering activity

Affiliations

Small molecule splicing modifiers with systemic HTT-lowering activity

Anuradha Bhattacharyya et al. Nat Commun. .

Abstract

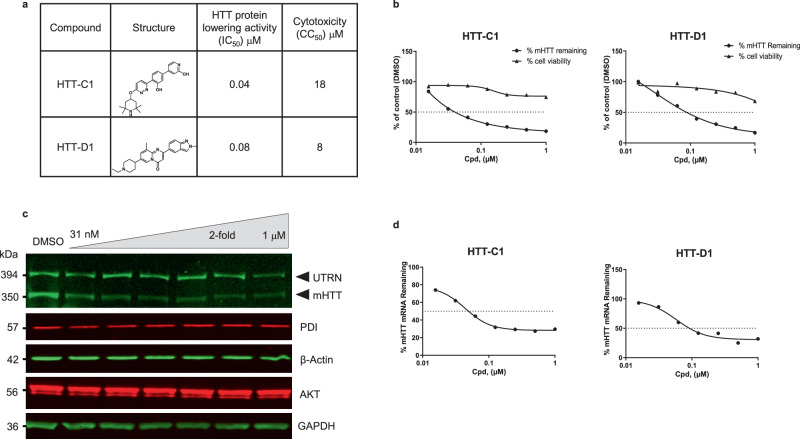
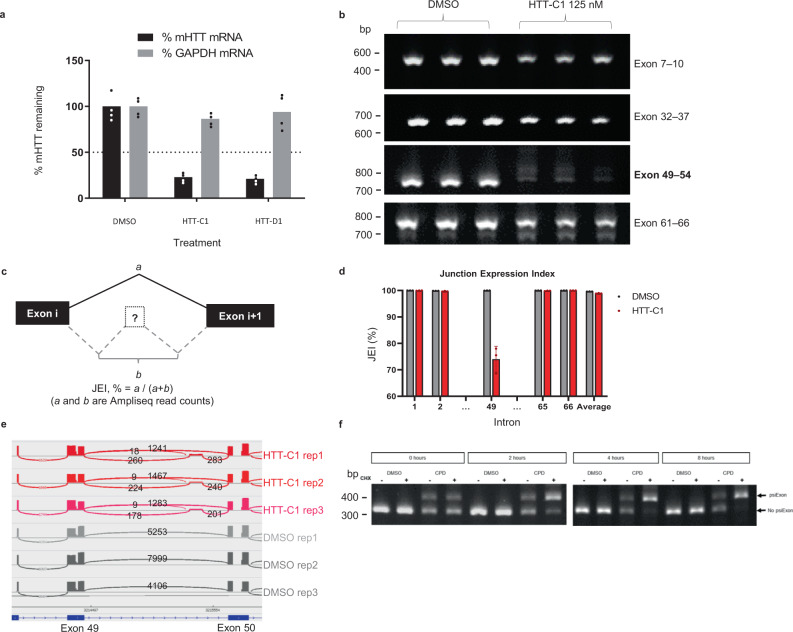
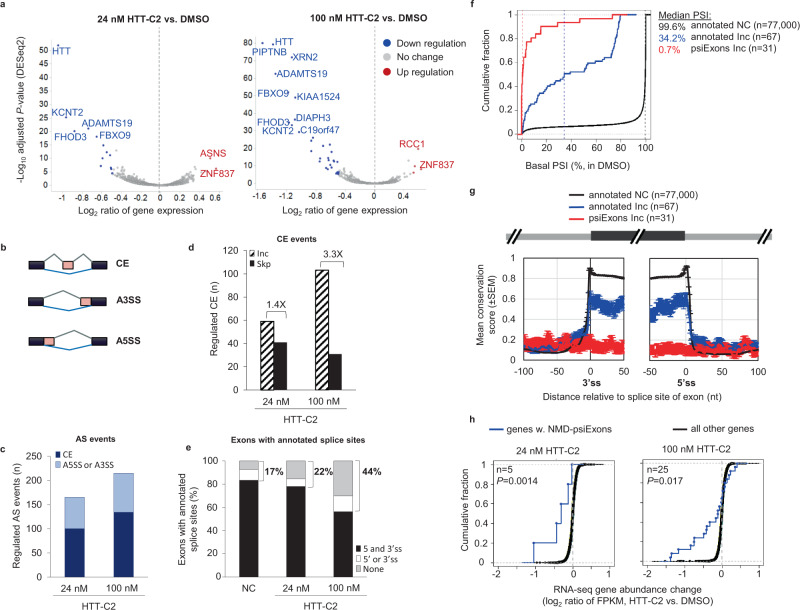
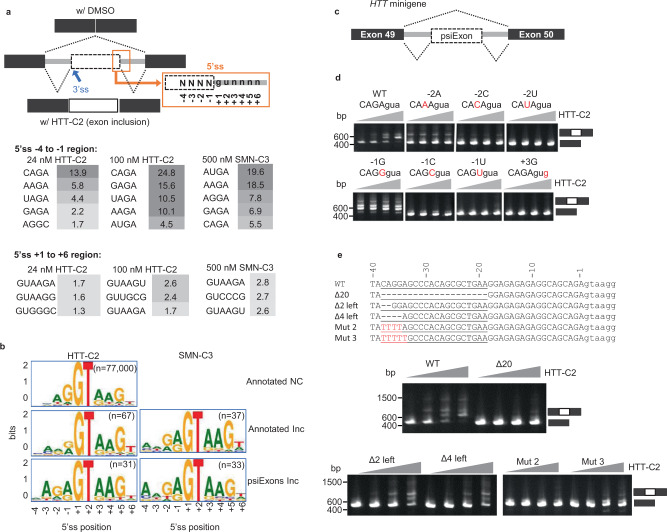
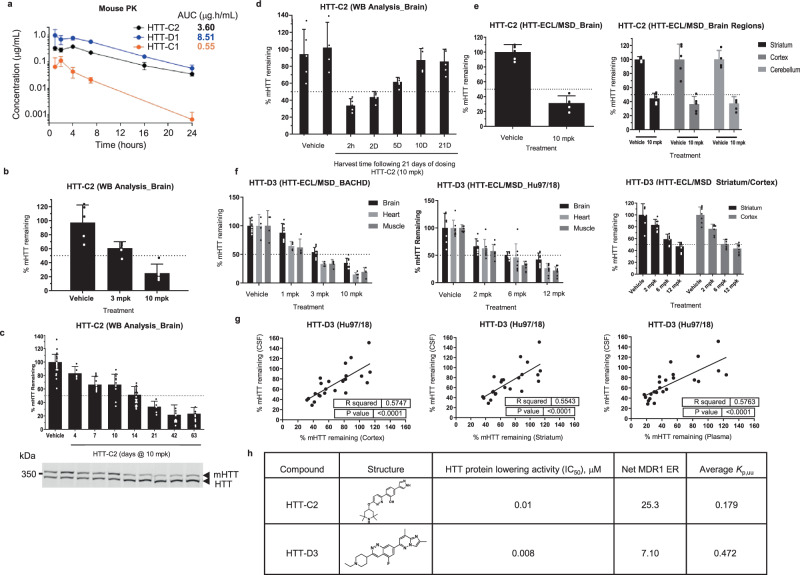
Huntington's disease (HD) is a hereditary neurodegenerative disorder caused by expansion of cytosine-adenine-guanine (CAG) trinucleotide repeats in the huntingtin (HTT) gene. Consequently, the mutant protein is ubiquitously expressed and drives pathogenesis of HD through a toxic gain-of-function mechanism. Animal models of HD have demonstrated that reducing huntingtin (HTT) protein levels alleviates motor and neuropathological abnormalities. Investigational drugs aim to reduce HTT levels by repressing HTT transcription, stability or translation. These drugs require invasive procedures to reach the central nervous system (CNS) and do not achieve broad CNS distribution. Here, we describe the identification of orally bioavailable small molecules with broad distribution throughout the CNS, which lower HTT expression consistently throughout the CNS and periphery through selective modulation of pre-messenger RNA splicing. These compounds act by promoting the inclusion of a pseudoexon containing a premature termination codon (stop-codon psiExon), leading to HTT mRNA degradation and reduction of HTT levels.


Conflict of interest statement

Anuradha Bhattacharyya, Amal Dakka, Kerstin A. Effenberger, Vijayalakshmi Gabbeta, Minakshi B. Jani, Wencheng Li, Nikolai Naryshkin, Christopher R. Trotta and Kari J. Wiedinger are inventors in International Application Number PCT/US2018/037412, assigned to PTC Therapeutics, Inc., entitled ‘Methods for Modifying RNA Splicing’, relating to the use of HTT-C1. Anuradha Bhattacharyya, Minakshi B. Jani, Young-Choon Moon and Nadiya Sydorenko are inventors in U.S Patent 10,874,672, assigned to PTC Therapeutics, Inc., entitled ‘Methods for Treating Huntington’s Disease’, relating to the use of HTT-C1. Anuradha Bhattacharyya, Minakshi B. Jani, Nadiya Sydorenko and Matthew G. Woll are inventors in International Application Number PCT/US2018/039775, assigned to PTC Therapeutics, Inc., entitled ‘Methods for Treating Huntington’s Disease’, relating to the use of HTT-D1. Nikolai Naryshkin is an inventor in U.S. Patent 10,195,202, assigned to PTC Therapeutics, Inc., entitled ‘Methods for Modulating the Amount of RNA Transcripts’, relating to the use of HTT-D1. Anuradha Bhattacharyya, Christopher R. Trotta, Jana Narasimhan, Wencheng Li, Kerstin A. Effenberger, Matthew G. Woll, Minakshi Jani, Nicole Risher, Shirley Yeh, Yaofeng Cheng, Nadiya Sydorenko, Young-Choon Moon, Gary M. Karp, Marla Weetall, Amal Dakka, Vijayalakshmi Gabbeta, Jason D. Graci, Thomas Tripodi, Jr., Joseph M. Colacino and Stuart W. Peltz are present employees of PTC Therapeutics, Inc., a biotechnology company. In connection with such employment, the authors received salary, benefits and stock-based compensation, including stock options, restricted stock, other stock-related grants and the right to purchase discounted stock through PTC’s employee stock purchase plan. Kari Wiedinger and Nikolai Naryshkin are former employees of PTC Therapeutics, Inc. and hold stock in the company. Amber Southwell and Michael Hayden declare no competing interests.

Figures

Fig. 1
Fig. 1. Huntingtin (HTT)-lowering activity in vitro.
a Chemical structures of HTT-C1 and HTT-D1. b Electrochemiluminescence (ECL) analysis of mutant HTT protein from fibroblasts isolated from a homozygous patient with Huntington’s disease (HD) (GM04857) after 96 h of continuous treatment with HTT-C1 and HTT-D1 (0.01–1.0 μM). Representative graphs show percent HTT remaining relative to the dimethyl sulphoxide (DMSO) control. Cell viability assays were performed in parallel. Data represent mean of two (n = 2) biologically independent samples per data point from one dose–response experiment. c Western blot of HTT protein and housekeeping proteins, oxidoreductase-protein disulphide isomerase (PDI), beta-actin, alpha serine/threonine-protein kinase (AKT) and glyceraldehyde-3-phosphate dehydrogenase (GAPDH) in HD fibroblasts after 96 h of continuous treatment with HTT-C1 (0.015–1.0 μM). Utrophin (UTRN) was also used as a loading control. The western blot data used a representative splicing modifier (tested at multiple concentrations) from a single experiment. Multiple splicing modifiers from the same class were tested and evaluated by western blot analyses. d Reverse transcription-quantitative polymerase chain reaction (RT-qPCR) analysis of HTT mRNA in patient fibroblasts after 24 h of treatment with HTT-C1 and HTT-D1 (0.01–1.0 μM). Representative graphs show percent HTT mRNA remaining relative to DMSO control; normalised to housekeeping gene, TATA-box binding protein. Data represent mean of two (n = 2) biologically independent samples per data point from one dose–response experiment.
Fig. 2
Fig. 2. Splicing of human huntingtin (HTT) pre-mRNA resulting in lowering of HTT mRNA.
a Reverse transcription-quantitative polymerase chain reaction (RT-qPCR) analysis of HTT mRNA in B-lymphocytes from the same patient (GM04856 cells) after 24 h of treatment with HTT-C1 and HTT-D1 (0.25 μM). Representative graphs show percent HTT mRNA remaining relative to dimethyl sulphoxide (DMSO) control; normalised to housekeeping gene, glyceraldehyde-3-phosphate dehydrogenase (GAPDH). Data represent the mean of two (n = 2) biologically independent samples per data point. b Reverse transcription-polymerase chain reaction (RT-PCR) analysis of HTT mRNA after 24-hour treatment with 125 nM HTT-C1 or DMSO in patient-derived B-lymphocytes (GM04856). The data are from a single experiment with three biologically independent samples per data point. The comprehensive data set is provided in Supplementary Fig. 2. c Diagram illustrating how the junction expression index (JEI) was calculated for each of the 66 introns in the HTT gene. d JEI of intron 49 and a selection of other introns. The JEI of intron 49 was significantly reduced, indicating a splicing event (>25% reduction; P < 0.05). Average JEIs are shown as bars. Error bars represent standard deviation. Data were based on three biological replicates of next-generation sequencing (NGS) data. e Sashimi plot of alternative splicing (AS) within intron 49 of the HTT pre-mRNA using NGS data. A minimum threshold of five reads was used to visualise these data in the Integrative Genomics Viewer. f Endpoint polymerase chain reaction (EP-PCR) analysis of GM04856 cells treated with DMSO or 250 nM HTT-C1. After 18 hrs, cells were treated with 10 µM cycloheximide or DMSO. Total RNA was isolated at 0, 2, 4 and 8 hrs. The data are from a single experiment with two biologically independent samples per data point.
Fig. 3
Fig. 3. Selectivity of compound-induced splicing.
a Volcano plot of RNA-Seq analysis comparing gene expression in SH-SY5Y cells treated with either 24 nM or 100 nM of HTT-C2 with dimethyl sulphoxide (DMSO) treatment. mRNAs with significant changes in expression (>1.5-fold, false discovery rate (FDR) < 5%) are shown as blue and red dots for down- and upregulation, respectively. b A schematic of alternative splicing (AS) events. CE, cassette exon; A3SS, alternative 3′ splice sites (ss); A5SS, alternative 5′ss. c Number of regulated AS events in SH-SY5Y RNA-Seq data following treatment with 24 nM and 100 nM HTT-C2. d Number of CEs inclusion (Inc) or skipping (Skp) after HTT-C2 treatment; ratio of Inc/Skp are shown in text. e Percentage of exons with 3′ and 5′ss annotated by public databases (Refseq, Ensembl, or UCSC Known Genes) for NC (no change) or Inc exons. f Cumulative distribution function (CDF) curves of basal percent-spliced-in (PSI) index (average PSI in DMSO samples). The graph shows data for exons separated into three groups; Inc is based on ΔPSI > 20% and two-sided Fisher’s Exact Test P < 0.001 in any one of the two conditions (24 nM or 100 nM HTT-C2 vs. DMSO). Median values are shown as dashed vertical lines for each group. g Sequence conservation of 3′ss and 5′ss region. Conservation is based on phastCons score for 46-way placental mammals. Mean (standard error of mean [SEM]) conservation scores are shown. h CDF curves of RNA-Seq mRNA abundance change for genes with predicted nonsense-mediated mRNA decay (NMD)-psiExons. NMD-psiExons are psiExons whose inclusion in mRNA introduces a premature termination codon or causes frameshift or both, and are included (Inc) following HTT-C2 treatment. Number of genes (n) and P value are indicated. P value is based on comparison with “all other genes” group using Wilcoxon rank-sum test (two-sided).
Fig. 4
Fig. 4. Regulation of compound-induced splicing for HTT-C2 and SMN-C3.
a 5′ splice sites (ss) sequence at regions (−4 to −1 and +1 to +6) were studied for the enrichment of Inc (included) vs. NC (no change) exons. Significance scores are shown. Wide boxes represent exons. b Schematic of 5′ss sequence logo in the three exon groups: annotated NC, annotated (inclusion) Inc and psiExons Inc. c Diagram illustrating the design of huntingtin (HTT) minigene constructs for studying compound-induced splicing. d Polymerase chain reaction (PCR) analysis of RNA extracts from HEK293 cells transfected with wild-type (wt) human HTT minigene or constructs with point mutations in the −2 to +3 region of the 5′ss; cells were treated with dimethyl sulphoxide (DMSO) or HTT-C2 (0.010–1 µM). The data are from a single transfection experiment with multiple concentrations tested for a given construct; the “WT” control construct has been used multiple times (n > 3). e Sequence of the 20-nucleotide region upstream of the 5′ss of HTT stop-codon psiExon49a showing partial deletions and mutations performed on this region, and their effects on HTT-C2 induced splicing (lower panel). Through partial deletion or mutation of the nucleotides CAGGA at positions −38 to −34, this region was shown to be important in regulating splicing events. The data are from a single transfection experiment with multiple concentrations tested for a given construct; the “WT” control construct has been used multiple times (n > 3).
Fig. 5
Fig. 5. Compounds eliciting human huntingtin (HTT)-lowering in vivo.
a Plasma levels of HTT-C1, HTT-D1 and HTT-C2 over 24 h in BACHD mice after a single 10 mg/kg dose. b Western blot analysis of human HTT protein within the brain tissue of BACHD mice treated with HTT-C2 (3 mg/kg or 10 mg/kg) once daily for 14 days; graph shows percent lowering relative to vehicle control and normalised to mouse Htt protein. Data represent mean ± SD (error bars) of five animals per data point. c Western blot analysis of 10 mg/kg HTT-C2 induced lowering of human HTT protein within brains of BACHD mice over time. Graph shows percent lowering relative to vehicle control and normalised to mouse Htt protein. Example western blot shown below graph with mouse Htt as a loading control. Data represent mean ± SD (error bars) of five animals per data point. d Western blot analysis of human HTT protein expression levels in brain tissue over time following cessation of 10 mg/kg HTT-C2 treatment in BACHD mice. Graph shows percent lowering of human HTT protein relative to vehicle control and normalised to mouse Htt protein. Data represent mean ± SD (error bars) of five to eight animals per data point. e Electrochemiluminescence (ECL) analysis of human HTT protein expression levels within different parts of the brain from BACHD mice treated with 10 mg/kg HTT-C2. Graphs show percent lowering relative to vehicle control and normalised to utrophin (UTRN). Data represent mean ± SD (error bars) of five to eight animals per data point. f ECL analysis of human HTT protein expression levels within different tissues, including the striatum and cortex, of Hu97/18 mice and BACHD mice treated with HTT-D3. Graphs show percent lowering relative to vehicle control and normalised to Kirsten rat sarcoma viral oncogene homologue (KRAS). Data represent mean ± SD (error bars) of five to eight animals per data point. g Regression analysis to show the correlation between HTT lowering of HTT-D3 in the cortex, striatum and plasma of Hu97/18 mice relative to the cerebrospinal fluid (CSF). Correlations were analysed (using GraphPad Prism) by linear regression with R2 and P values indicated on graphs. P values of <0.05 were considered statistically significant. h Chemical structures of HTT-C2 and HTT-D3.

References

    1. Wild EJ, Tabrizi SJ. Therapies targeting DNA and RNA in Huntington’s disease. Lancet Neurol. 2017;16:837–847. doi: 10.1016/S1474-4422(17)30280-6. - DOI - PMC - PubMed
    1. Tabrizi SJ, Ghosh R, Leavitt BR. Huntingtin lowering strategies for disease modification in Huntington’s disease. Neuron. 2019;101:801–819. doi: 10.1016/j.neuron.2019.01.039. - DOI - PubMed
    1. Nopoulos PC. Huntington disease: a single-gene degenerative disorder of the striatum. Dialogues Clin. Neurosci. 2016;18:91–98. doi: 10.31887/DCNS.2016.18.1/pnopoulos. - DOI - PMC - PubMed
    1. Saudou F, Humbert S. The biology of Huntingtin. Neuron. 2016;89:910–926. doi: 10.1016/j.neuron.2016.02.003. - DOI - PubMed
    1. Rüb U, et al. Huntington’s disease (HD): the neuropathology of a multisystem neurodegenerative disorder of the human brain. Brain Pathol. 2016;26:726–740. doi: 10.1111/bpa.12426. - DOI - PMC - PubMed

MeSH terms