. 2021 Dec 15;12(1):7302.
doi: 10.1038/s41467-021-27464-5.

Single-cell transcriptomics captures features of human midbrain development and dopamine neuron diversity in brain organoids

Affiliations

Single-cell transcriptomics captures features of human midbrain development and dopamine neuron diversity in brain organoids

Alessandro Fiorenzano et al. Nat Commun. .

Erratum in

Abstract

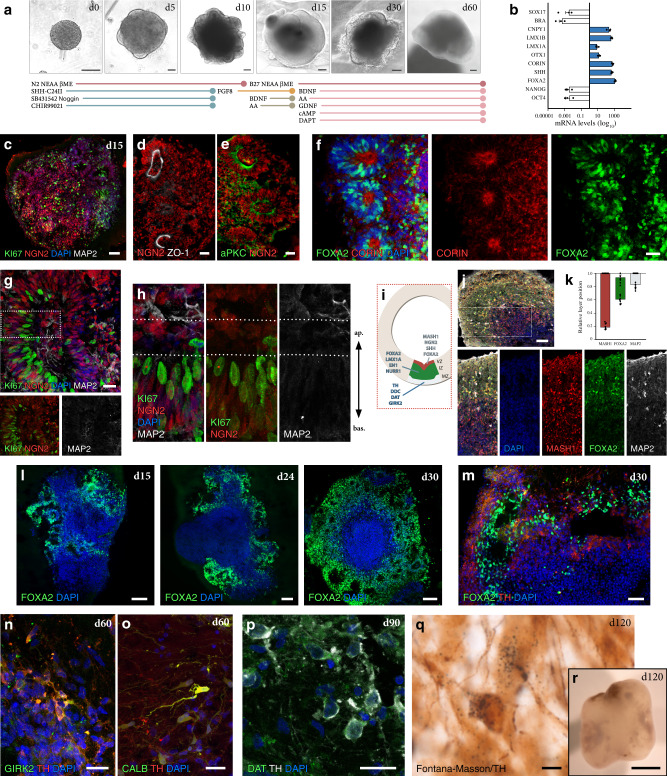
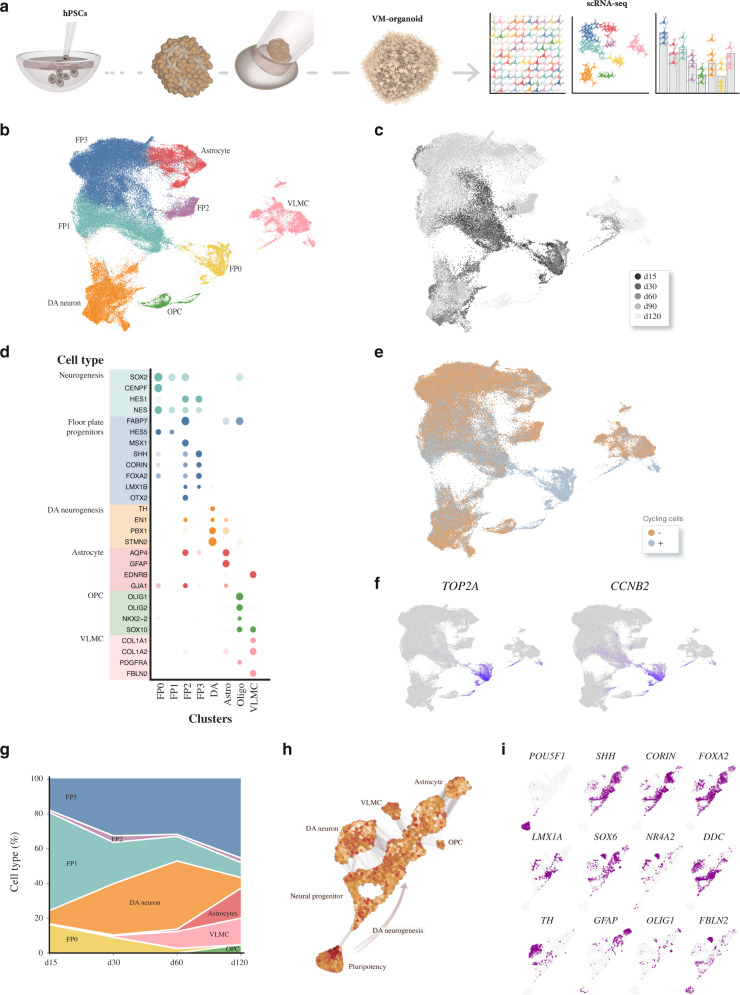
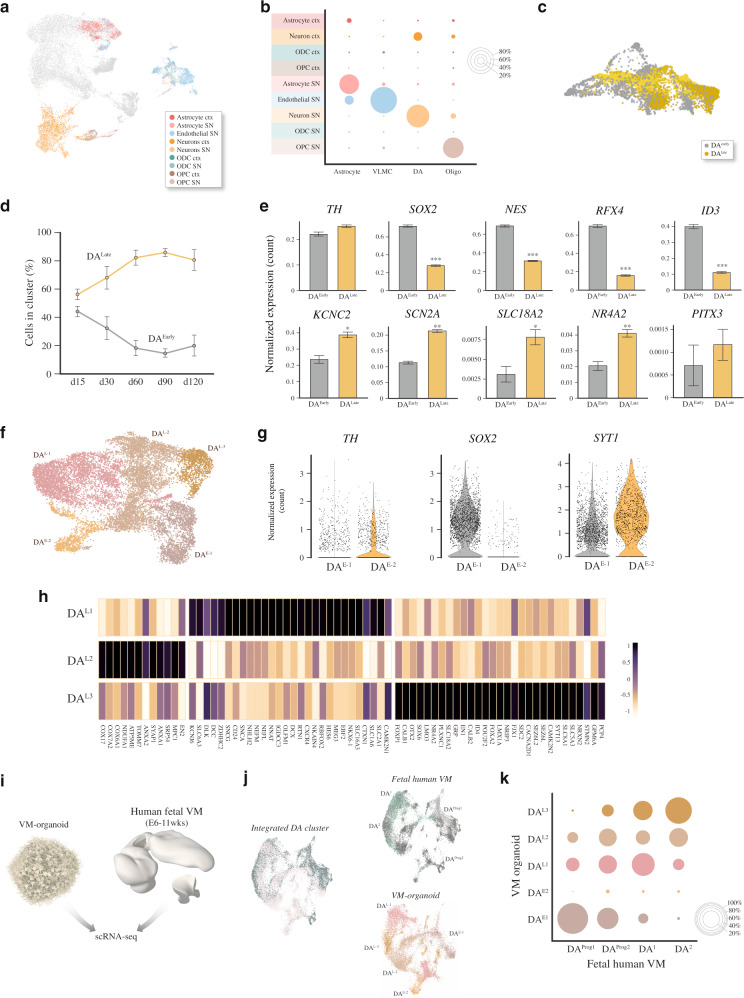
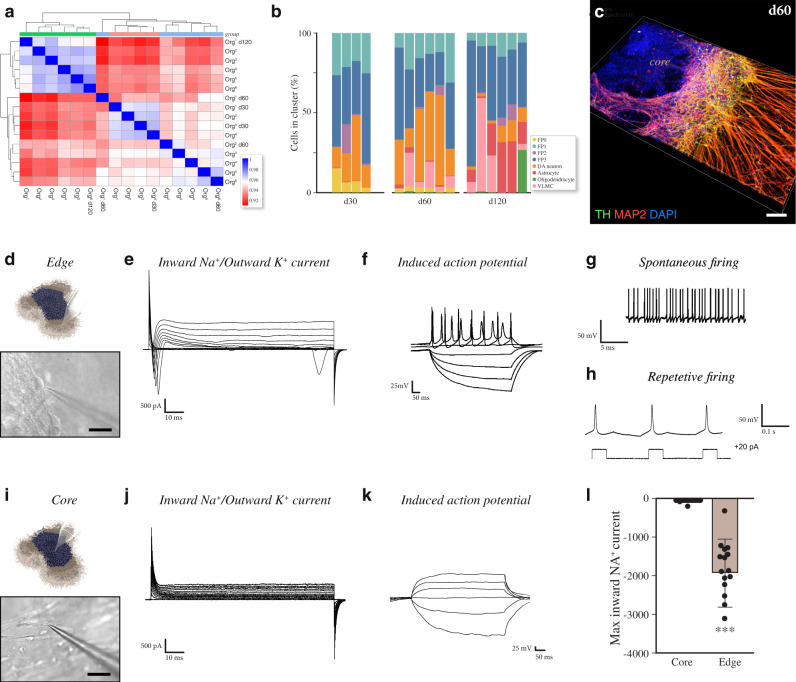
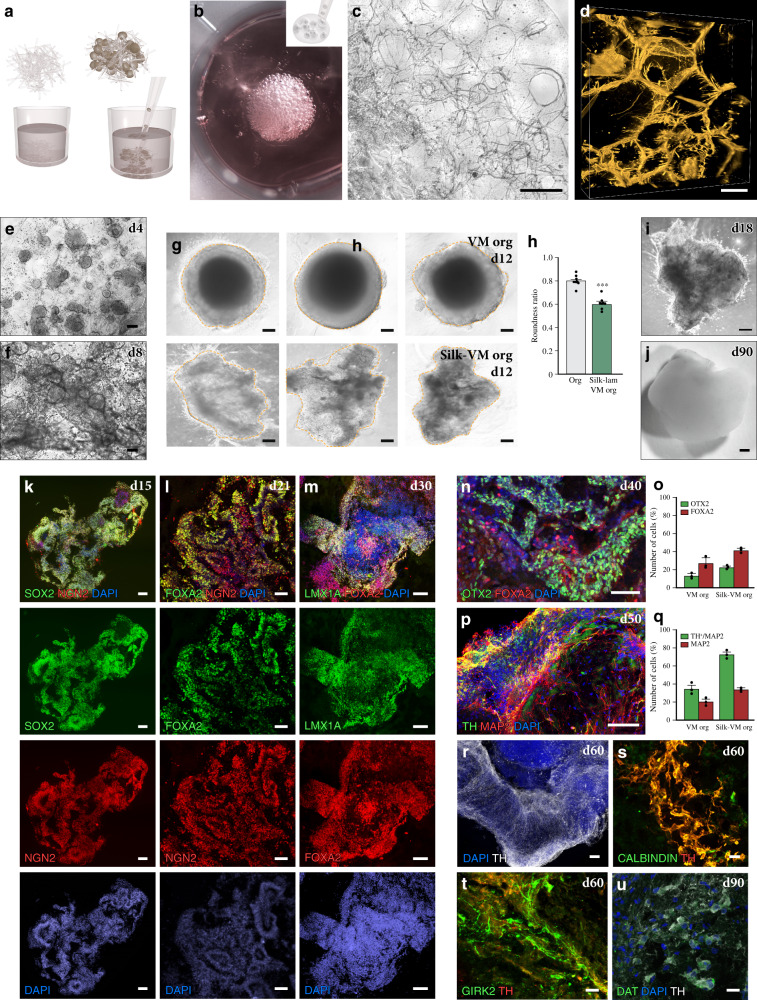
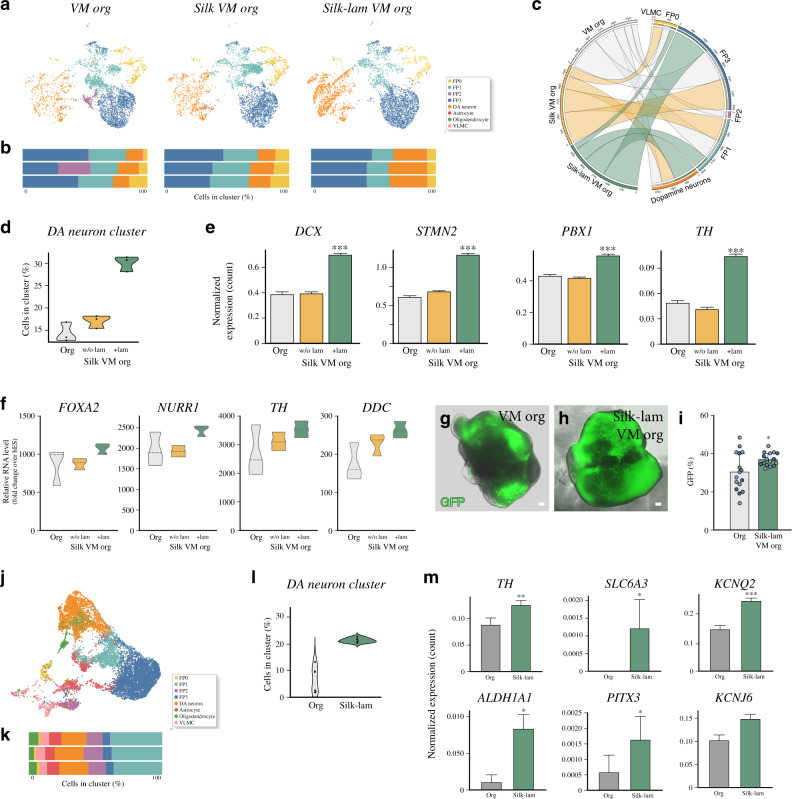
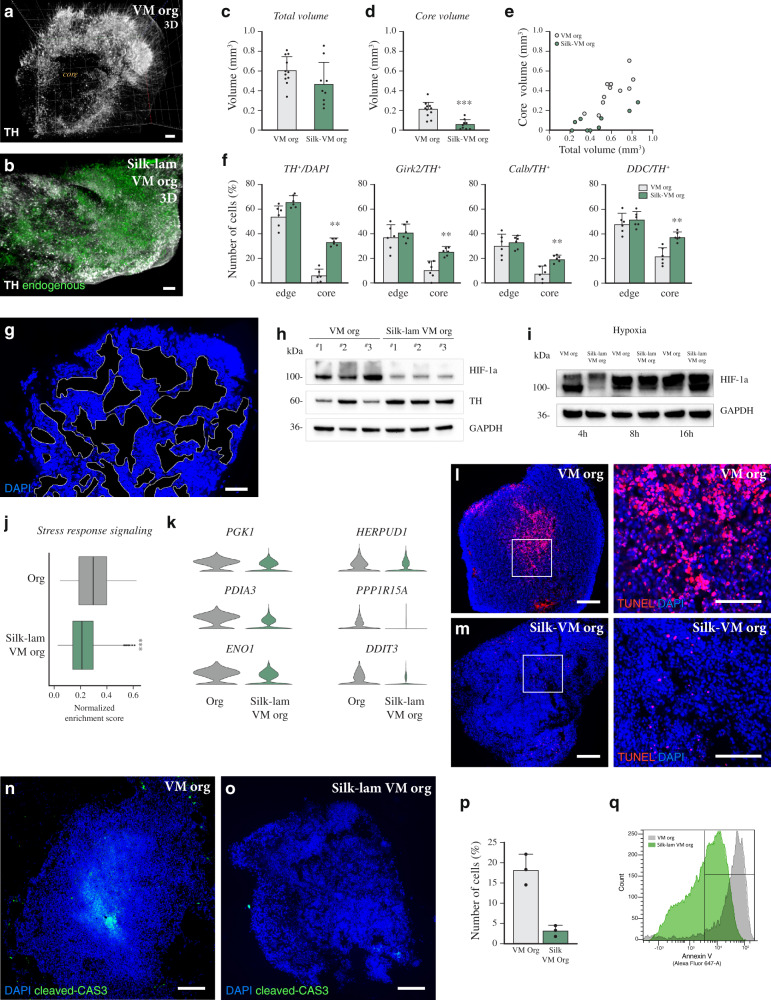
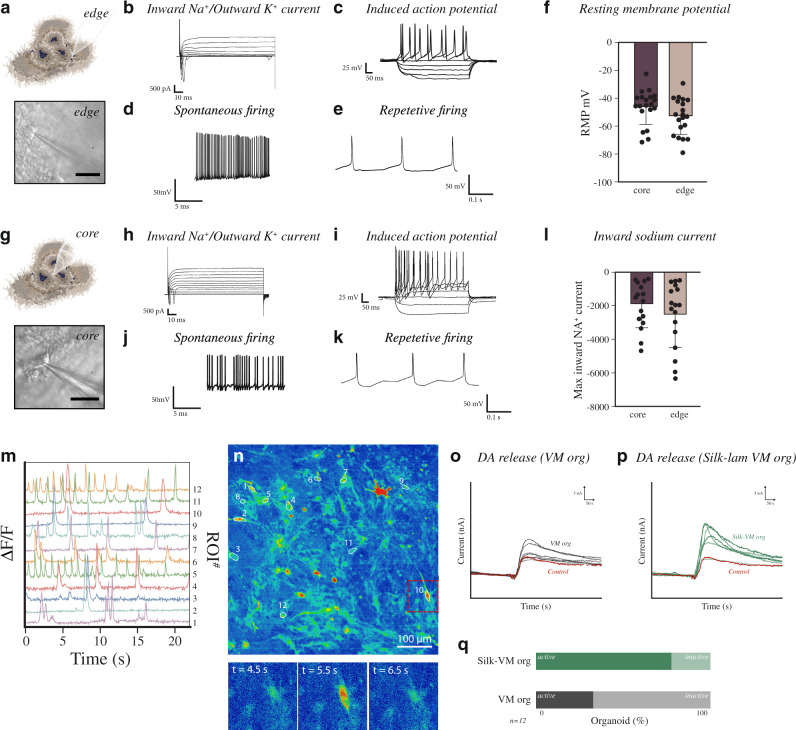
Three-dimensional brain organoids have emerged as a valuable model system for studies of human brain development and pathology. Here we establish a midbrain organoid culture system to study the developmental trajectory from pluripotent stem cells to mature dopamine neurons. Using single cell RNA sequencing, we identify the presence of three molecularly distinct subtypes of human dopamine neurons with high similarity to those in developing and adult human midbrain. However, despite significant advancements in the field, the use of brain organoids can be limited by issues of reproducibility and incomplete maturation which was also observed in this study. We therefore designed bioengineered ventral midbrain organoids supported by recombinant spider-silk microfibers functionalized with full-length human laminin. We show that silk organoids reproduce key molecular aspects of dopamine neurogenesis and reduce inter-organoid variability in terms of cell type composition and dopamine neuron formation.


Conflict of interest statement

M.P. is the owner of Parmar Cells AB and co-inventor of the following patents WO2016162747A2, WO2018206798A1, and WO2019016113A1. The remaining authors declare no competing interests.

Figures

Fig. 1
Fig. 1. Dopamine neurogenesis in VM organoids.
a Representative bright-field images of ventral midbrain (VM) organoid differentiation at different time points (upper) and schematic overview of the experimental design (lower). Scale bars, 200 µm. b qRT-PCR of selected markers at day 15 of VM organoid differentiation. The results are given as fold change over undifferentiated hPSCs. Data represent mean ± SEM of 3 independent organoids. ce Immunocytochemistry of (c) NGN2/Ki67/MAP2, (d) NGN2/ZO-1, and (e) NGN2/aPKC at day 15 during VM organoid differentiation. Scale bars, 50 µm. f Immunohistochemistry of FOXA2/CORIN and g NGN2/Ki67/MAP2 in VM organoid at day 15. Scale bars, 100 µm (f) and 50 µm (g). h High-power magnification of the inset in g. i Schematic representation of developing DA neurons in vivo showing genes expressed at different stages of development (MZ, mantle zone; IZ, intermediate zone; VZ, ventricular zone). j Immunohistochemistry of MASH1, FOXA2, and MAP2 showing layer-specific organization and k relative quantification of fluorescence staining in VM organoid at day 24. Data represent mean ± SEM of 7 independent VM organoids. Scale bar, 100 µm. l Immunohistochemistry of FOXA2 across a time course (day 15–30). Scale bars, 50 µm. m Cryosection of VM organoid at month 1 showing TH/FOXA2 double staining. Scale bars, 100 µm. n, o Immunohistochemistry of TH stained with GIRK2/CALB at day 60 and p with DAT at day 90. Scale bars, 50 µm (n, o) and 20 µm (p). q Fontana Masson/TH double-stained cryosection from long-term cultured VM organoid (month 4). Scale bars, 50 µm. r Representative bright-field image of VM organoid at month 4. Scale bars, 1 mm. Nuclei were stained with DAPI in g, h, j, lp. Source data are provided as a Source Data file.
Fig. 2
Fig. 2. Single-cell transcriptomics identifying VM organoid cell types.
a Schematic overview of the experimental design. hPSCs differentiated into regionalized VM organoids for up to 120 days, were analyzed at single-cell resolution. b 2D scatterplot of uniform manifold approximation and projection (UMAP) embeddings showing clustering of 91,034 analyzed cells from VM organoids at days 15, 30, 60, 90, and 120. Cell-type assignments are indicated. c UMAP plot of cells color-coded by organoid of origin. d Dot plot showing expression levels of indicated genes in each cluster. Indicated genes are established markers for neural progenitors, floor-plate progenitors, DA neurons, astrocytes, oligodendrocyte progenitors (OPCs), and vascular leptomeningeal cells. e UMAP plots showing cell cycle classification of analyzed cells (Seurat CellCycleScoring predictions). Cycling cells shown with gray dots. f Expression levels of indicated cell cycle genes visualized in the UMAP plots. g Proportion of each cell type along the temporal axis during VM organoid differentiation (day 15–120). h Developmental trajectory from pluripotency to terminally differentiated stages in VM organoid reconstructed using SPRING in VM organoid. Pseudocells are color-graded by total count. i SPRING plot colored (purple) by marker gene expression in emerging cellular clusters.
Fig. 3
Fig. 3. Single-cell transcriptomics mapping DA diversity in VM organoids.
a UMAP cluster-integration analysis combining published scRNA-seq datasets of adult human midbrain and the hPSC-derived VM organoids with b, relative overlapping quantification. c SPRING network plot showing the distribution of single cells in 2 dopamine (DA) clusters (DAEarly, gray, and DALate, yellow) within the VM organoids. d Percent distribution of DAEarly and DALate clusters across a time course during VM organoid differentiation (d15 n = 2; d30 n = 5; d60 n = 5; d90 n = 2; d120 n = 6). Data represent mean ± SD per 10X run. e Bar plot of normalized expression for DAEarly and DALate clusters of immature and mature neuronal marker genes (d15 n = 2; d30 n = 5; d60 n = 5; d90 n = 2; d120 n = 6). Data represent mean ± SEM, two-tailed Wilcoxon Rank Sum test, KCNC2 p = 0.0045; SCN2A p = 0.0002; SLC18A2 p = 0.0269; NR4A2 p = 0.0013, ***p < 0.0001. f UMAP plot showing DA subclusters after reintegration and clustering (DAE-1, DAE-2, DAL-1, DAL-2, and DAL-3). g Violin plots showing differential expression levels of indicated genes in each DAEarly subclusters. h Heatmap showing differentially expressed genes and manually selected markers in 3 DALate neuron subclusters (DAL-1, DAL-2, and DAL-3). i Schematic overview of experimental design where scRNAseq data from dissected human fetal VM (6–11-week embryos) and 3D primary cultures thereof (1 month) Birtele et al., bioRxiv doi.org/10.1101/2020.10.01.322495. j Overlapping and individual UMAP plots showing DA subcluster-integration analysis from scRNA-seq dataset of human fetal VM and hPSC-derived VM organoid. k Relative overlapping quantification of DA organoid subtypes vs human fetal DA neuron dataset after prediction of DA neuronal subtypes using fetal data as reference (Seurat).
Fig. 4
Fig. 4. Molecular and functional heterogeneity in human VM organoids.
a Clustering of sample to sample correlations (Pearson) of organoids and different timepoints using Euclidean distance on normalized and log‐transformed read counts. b Percentage of cells belonging to each cell cluster from individual organoids at days 30, 60, and 120. Intraclass correlation coefficient (correlation metric that considers group structure in the data) decreased from 0.717 at day 30 to 0.682 at day 60 and to 0.548 at day 120. c 3D reconstruction of an image stack from an 80 µm-thick optical section of TH and MAP2 immunohistochemistry at day 60. Scale bars, 100 µm. d Representative image of external functional recordings using whole-cell patch-clamp technique. Scale bars, 100 µm. e Representative trace from external patching showing inward sodium- and outward potassium-rectifying current traces of VM organoid at day 90 triggered by stepwise depolarization. f Patch-clamp recordings of external VM organoid cells depicting current-induced action potentials (APs) at day 90 (−85 pA to +165 pA with 20 pA steps). g External spontaneous firing at resting-membrane potential indicative of mature DA neuronal physiology in VM organoids at day 90. h Example trace of rebound depolarization after brief membrane depolarization (20pA) indicative of DA phenotype in externally located cells. i Representative image of internal functional recordings using whole-cell patch-clamp technique, Scale bars, 100 µm. j Representative inward sodium- and outward potassium-rectifying current traces of internally located cells at day 90 triggered by stepwise depolarization. k Patch-clamp recordings of internal VM organoid cells depicting the absence of current-induced APs at day 90 (−85 pA to +165 pA with 20 pA steps). l Inward sodium current quantifications in externally (n = 20) and internally (n = 16) localized cells within VM organoids at day 90. Data represent mean ± SD, unpaired two-tailed t-test, p = 0.0007. Source data are provided as a Source Data file.
Fig. 5
Fig. 5. Generation and characterization of silk-VM organoids.
a Schematic representation of silk-VM organoid generation. b Representative image of cells dispersed throughout silk foam. c Bright-field and d confocal images of 3D silk scaffold after reabsorption of foam. Scale bars, 50 µm. e, f Bright-field images showing adherence and growth of cells along the length of silk microfibers at days 4 and 8. Scale bars, 200 µm. g Representative bright-field images, and h, roundness measurement of VM organoids grown with and without scaffold at day 12. Scale bars, 100 µm. Data represent mean ± SEM of 8 biologically independent organoids, two-tailed Mann–Whitney test, ***p < 0.0001. i Representative bright-field images of a short-term and, j, long-term silk-VM organoid culture. Scale bar, 200 µm. k Immunohistochemistry of SOX2/NGN2 from organoid at day 15 and l–n FOXA2 across a time course from day 21 to 40, stained with NGN2 (l), LMX1A (m), and OTX2 (n). Scale bars, 100 µm (l, n) and 50 µm (k, m). o Quantifications of OTX2+ and FOXA2+ cells in VM and silk-VM organoids. Data represent mean ± SEM obtained from 3 independent organoids. p Immunohistochemistry of TH and MAP2 and q, quantifications of MAP2 and TH/MAP2 in VM and silk-VM organoids at day 50. Data represent mean ± SEM obtained from 3 independent organoids per condition. Scale bars, 100 µm. r Immunohistochemistry of TH and s, t with CALB1/GIRK2 at day 60. Scale bars, 20 µm. u Immunohistochemistry of TH stained with DAT at day 90. Scale bars, 20 µm. Nuclei were stained with DAPI in jl, m, o, q and t. Source data are provided as a Source Data file.
Fig. 6
Fig. 6. Single-cell transcriptomics identifying silk-VM organoid cell composition.
a UMAP plots showing cell clusters from conventional VM, silk-VM, and silk-lam VM organoids and b, percentage of cells belonging to each cell cluster from individual organoids at month 1. c Chord diagram visualizing cell-type interrelationships between conventional, silk-VM and silk-lam VM organoids. d Violin plot showing the percentage of cells belonging to DA neuron clusters from conventional, silk-VM, and silk-lam VM organoids at month 1 from three individual organoids per condition. e Expression of selected markers belonging to DA neuron cluster in conventional, silk-VM, and silk-lam VM organoids at 1 month. Data represent mean ± SEM of 3 biologically independent organoids, two-tailed Wilcoxon Rank Sum test, ***p < 0.0001. f qRT-PCR analysis of early and late DA neuron markers in conventional and silk/silk-lam VM individual organoids at month 2. Data represent mean ± SEM of 3 independent organoids per condition. g, h Representative images of GFP expression in conventional and silk-lam VM organoids differentiated from the CRISPR/Cas9-mediated gene-edited TH-Cre hPSC line. Scale bars, 100 µm. i FACS-based quantification of GFP expression in conventional and silk-lam VM organoids differentiated from a CRISPR/Cas9-mediated gene-edited TH-Cre hPSC line in 4 biologically independent experiments shown as color-coded dots (green, light blue, blue and purple). Data represent mean ± SD, two-tailed unpaired t test p = 0.0162. j UMAP plot showing cell clusters from silk-lam VM organoids and k, percentage of cells belonging to each cell cluster from individual organoids at month 4. l Violin plot of percentage of cells belonging to DA neuron cluster from conventional and silk-lam VM organoids at month 4 from three individual organoids. m Expression of selected markers belonging to DA neuron cluster in conventional and silk-lam VM organoids at month 4. Data represent mean ± SEM of 3 biologically independent organoids, two-tailed Wilcoxon Rank Sum test, TH p = 0.0045, SLC6A3 p = 0.010462, KCNQ2 p = 0.0007, ALDH1A1 p = 0.046. Source data are provided as a Source Data file.
Fig. 7
Fig. 7. Silk fibers result in more homogeneous VM organoids.
a iDISCO circuitry reconstruction obtained by mapping TH in conventional and b silk-lam VM organoids at day 60. Scale bar, 100 µm. c iDISCO-based total volume quantification and d, e core quantification of conventionally and silk-lam-generated VM organoids. Data represent mean ± SEM obtained from 11 and 9 independent conventionally and silk-lam-generated VM organoids respectively, two-tailed Mann–Whitney test, p = 0.0002. f Percentages of TH+, GIRK2+, CALB+, and DDC+ expressing cells located in the outer and inner layers in conventionally and silk-lam-generated VM organoids. Data represent mean ± SEM obtained from 6 biologically independent organoids per condition, two-tailed Mann–Whitney test, p = 0.002. g Immunohistochemistry showing microporous dimension. Scale bars 100 µm. h Representative Western blots of HIF-1α protein and TH expression in conventional and silk-lam VM organoids in normoxia conditions (21% O2). GAPDH was used as loading control. i Representative Western blots of HIF-1α protein in conventional and silk-lam VM organoids across a time course of 4 h, 8 h and 16 h under hypoxia conditions (<1% O2). GAPDH was used as loading control. j Gene Set Enrichment Analysis of Stress response signaling. Lower and upper hinges correspond to the first and third quartiles and the whisker extends from the hinge to the largest value no further than |1.5 * IQR | from the hinge (where IQR is the interquartile range, or distance between the first and third quartiles); two-tailed Wilcoxon Rank Sum test, ***p < 0.0001. k Representative markers of metabolic stress of DA neurons in VM organoids grown with and without scaffold at 4 months. l, m TUNEL staining of VM organoids grown with and without scaffold at 6 months. Scale bars, 100 µm. n, o Immunohistochemistry of cleaved caspase-3 and, p quantification of cleaved CAS3 over DAPI performed on conventional and silk-lam VM organoids at 6 months. Scale bars 100 µm. Data represent mean ± SEM of 6 biologically independent VM organoids per condition, two-tailed unpaired t-test, p = 0.0028. q FACS analysis for fluorescence intensity of Annexin-V staining in conventionally and silk-lam-generated VM organoids. Representative FACS plots of biological triplicates are shown. Nuclei were stained with DAPI in g, j. Source data are provided as a Source Data file.
Fig. 8
Fig. 8. Silk-VM organoids are functionally homogeneous.
a Representative images of functional recordings from the external part using whole-cell patch-clamp technique. Scale bars, 100 µm. b Representative inward sodium- and outward potassium-rectifying current trace of external VM organoid at day 90 triggered by stepwise depolarization. c Whole-cell patch-clamp recordings of external VM organoid cells depicting current-induced APs at day 90 (−85 pA to +165 pA with 20 pA steps). d Spontaneous firings at resting membrane potential indicative of mature DA neuronal physiology in silk-lam VM organoids in the external part at day 90. e Example trace of rebound depolarization after brief membrane depolarization (20 pA) indicative of DA phenotype in externally located cells. f Resting-membrane quantifications between externally (n = 20) and internally localized cells (n = 20) in VM organoids at day 90. Data represent mean ± SD. g Representative images of functional recordings from the internal region of organoid using whole-cell patch-clamp technique. Scale bars, 100 µm. h Representative internal inward sodium- and outward potassium-rectifying current trace of VM organoid at day 90 triggered by stepwise depolarization i, Whole-cell patch-clamp recordings in internal region of VM organoid cells depicting current-induced APs at day 90 (−85 pA to +165 pA with 20 pA steps). j Spontaneous firings at resting-membrane potential indicative of mature DA neuronal physiology in the internal region of silk-lam VM organoids at day 90. k Example trace of rebound depolarization after brief membrane depolarization (20 pA) indicative of DA phenotype in internally located cells. l Quantification of maximum inward sodium current recorded in internal (n = 16 cells) and external (n = 17 cells) regions. Data represent mean ± SD. m Differential fluorescence-intensity profile of intracellular Ca+ levels as a function of time in neurons expressing MAP2–GCamP5 at day 90. n Fluorescence image with marked regions of interest corresponding to recorded cells and three timeframes displaying the change in intracellular fluorescence intensity. Scale bar, 100 µm. o, p Representative analysis of real-time DA release chronoamperometric measurements in conventional and silk-lam VM organoids and q, relative quantification (n = 12).

References

    1. Kelava I, Lancaster MA. Stem cell models of human brain development. Cell Stem Cell. 2016;18:736–748. - PubMed
    1. Rifes P, et al. Publisher correction: modeling neural tube development by differentiation of human embryonic stem cells in a microfluidic WNT gradient. Nat. Biotechnol. 2020;38:1357. - PubMed
    1. Demers CJ, et al. Development-on-chip: in vitro neural tube patterning with a microfluidic device. Development. 2016;143:1884–1892. - PMC - PubMed
    1. Lancaster MA, et al. Cerebral organoids model human brain development and microcephaly. Nature. 2013;501:373–379. - PMC - PubMed
    1. Bagley JA, et al. Fused cerebral organoids model interactions between brain regions. Nat. Methods. 2017;14:743–751. - PMC - PubMed

Publication types