. 2021 Dec 15;12(1):7297.
doi: 10.1038/s41467-021-27620-x.

Protein phosphatase 2A inactivation induces microsatellite instability, neoantigen production and immune response

Affiliations

Protein phosphatase 2A inactivation induces microsatellite instability, neoantigen production and immune response

Yu-Ting Yen et al. Nat Commun. .

Abstract

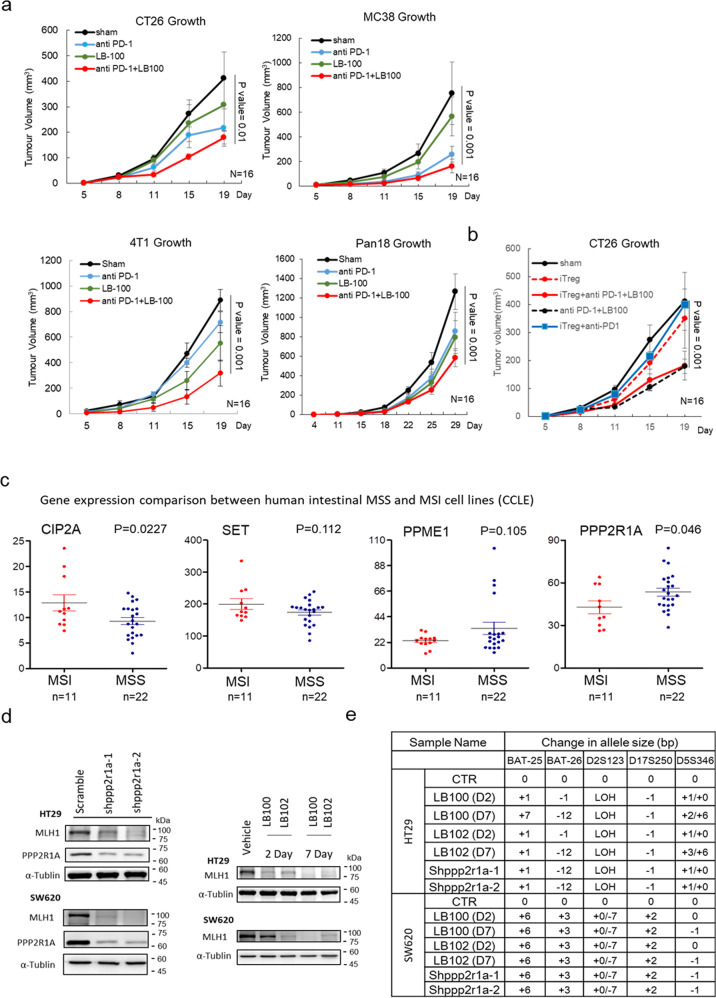
Microsatellite-instable (MSI), a predictive biomarker for immune checkpoint blockade (ICB) response, is caused by mismatch repair deficiency (MMRd) that occurs through genetic or epigenetic silencing of MMR genes. Here, we report a mechanism of MMRd and demonstrate that protein phosphatase 2A (PP2A) deletion or inactivation converts cold microsatellite-stable (MSS) into MSI tumours through two orthogonal pathways: (i) by increasing retinoblastoma protein phosphorylation that leads to E2F and DNMT3A/3B expression with subsequent DNA methylation, and (ii) by increasing histone deacetylase (HDAC)2 phosphorylation that subsequently decreases H3K9ac levels and histone acetylation, which induces epigenetic silencing of MLH1. In mouse models of MSS and MSI colorectal cancers, triple-negative breast cancer and pancreatic cancer, PP2A inhibition triggers neoantigen production, cytotoxic T cell infiltration and ICB sensitization. Human cancer cell lines and tissue array effectively confirm these signaling pathways. These data indicate the dual involvement of PP2A inactivation in silencing MLH1 and inducing MSI.


Conflict of interest statement

The authors declare no competing interests.

Figures

Fig. 1
Fig. 1. PP2A loss or inhibition enhances cytotoxic T cell infiltration in colorectal cancer.
a, b Ppp2r1a-loss colon tumours were induced in Lgr5-EGFP-CreERT2; Ppp2r1aflox/flox by treatment with DMBA and tamoxifen for 36 days. Control colon tissues (Control) and Ppp2r1a-loss colon tumours were harvested for analysis. a Representative images of immunofluorescence showing increased CD8+ and CD20+ and decreased Foxp3+ infiltration in murine Ppp2r1a-loss colon tumours compared to controls. Arrows indicate positive signals. Images are representative of three biological independent samples for each group. Bar = 25 μm. b Gene set enrichment analysis (GSEA) for cytokine, chemokine, IFN-gamma response, and JAK-STAT signalling pathways in murine Ppp2r1a-loss colon tumours compared to controls. c TCGA-COAD (n = 461) and d TCGA-READ (n = 172) omics analysis revealed that CIP2A and SET levels were significantly positively correlated with CD8+, CD4+, and B cell infiltration levels and significantly negatively correlated with Treg infiltration, while PPP2R1A levels were negatively correlated with CD8+ infiltration but positively correlated with Treg infiltration. Results are determined by the Spearman correlation. Source data are provided as a Source data file.
Fig. 2
Fig. 2. PP2A loss or inhibition is associated with MSI status.
ag Lgr5-EGFP-CreERT2; Ppp2r1aflox/flox intestinal organoids were treated with 5 μg/ml DMBA, 50 μg/ml MNU, or 10 μg/ml PhIP in combination with or without tamoxifen (TAM) for 50 days. a Total numbers of somatic mutation events calculated from three biologically independent samples in each group display a very high mutational load. Data are denoted as mean ± s.e.m. b Mutational spectra of all base substitutions in organoid cultures treated with the indicated carcinogen and TAM. Similar mutation signatures were observed. c Heat map showing the cosine similarity scores for each indicated sample and COSMIC signature. The samples have been clustered according to the similarity score with each signature. The signatures have been ordered according to their similarity, such that very similar signatures cluster together. d The MSI status was evaluated by comparing mononucleotide repeats in each indicated sample. The mononucleotide regions mBAT-26, mBAT-37, mBAT-24, and L24372 were used to evaluate microsatellite instability. Mutant alleles are indicated with specific base pair as number(s) in each sample trace. Shifting or loss of heterozygosity (LOH) comparing to Control are marked with colour corresponding to each sample respectively. e Heat map of RNA-seq analysis of genes associated with DNA mismatch repair. f Western blotting and g immunohistochemical studies of MLH1 levels in organoid cultures treated with the indicated conditions. Blots are representative of two biological independent samples for each group. Images are representative of three biological independent samples for each group. Bar = 25 μm. h Ppp2r1a-loss colon tumours were induced in Lgr5-EGFP-CreERT2; Ppp2r1aflox/flox by treatment with DMBA, MNU or PhIP, and TAM for 36 days. Control colon tissues (Control) and Ppp2r1a-loss colon tumours were harvested for MLH1 level analysis by immunohistochemistry. Arrows indicate positive signals. Images are representative of three biological independent samples for each group. Bar = 25 μm. i Analysis of mRNA level expression were generated by the software from Gepia (http://gepia.cancer-pku.cn) using the data from TCGA and presented as mean ± s.e.m., revealing higher CIP2A (n = 372, P = 0.0096) and SET (n = 372, P = 0.05) and lower PPP2R1A (n = 372, P = 0.1576) levels in MSI compared to MSS. P value was determined by two-sided unpaired t test (CIP2A, SET) and Mann–Whitney U-test (PPP2R1A). j Human tissue array containing MSI and MSS colorectal tumours was assayed for CIP2A (n = 152, P = 0.0043), SET (n = 150, P = 0.0077) and PPP2R1A (n = 129, P = 0.64) levels by immunohistochemistry. (Left) Representative images are shown. Arrows indicate positive signals. Bar = 25 μm. (Right) Quantitative data are shown. P value was determined by a two-sided Mann–Whitney U-test. Source data are provided as a Source data file.
Fig. 3
Fig. 3. MLH1 loss caused by DNMT3A/B upregulation is mediated through the PP2A-Rb-E2F pathway.
a Immunoprecipitation performed with Capturem Protein A columns. Organoid lysates from WT mice were incubated with 1 µg of PPP2R1A antibody for 10 min. The antibody–lysate complex was applied to equilibrate Protein A spin columns. The eluted fraction was then subjected to SDS-PAGE to confirm the presence of PP2A B subunit antigen (52 kDa, detected by Cell Signaling #2290). Images are representative of one biological independent sample for each group. b Volcano plot for the comparison of RNA-seq data of Lgr5-EGFP-CreERT2; Ppp2r1aflox/flox intestinal organoids treated with and without DMBA and tamoxifen for 50 days. Differently expressed genes (fold change >2 and FDR < 0.05) are denoted in red or green. Plot is representative of three biological independent samples for each group. c Intersection of ppp2r1a interaction protein in a and differently expressed genes in b data (IP protein data are available in Supplementary Data 1 and RNA-seq data are available in GSE120241 with NIH/NCBI at GEO dataset). d The top 3 significant gene ontology categories from the 58 interacted proteins identified by GSEA (whole gene ontology category is listed in Supplementary Table 4). e Venn diagram showing overlap (gene numbers) among genes associated with regulation of TP53 activity, cell cycle, and RNA polymerase II transcription. The intersection contained four genes, including hdac2, ppp2cb, akt1, and rb1. Western blot analysis of f CT26 transfected with the indicated shRNAs, and treated with g vehicle control or 5-azacytidine (AZA, 1 μM for 1 days). Blots are representative of three biological independent samples for each group. h Human tissue array containing MSI and MSS colorectal tumours was assayed for p-Rb (n = 141, P = 0.0132) and p-HDAC2 (n = 138, P = 0.02) levels by immunohistochemistry. (Left) Representative pictures showing increased p-Rb and p-HDAC2 levels in MSI compared to MSS. Arrows indicate positive signals. Bar = 25 μm. (Right) Quantitative data are shown. P value was determined by two-sided Mann–Whitney U-test. Source data are provided as a Source data file.
Fig. 4
Fig. 4. Ppp2r1a knockdown triggers neoantigen generation and sensitises to ICB therapies in MSS tumours.
Ppp2r1a knockdown and PD-1 blockade synergistically elicit tumour rejection in a CD8+ T cell-dependent manner. a The flowchart of animal experiments. BALB/c mice were inoculated with 0.5 × 106 CT26 cells transfected with scramble (scr) or Ppp2r1a shRNA (shppp2r1a) subcutaneously in the flank. In all experiments, polyclonal hamster IgG and Anti-PD-1 (clone: RMP1-14, BioXcell) were administered using doses of 200 μg for the initial injection and 100 μg for subsequent injections. Mice were then intraperitoneally injected with isotype control IgG or anti-PD1 antibodies (200 μg, per mouse) on days 5, 8, and 11 following tumour injection. be The indicated CT26 clones were injected into syngeneic BALB/c mice. Tumour growth curves were compared and tumour samples were harvested for further analysis. Three independent experiments were done. Data of representative experiments are shown as mean ± s.e.m. (n = 5). P value was determined by two-way ANOVA. f (Left) Immunofluorescence of CD8 and CD4 was performed on CT26-scr and CT26-shppp2r1a tumours to assess CD8+ and CD4+ T cell infiltration at the indicated time points. Bar = 25 μm. f (Right) Quantification of CD8+ density. Three independent experiments were done. Data of representative experiments are shown as mean ± s.e.m. (n = 5). P = 0.0046 was determined by two-sided one-way ANOVA. g A Venn diagram showing a total of 220 genes, including 270 missense transcripts, shared by three CT26-shppp2r1a tumours but not found in the CT26-scr tumour. h Distribution of the 20 most frequent TCR rearrangements identified in peripheral blood from mice (n = 3 for each group) injected with the indicated CT26 clones. The width of the violins is proportional to the number of TCR templates in each level of the y axis; the bars inside the violins show the quartiles of the 20 templates; bars span the first to third quartiles; the horizontal lines inside the bars represent the median; the grey zones represent all samples; the white circle shows the median value. TCR analysis was performed on blood samples obtained 13 days after injection of the tumour cells, as described in the “Methods” section. Source data are provided as a Source data file.
Fig. 5
Fig. 5. Combinational effect of PP2A inhibition and ICB on killing MSS tumours is independent of Treg inhibition.
a PP2A inhibition and PD-1 blockade synergistically elicit tumour rejection. BALB/c mice were inoculated with 0.5 × 106 CT26 or 4T1 cells, and C57BL/6 mice were inoculated with 0.5 × 106 MC38 or 0.5 × 105 Pan18 cells subcutaneously in the flank. When tumours reached between 50 and 100 mm3, mice were randomised into four treatment groups, including Sham, anti-PD-1 (200 μg per mouse, clone: RMP1-14, BioXcell), LB100 (0.16 mg/kg), and anti-PD-1 with LB100 combination. Treatments were administered by intraperitoneal injection on days 5, 8, and 11. Three independent experiments were done. Data of representative experiments are shown as mean ± s.e.m. (n = 16). P value was determined by two-sided two-way ANOVA. b For investigation of PP2A inhibition and PD-1 blockade synergistically eliciting tumour rejection in a regulatory T cell-independent manner, BALB/c mice inoculated with 0.5 × 106 CT26 subcutaneously in the flank were further randomised into mice treated with vehicle or with Treg inhibitor (iTreg), PI-3065 (75 mg/kg, daily), after tumour reached between 50 and 100 mm3. Three independent experiments were done. Data of representative experiments are shown as mean ± s.e.m. (n = 16). P value was determined by two-sided two-way ANOVA. Coefficient of drug interaction (CDI) was calculated and CDI < 0.7 indicates significant synergism. c Analysis of mRNA level data in human colorectal cancer cells lines, extracted from the Cancer Cell Line Encyclopedia (CCLE), revealed higher CIP2A and SET levels and lower PPP2R1A in MSI compared to MSS (n = 33 for each gene expression). P value was determined by a two-sided unpaired t test. d Western blot analysis and e MSI status evaluation of HT29 and SW620 treated with vehicle control (CTR), 2.5 μM LB100, and 2.5 μM LB102 treatment for 2 days (D2) and 7 days (D7) or treated with different Shppp2r1a. Blots are representative of two biological independent samples for each group. The mononucleotide regions BAT-25, BAT-26, D2S123, D17S250, and D5S346 were used to evaluate microsatellite instability. Shiftings and loss of heterozygosity (LOH) comparing to control (CTR) are shown. Source data are provided as a Source data file.

References

    1. Cancer Genome Atlas Network. Comprehensive molecular characterization of human colon and rectal cancer. Nature. 2012;487:330–337. - PMC - PubMed
    1. Herman JG, et al. Incidence and functional consequences of hMLH1 promoter hypermethylation in colorectal carcinoma. Proc. Natl Acad. Sci. USA. 1998;95:6870–6875. - PMC - PubMed
    1. Veigl ML, et al. Biallelic inactivation of hMLH1 by epigenetic gene silencing, a novel mechanism causing human MSI cancers. Proc. Natl Acad. Sci. USA. 1998;95:8698–8702. - PMC - PubMed
    1. Gryfe R, et al. Tumor microsatellite instability and clinical outcome in young patients with colorectal cancer. N. Engl. J. Med. 2000;342:69–77. - PubMed
    1. Le DT, et al. Mismatch repair deficiency predicts response of solid tumors to PD-1 blockade. Science. 2017;357:409–413. - PMC - PubMed

Publication types

MeSH terms