Comparative Study
. 2021 Dec 15;12(1):7305.
doi: 10.1038/s41467-021-27542-8.

Critical Assessment of MetaProteome Investigation (CAMPI): a multi-laboratory comparison of established workflows

Affiliations
Comparative Study

Critical Assessment of MetaProteome Investigation (CAMPI): a multi-laboratory comparison of established workflows

Tim Van Den Bossche et al. Nat Commun. .

Abstract

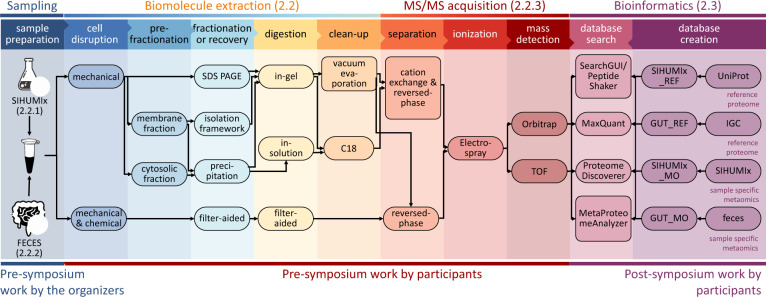
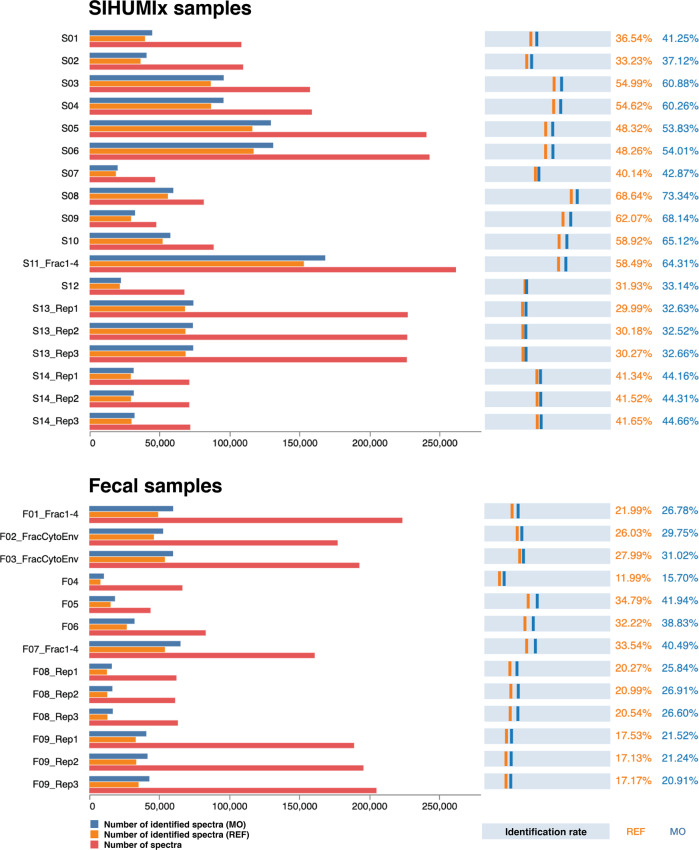
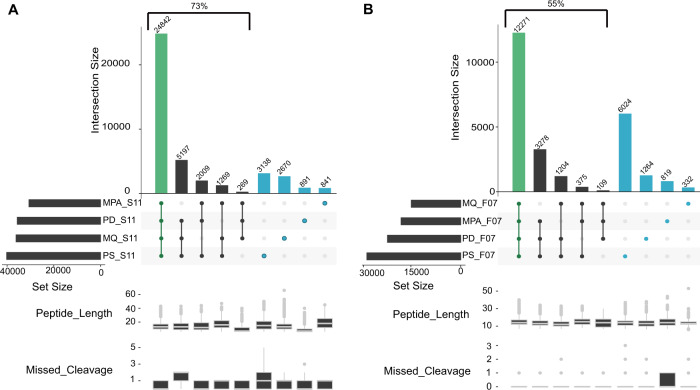
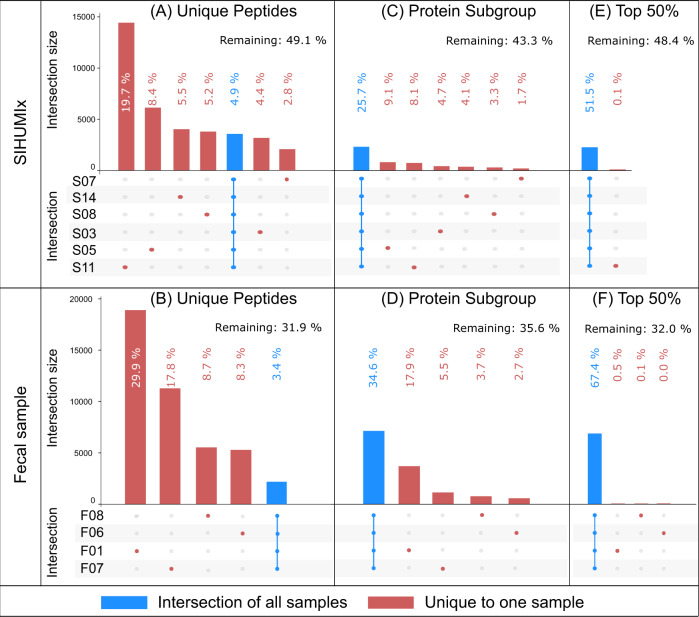
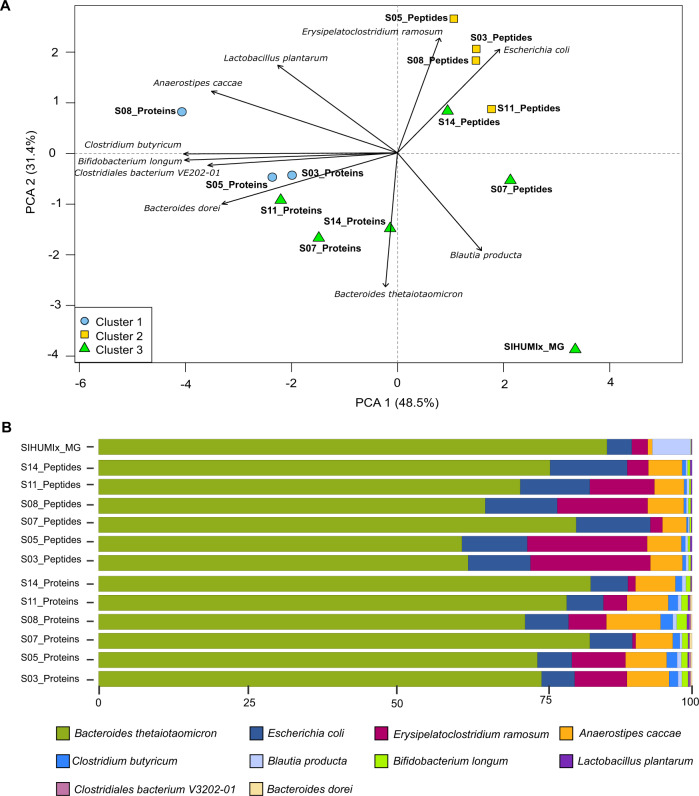
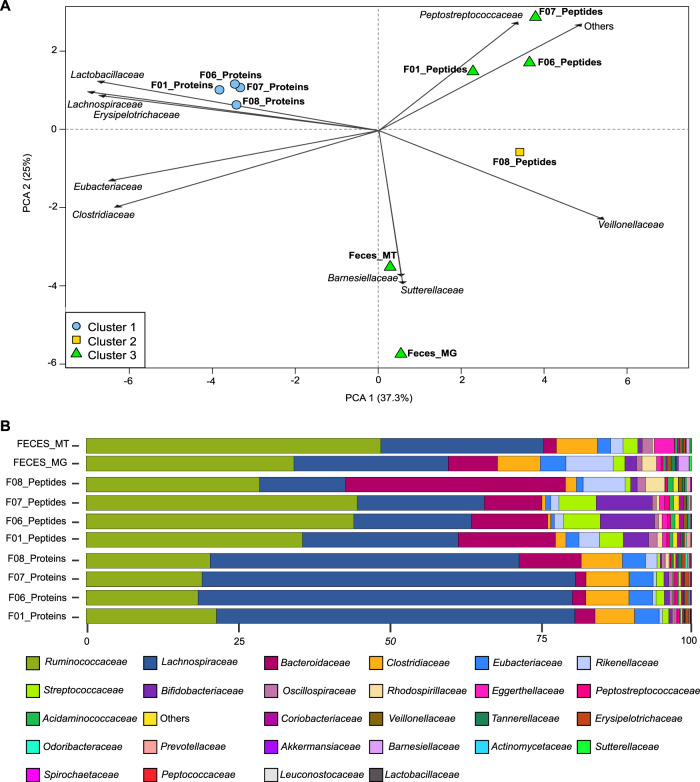
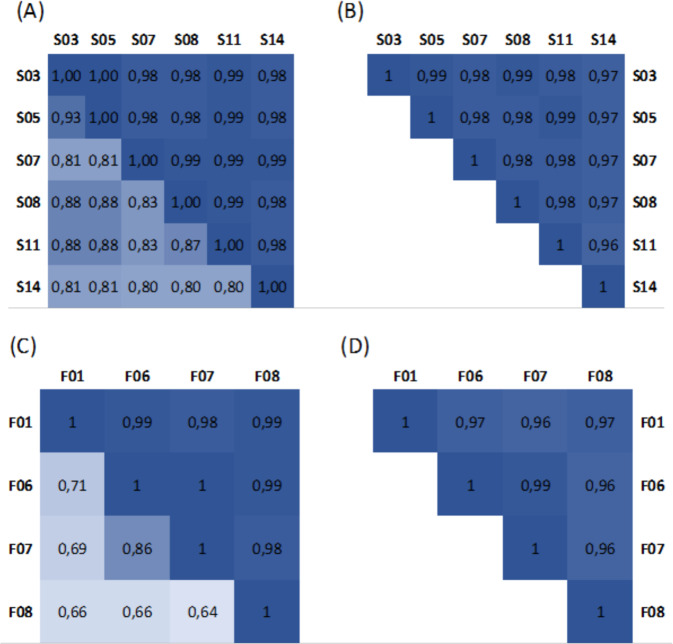
Metaproteomics has matured into a powerful tool to assess functional interactions in microbial communities. While many metaproteomic workflows are available, the impact of method choice on results remains unclear. Here, we carry out a community-driven, multi-laboratory comparison in metaproteomics: the critical assessment of metaproteome investigation study (CAMPI). Based on well-established workflows, we evaluate the effect of sample preparation, mass spectrometry, and bioinformatic analysis using two samples: a simplified, laboratory-assembled human intestinal model and a human fecal sample. We observe that variability at the peptide level is predominantly due to sample processing workflows, with a smaller contribution of bioinformatic pipelines. These peptide-level differences largely disappear at the protein group level. While differences are observed for predicted community composition, similar functional profiles are obtained across workflows. CAMPI demonstrates the robustness of present-day metaproteomics research, serves as a template for multi-laboratory studies in metaproteomics, and provides publicly available data sets for benchmarking future developments.


Conflict of interest statement

The authors declare no competing interests.

Figures

Fig. 1
Fig. 1. Schematic representation of the main sample preparation steps and follow-up analyses of the CAMPI study.
The figure consists of three parts: (i) Pre-symposium work by the organizers (left panel). The two samples (SIHUMIx and fecal sample) were, prior to the symposium, aliquoted and distributed over the participating laboratories. (ii) Pre-symposium work by participants (middle panels). Every used method by the participants, going from cell disruption to mass detection, is displayed. (iii) Post-symposium work by participants (right panel). The bioinformatics analyses, i.e., database creation and database search for peptide and protein identification, were harmonized to make the results between all participating laboratories comparable. The stock icons in the leftmost column were obtained from vecteezy.com, flaticon.com, and labicons.net.
Fig. 2
Fig. 2. Comparison of identification rates across all CAMPI workflows.
On the left side, the bar charts show the number of identified spectra using the reference (REF) database (orange), the number of identified spectra using the multi-omic (MO) database (dark blue) and total amount of measured spectra (red). On the right side, the light blue bars represent the identification rate calculated as the percentage of spectra that yielded a peptide identification at 1% FDR for both the REF database (orange) and the MO database (dark blue). The specific protocols can be found in Supplementary Data 1. For database searching, X!Tandem was used as a single search engine. Source data is provided in Supplementary Data 2.
Fig. 3
Fig. 3. UpSet plot comparison of identified sets of peptides using different bioinformatic pipelines.
The left panel displays the results for the SIHUMIx sample S11 (A), while the right panel corresponds to the results for the fecal sample F07 (B). The four different bioinformatic pipelines (MetaProteomeAnalyzer (MPA, using X!Tandem and OMSSA), Proteome Discoverer (PD, using SequestHT), MaxQuant (MQ, using Andromeda), SearchGUI/PeptideShaker (PS, using X!Tandem, OMSSA, MS-GF+, and Comet)) are indicated on the x-axis and sorted by increasing set size. Set size corresponds to the total number of peptides identified per tool, and intersection size corresponds to the number of shared peptides identified in different approaches. Green highlights the intersection, and blue shows unique peptides to each tool. The lower panel box plots show peptide lengths, and number of missed cleavages for each intersection. Source data is provided as a Source Data file.
Fig. 4
Fig. 4. UpSet plot comparison of sets of identified peptides, protein subgroups, and 50% most abundant protein subgroups.
A, B Identified peptides, C, D all identified protein subgroups, and E, F top 50% subgroups (SIHUMIx and fecal sample, respectively). Top 50% protein subgroups were selected in terms of spectral count per subgroup. The figure is based on the identifications obtained using SearchGUI/PeptideShaker. The intersection size displays the number of features shared in an intersection. An intersection corresponds to features shared across multiple samples. This figure only displays features unique to a sample (red dot), and shared across all samples (blue bar overlapping all points). Source data is provided as a Source Data file.
Fig. 5
Fig. 5. Comparisons of community composition for SIHUMIx at the species level.
The upper panel shows PCA clustering of the results (A). Different approaches and tools used for taxonomic annotation (MG - mOTU2, Peptides - Unipept, and Proteins - Prophane) are indicated in the label. Clusters (k = 3) were calculated using manhattan distance and are represented by blue, yellow, and green. Features not annotated at species level were considered unclassified and discarded for PCA calculation. Unclassified features accounted for 24.2% and 69.9% of data for peptide and protein subgroup levels. Variables driving differences between samples are represented by black arrows. The lower panel details taxonomic profiles of each sample as bar plots (B). Source data is provided as a Source Data file.
Fig. 6
Fig. 6. Comparisons of community composition for fecal data sets.
The upper panel shows PCA clustering of the results (A). Different approaches and tools used for taxonomic annotation (MG - mOTU2, Peptides - Unipept, and Proteins - Prophane) are indicated in the label. Clusters (k = 3) were calculated using manhattan distance and are represented by blue, yellow, and green. Features not annotated at species level were considered unclassified and discarded for PCA calculation. Unclassified features accounted for 73.4% and 9.5% of data for peptide and protein subgroup levels. The top 10 variables driving differences between samples are represented by black arrows. The lower panel details taxonomic profiles of each sample as bar plots (B). Source data is provided as a Source Data file.
Fig. 7
Fig. 7. Functional similarity between SIHUMIx samples and fecal samples.
The correlation matrices at the left show the Pearson correlation (upper triangle) and Spearman correlation (bottom triangle) for the (A) SIHUMIx data sets and (C) fecal data sets, calculated using the Pfam annotations returned by the protein-centric Prophane analysis. The correlation matrices at the right show the MegaGO similarity for the GO domain “biological process” for the (B) SIHUMIx data sets and (D) fecal data sets, calculated based on the GO terms returned by peptide-centric Unipept analyses. Source data is provided as a Source Data file.

References

    1. Jansson JK, Baker ES. A multi-omic future for microbiome studies. Nat. Microbiol. 2016;1:16049. - PubMed
    1. Kleiner, M. Metaproteomics: much more than measuring gene expression in microbial communities. mSystems4, 200115–19 (2019). - PMC - PubMed
    1. Hettich RL, Pan C, Chourey K, Giannone RJ. Metaproteomics: harnessing the power of high performance mass spectrometry to identify the suite of proteins that control metabolic activities in microbial communities. Anal. Chem. 2013;85:4203–4214. - PMC - PubMed
    1. Rodriguez-Valera F. Environmental genomics, the big picture? FEMS Microbiol. Lett. 2004;231:153–158. - PubMed
    1. Wilmes P, Bond PL. The application of two-dimensional polyacrylamide gel electrophoresis and downstream analyses to a mixed community of prokaryotic microorganisms. Environ. Microbiol. 2004;6:911–920. - PubMed

Publication types