. 2022 Jan;601(7893):397-403.
doi: 10.1038/s41586-021-04230-7. Epub 2021 Dec 15.

Individual human cortical progenitors can produce excitatory and inhibitory neurons

Affiliations

Individual human cortical progenitors can produce excitatory and inhibitory neurons

Ryan N Delgado et al. Nature. 2022 Jan.

Abstract

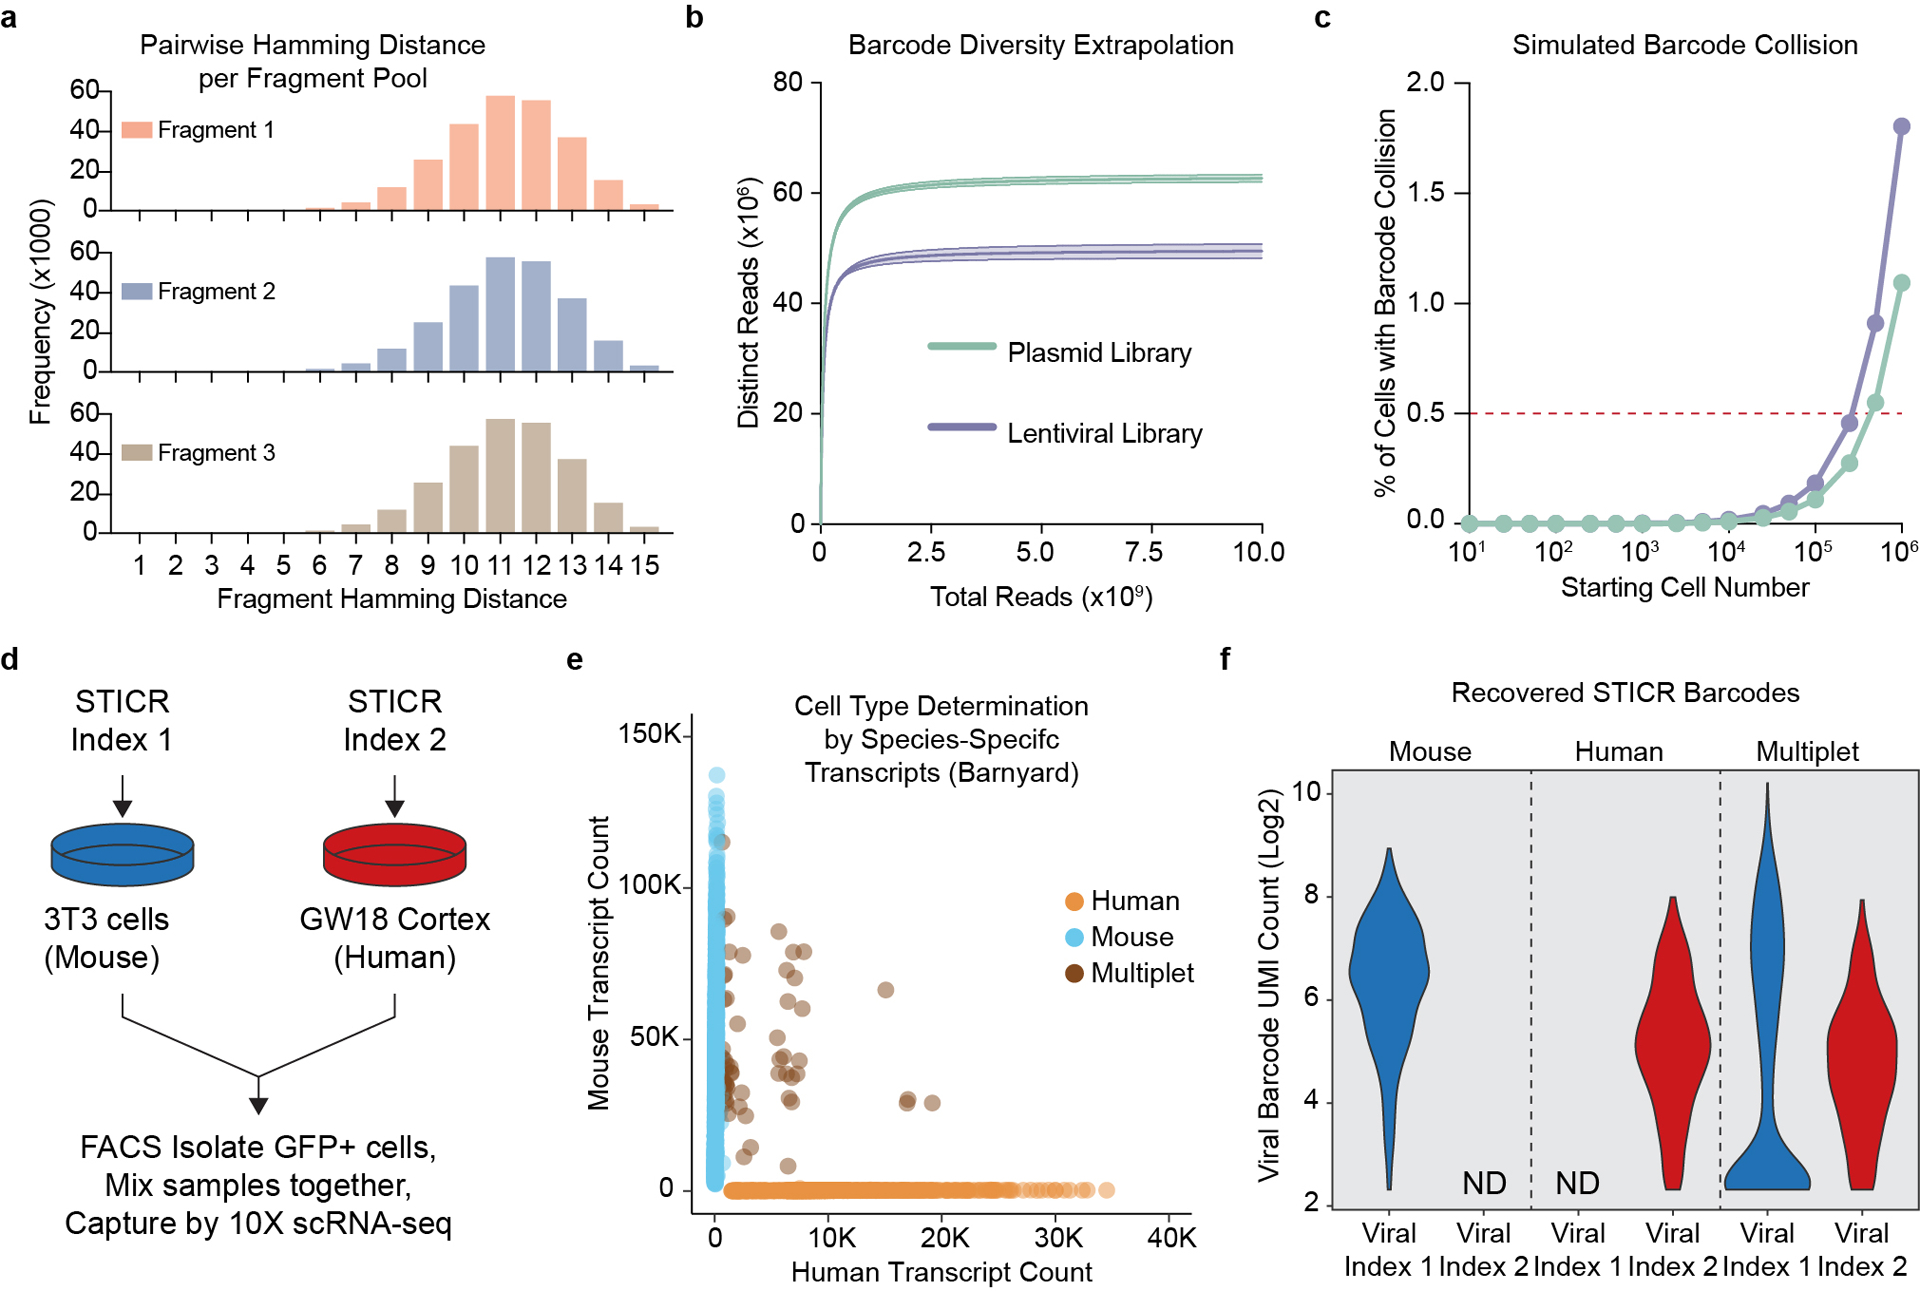
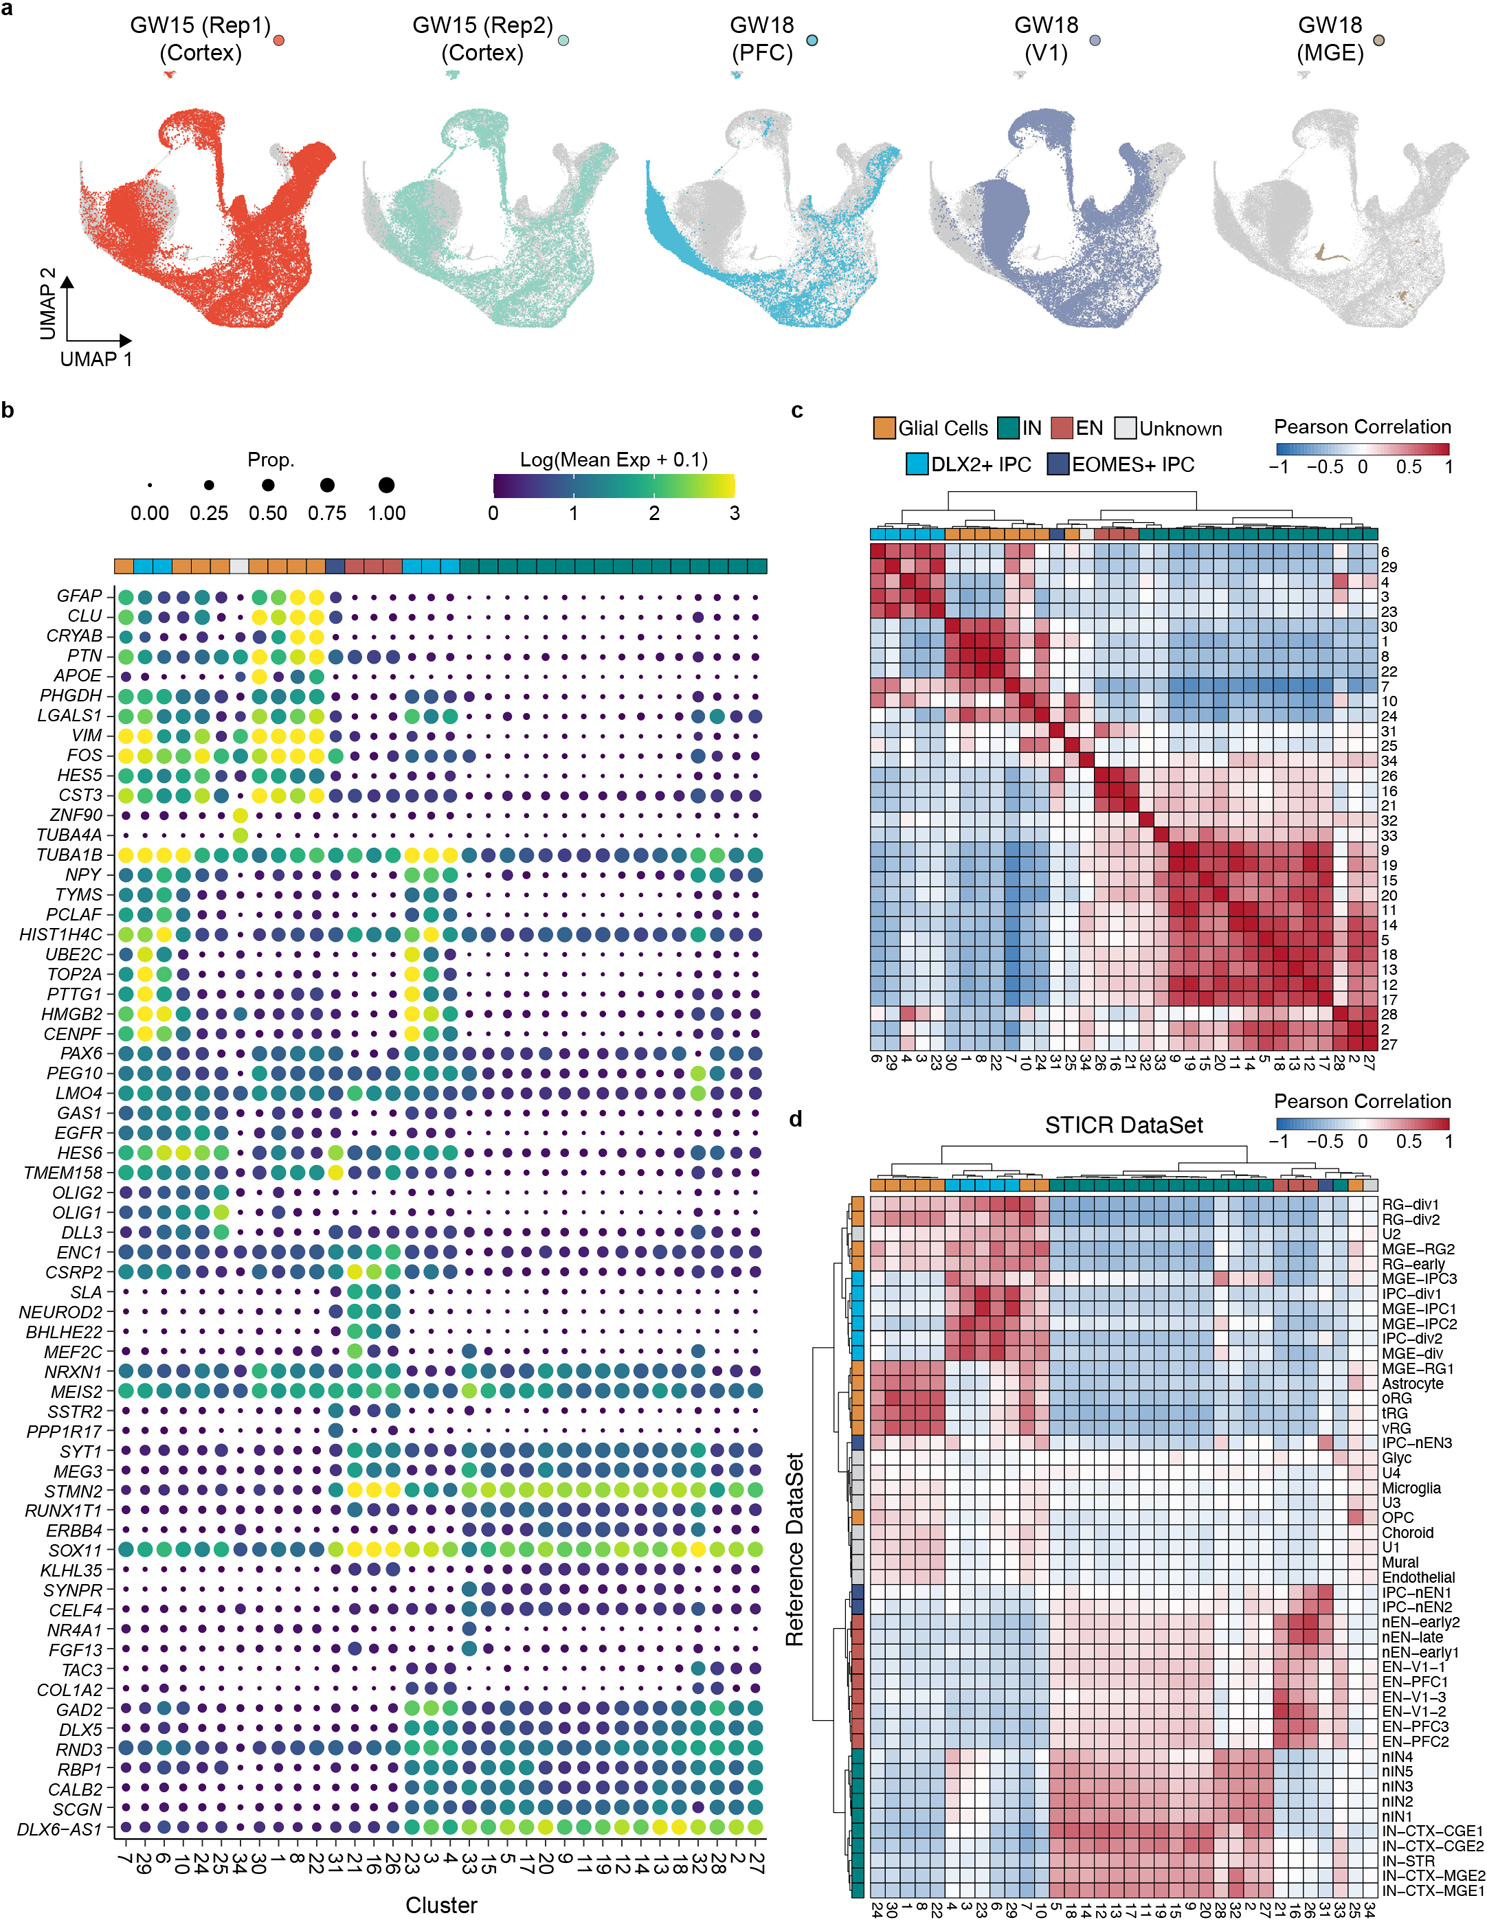
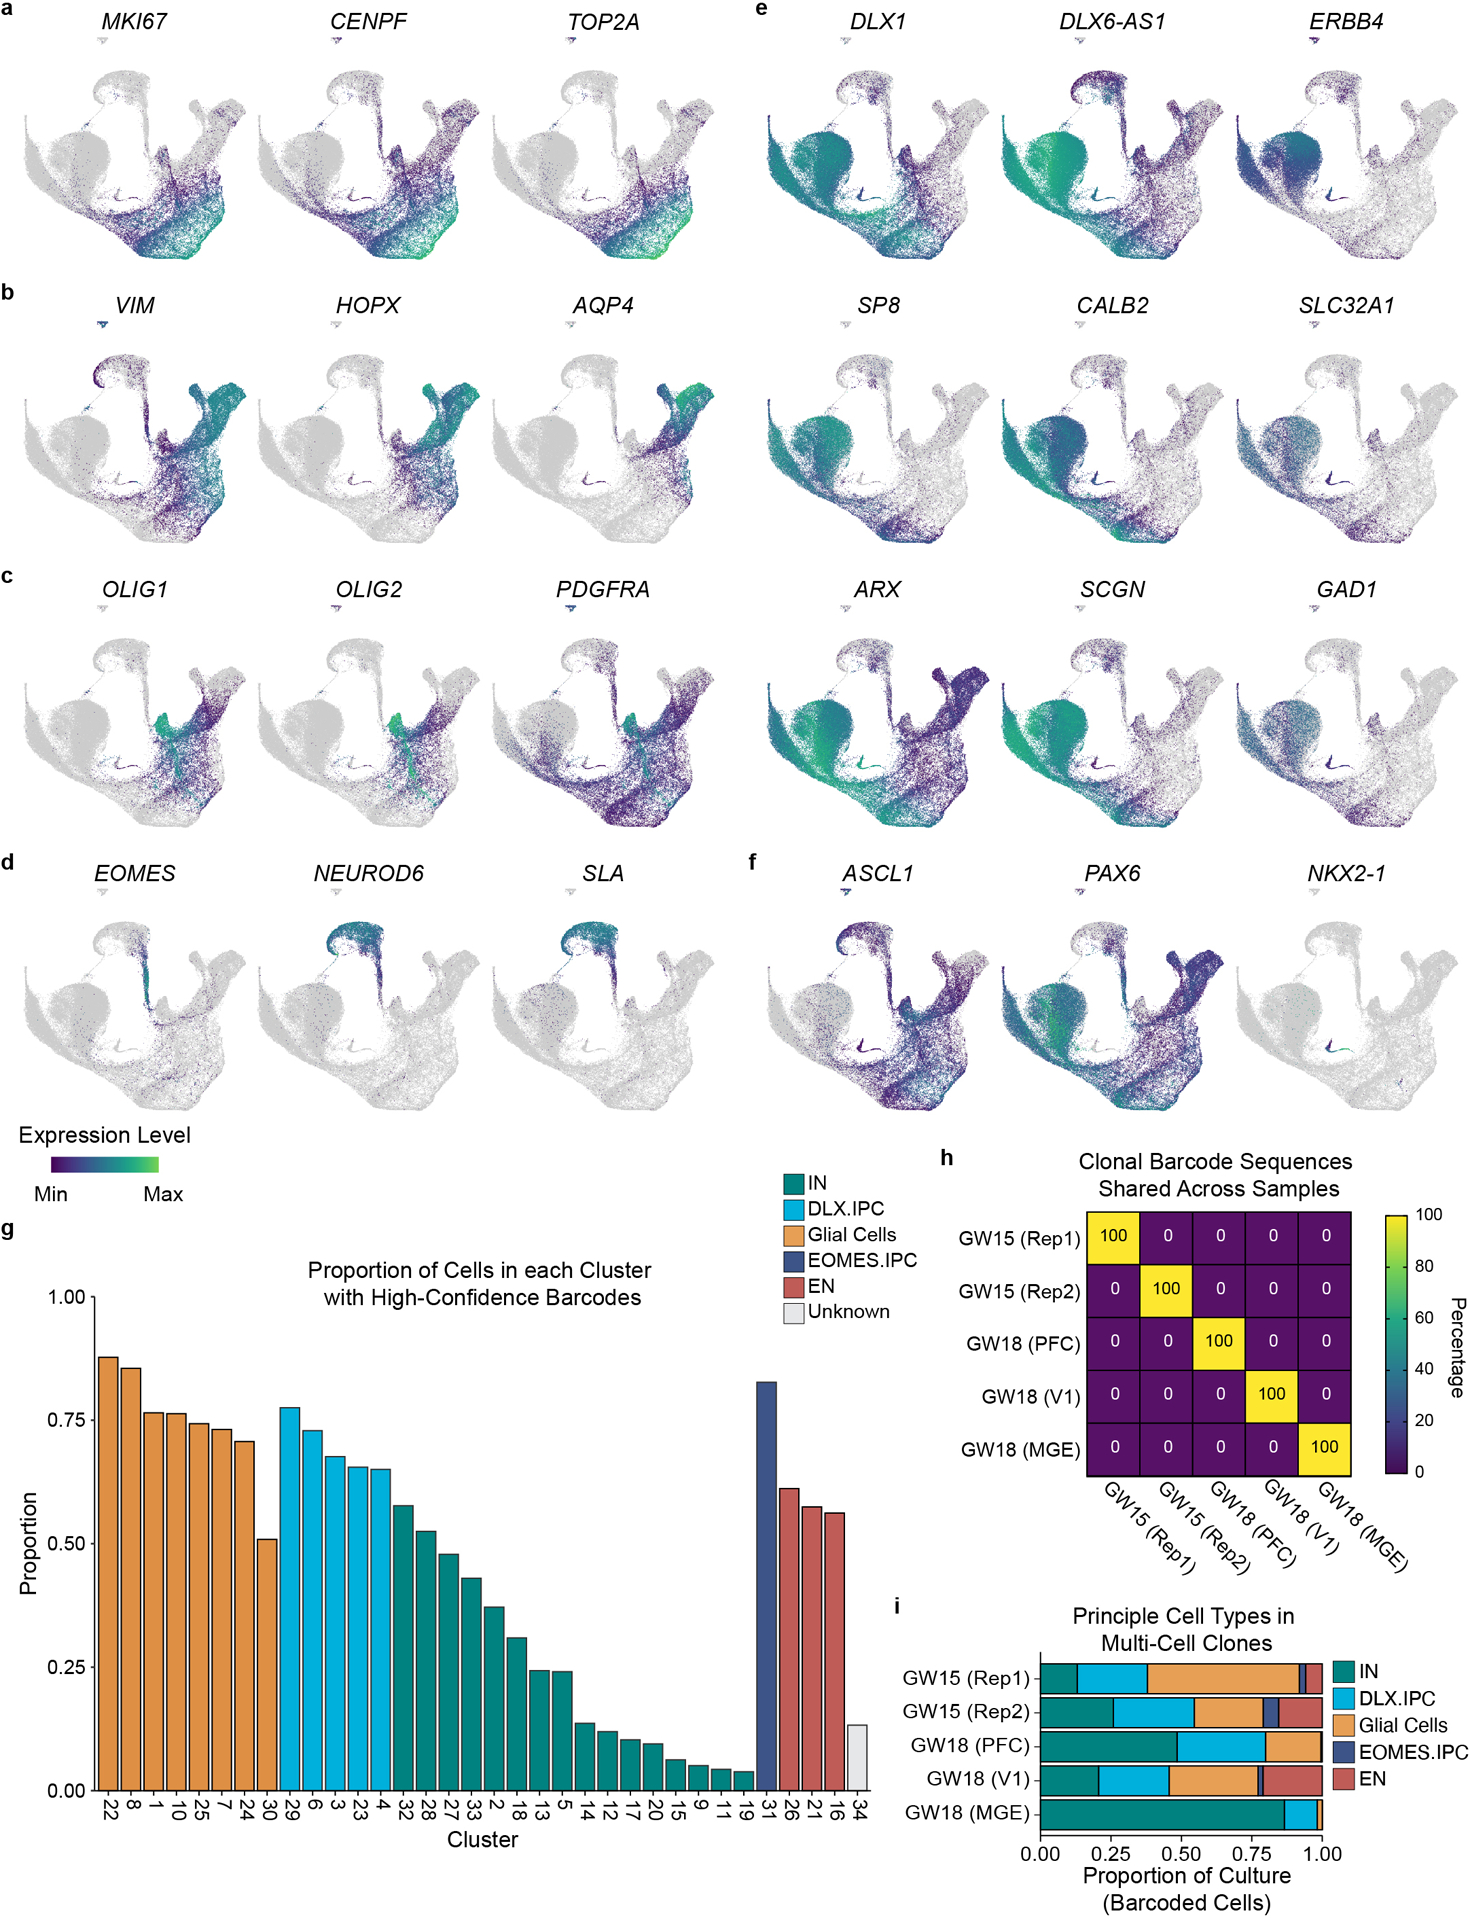
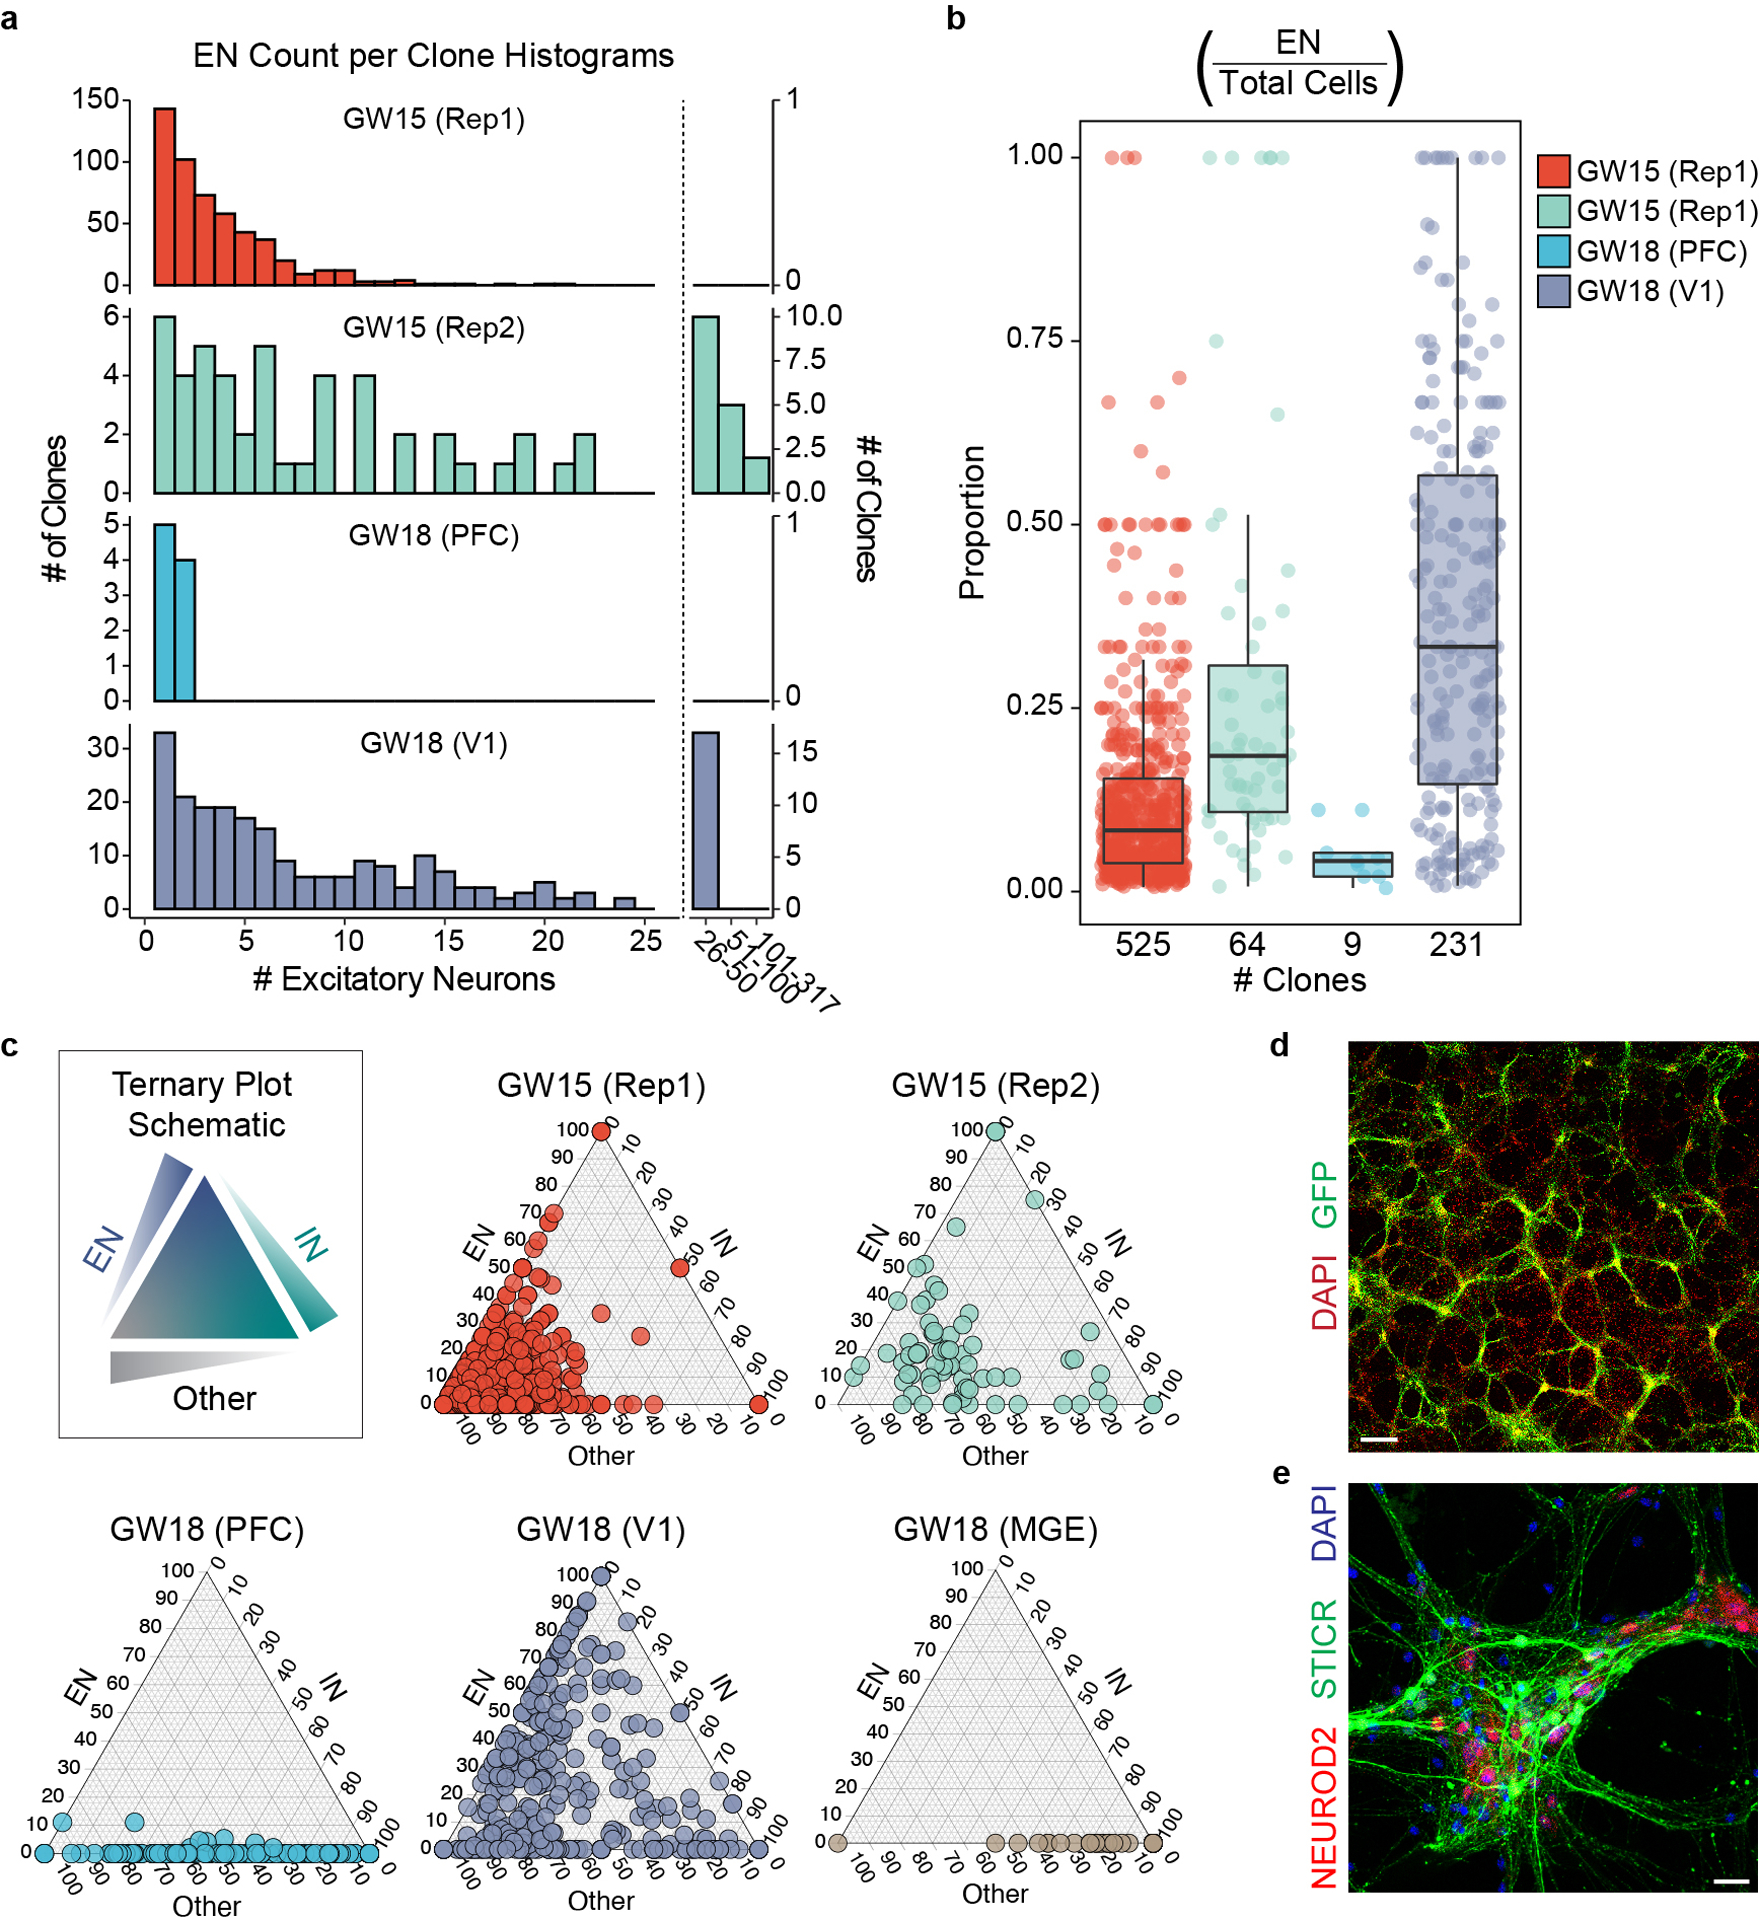
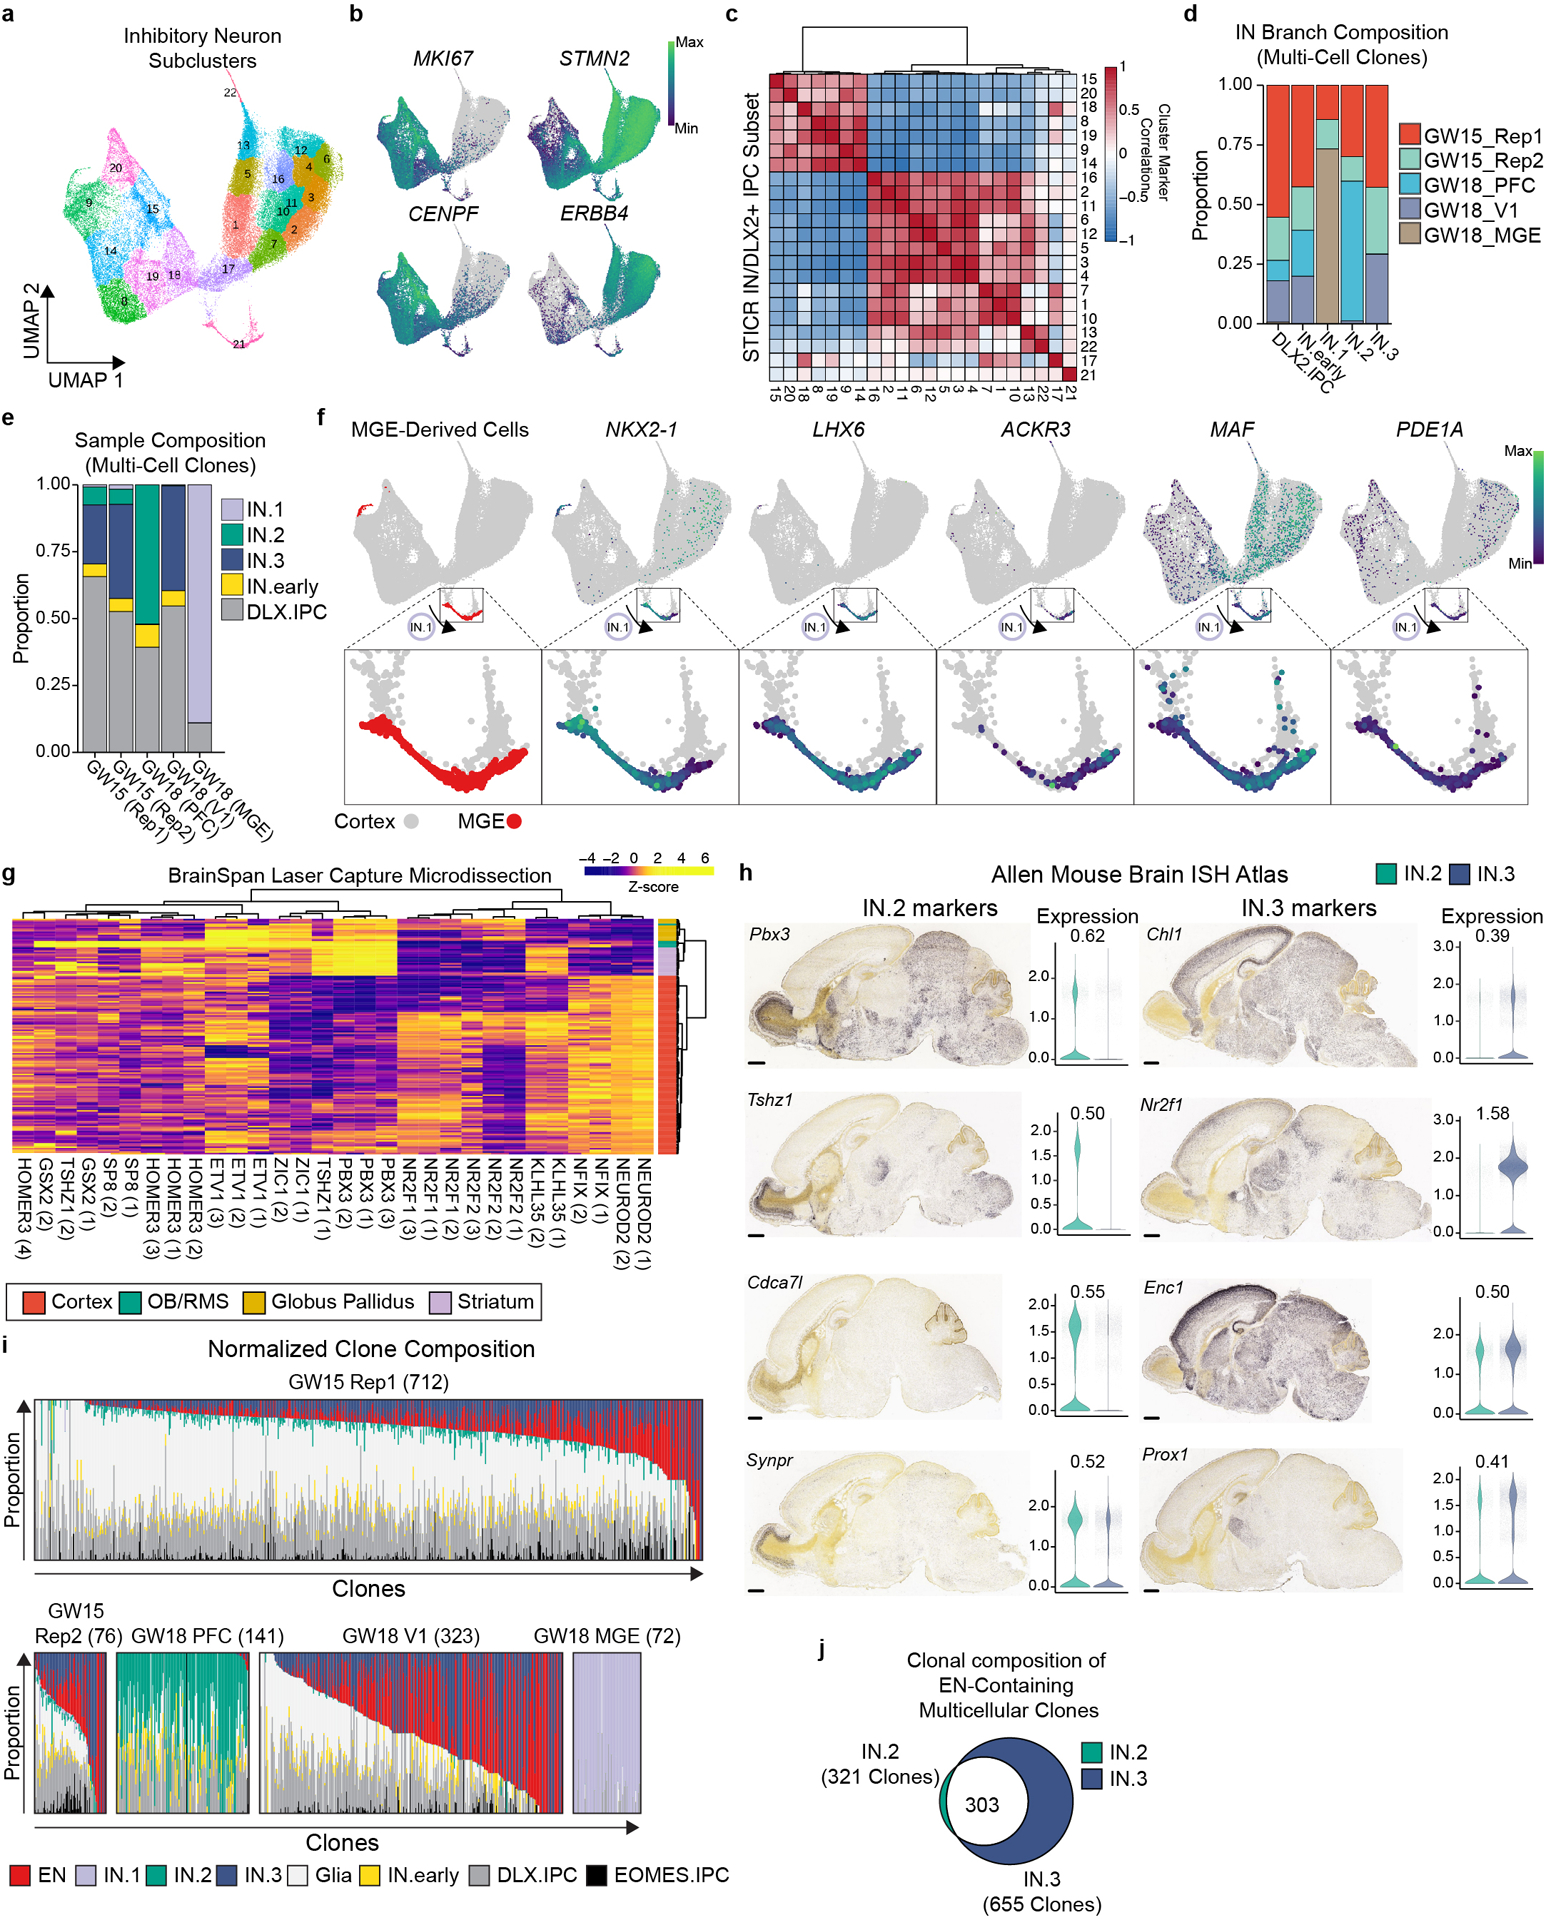
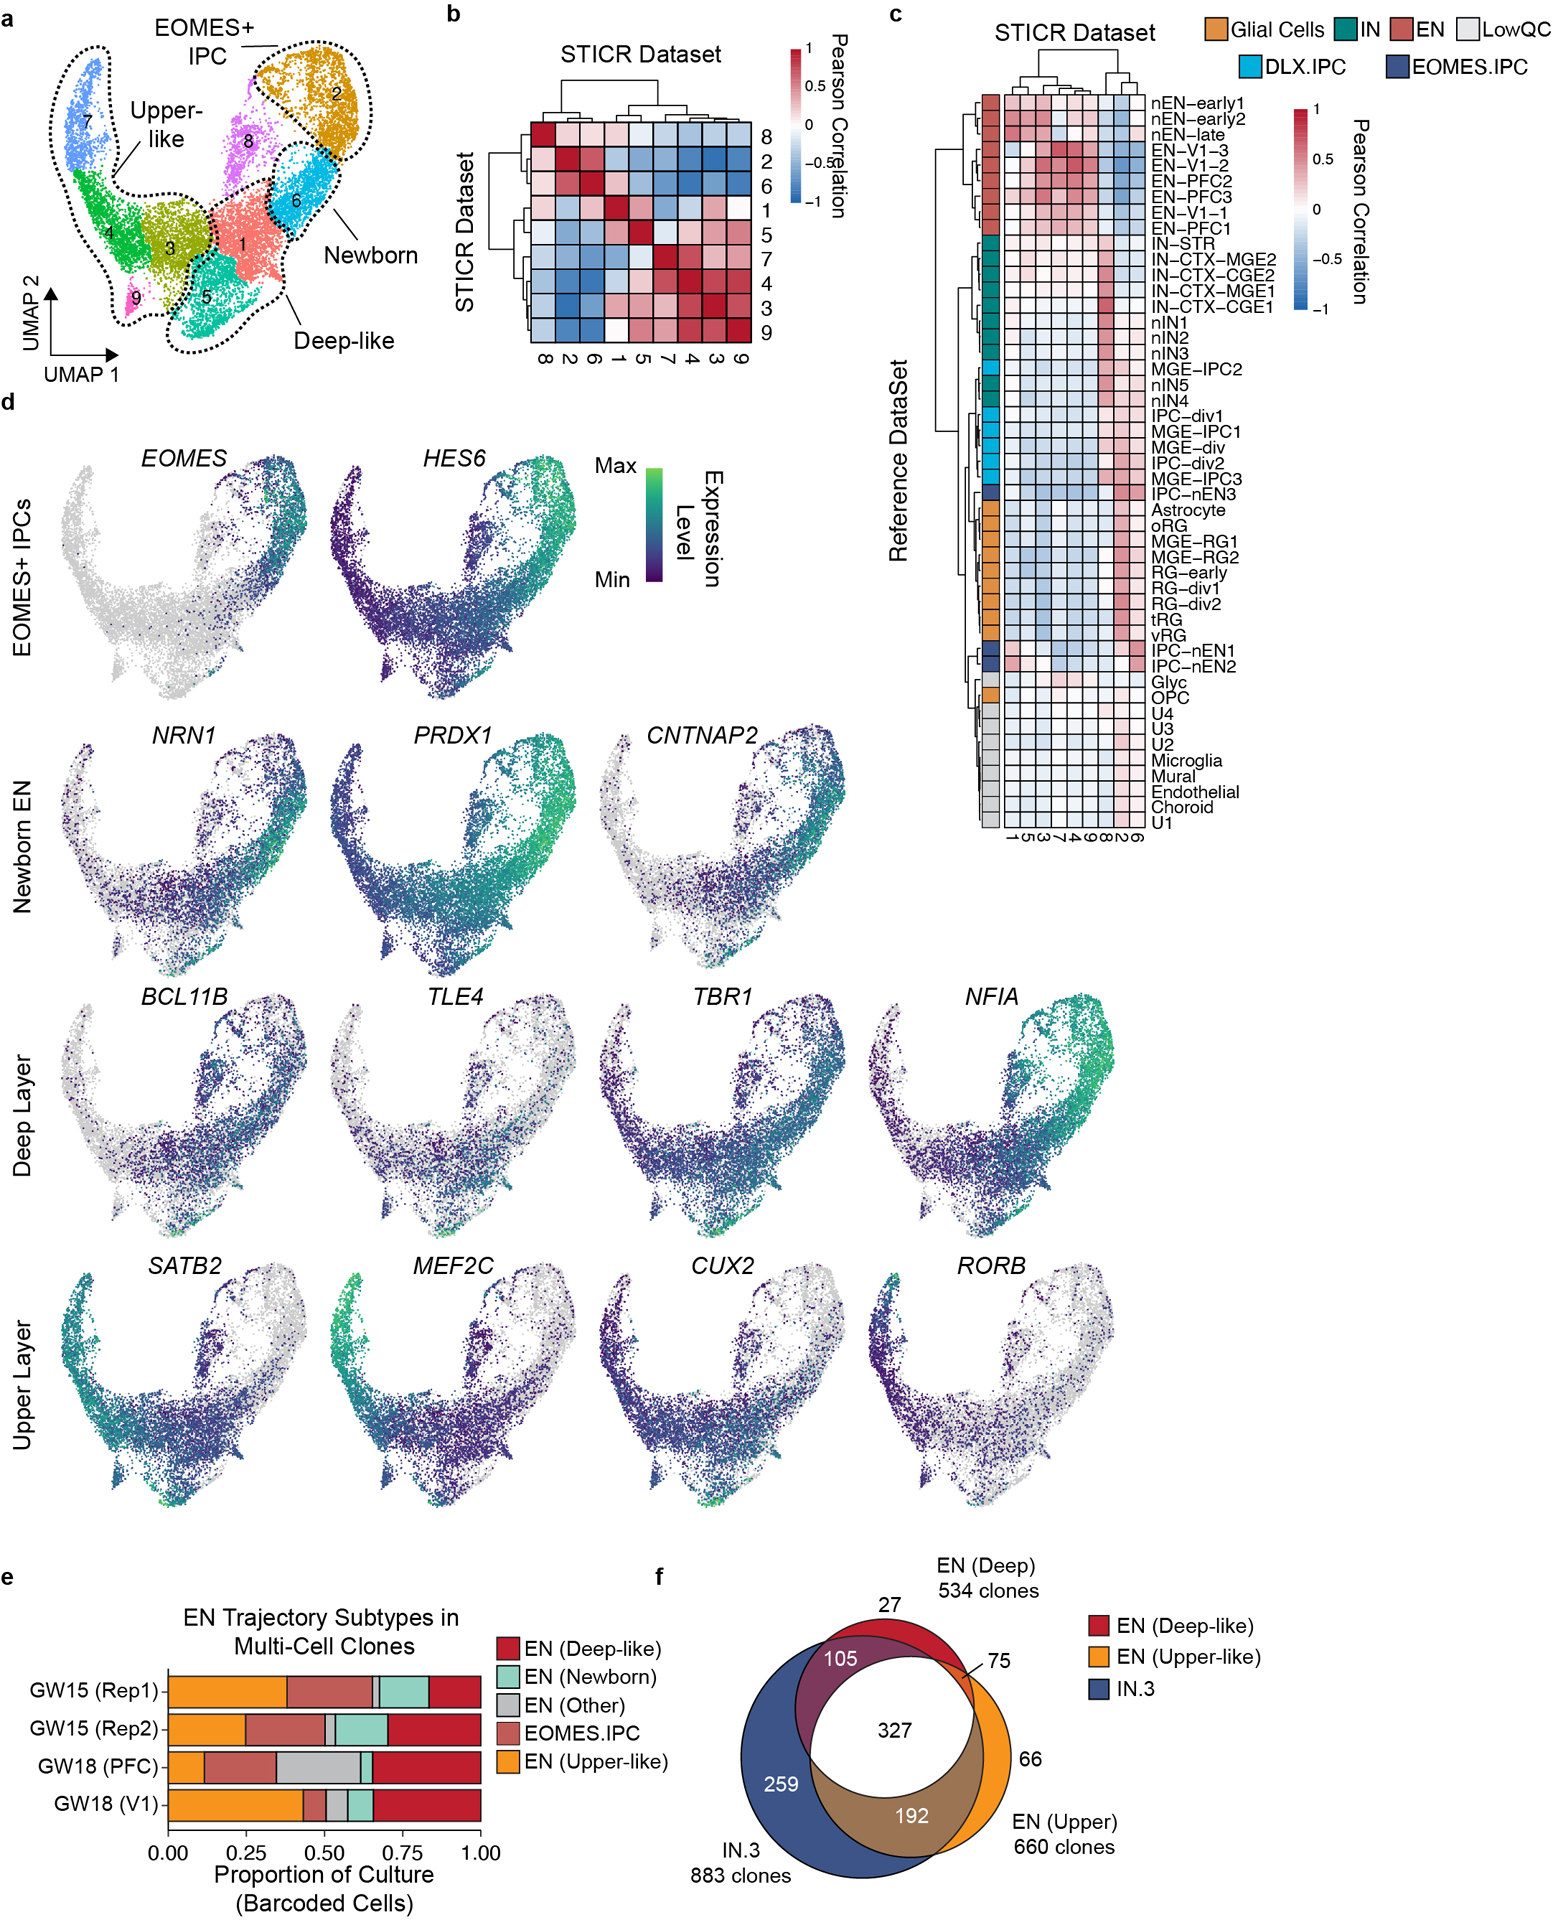
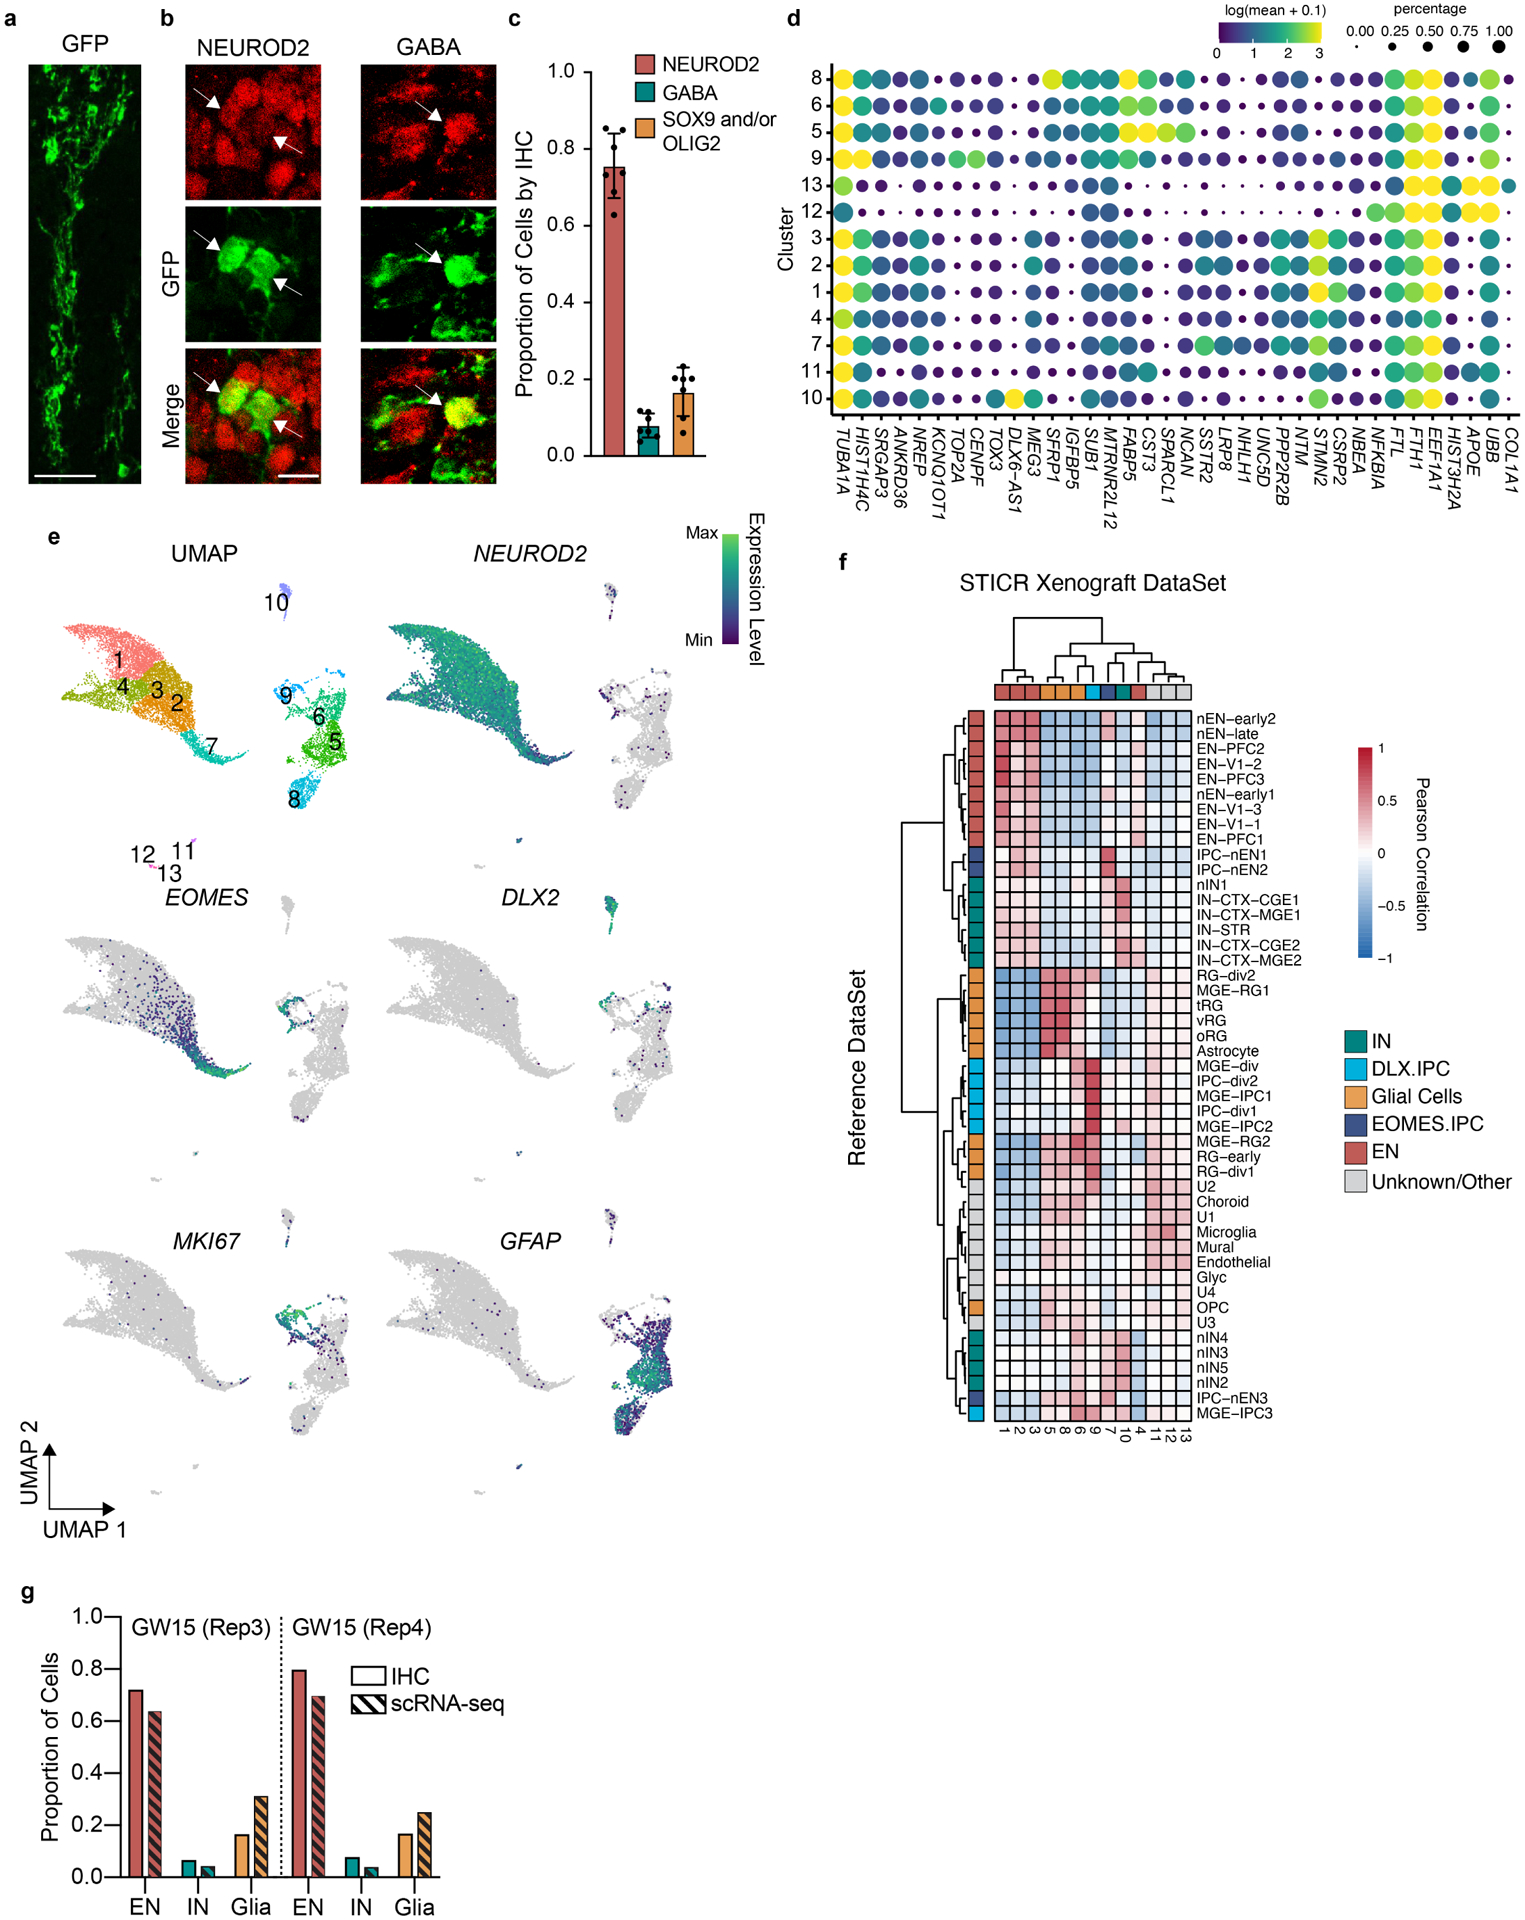
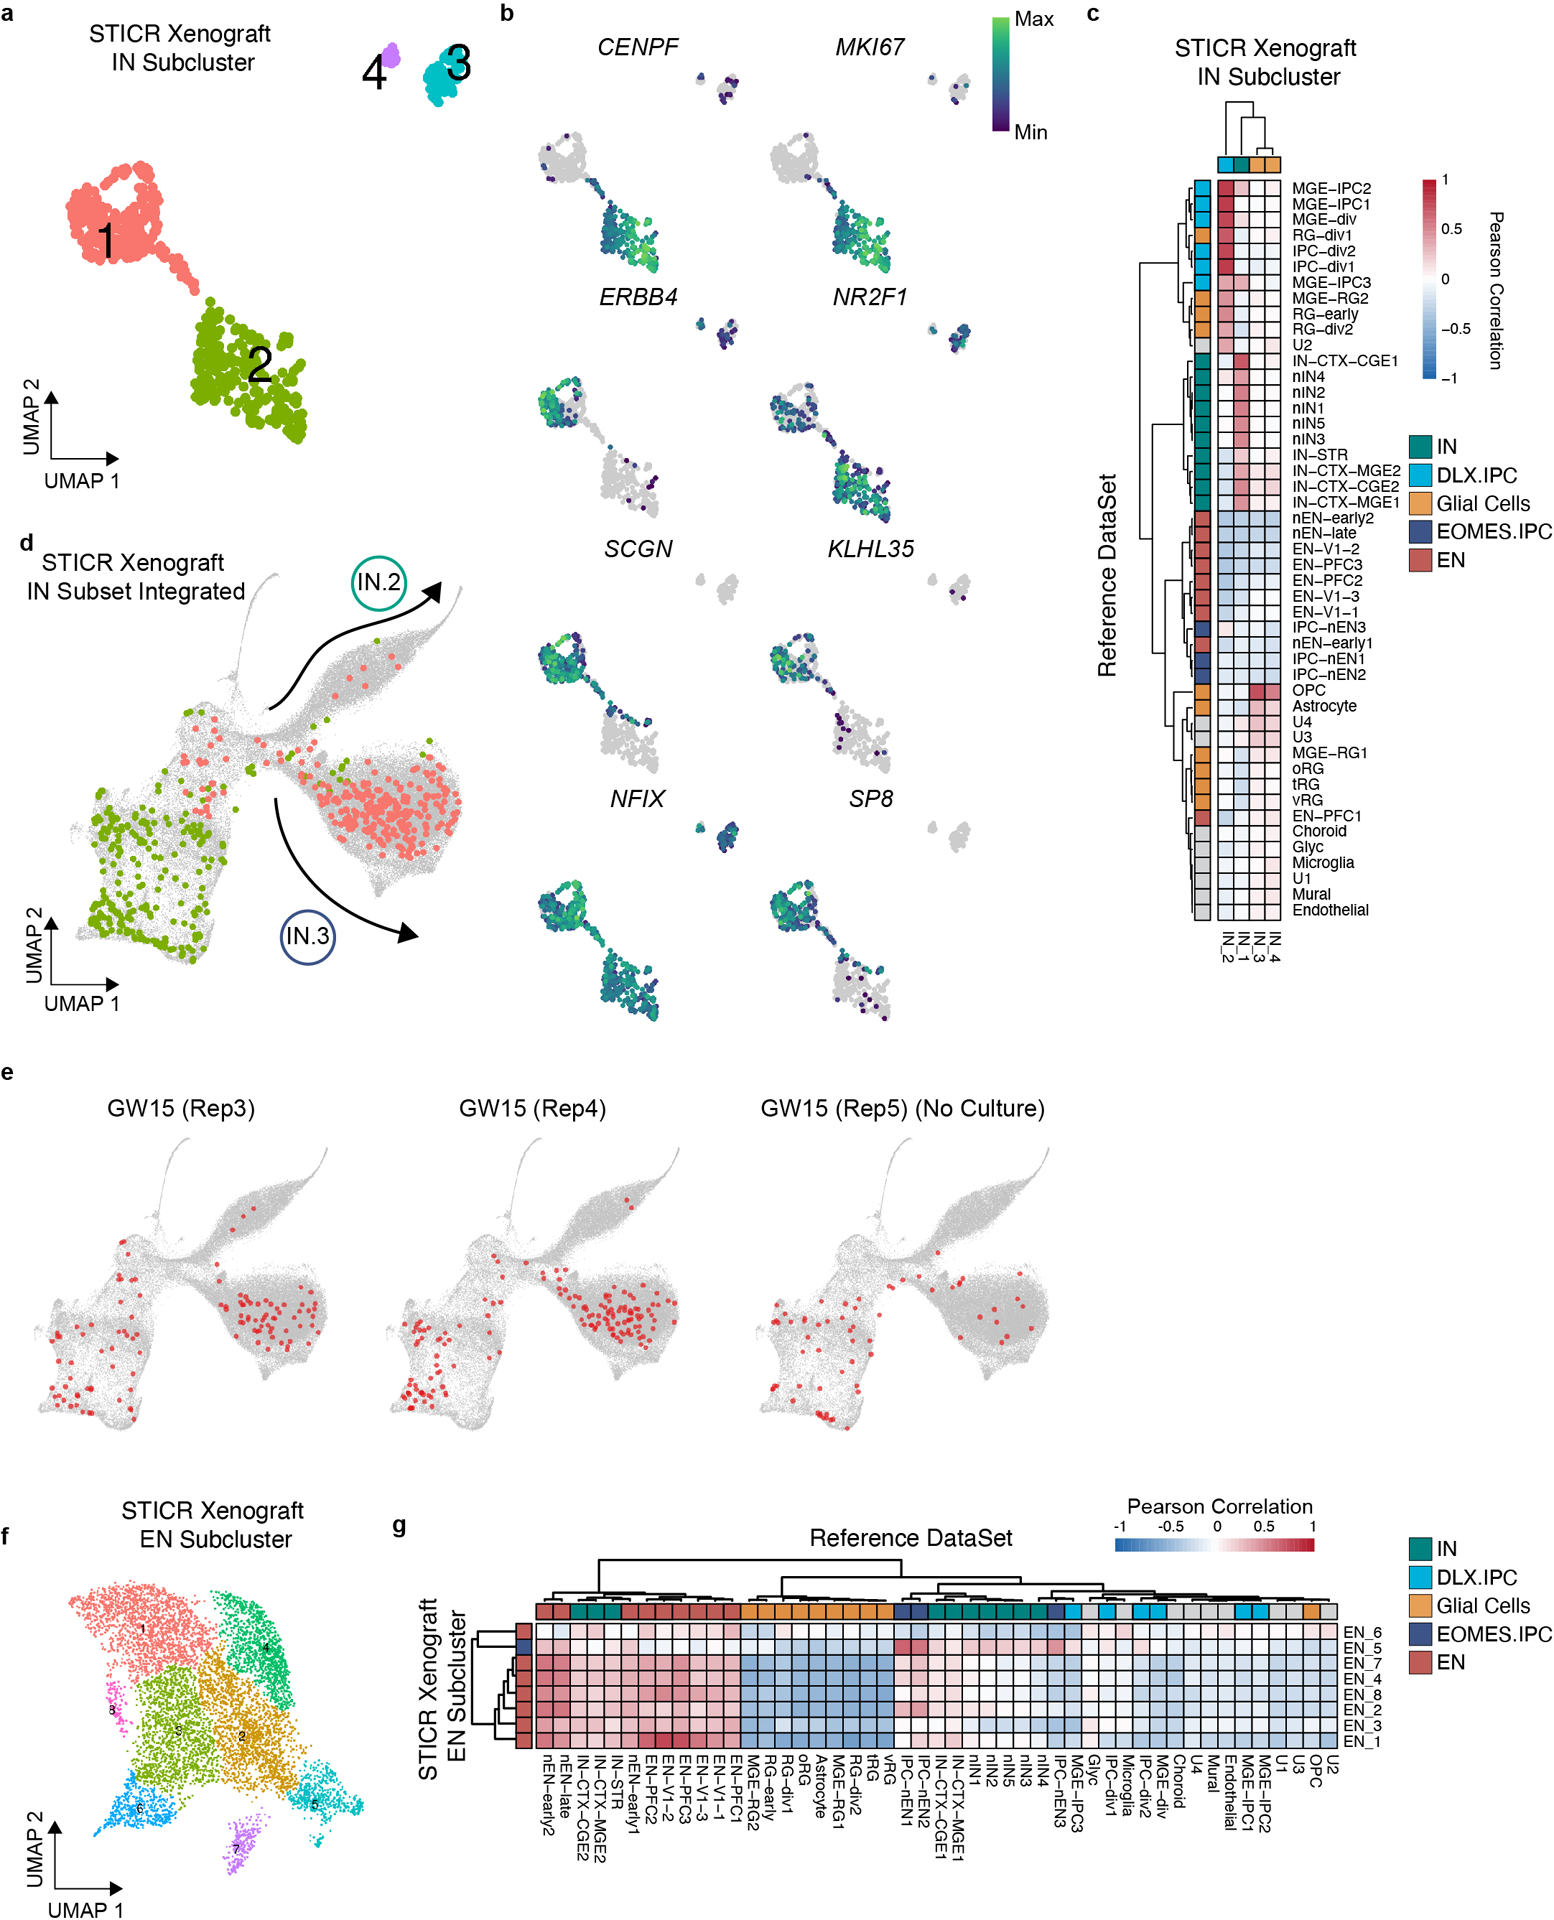
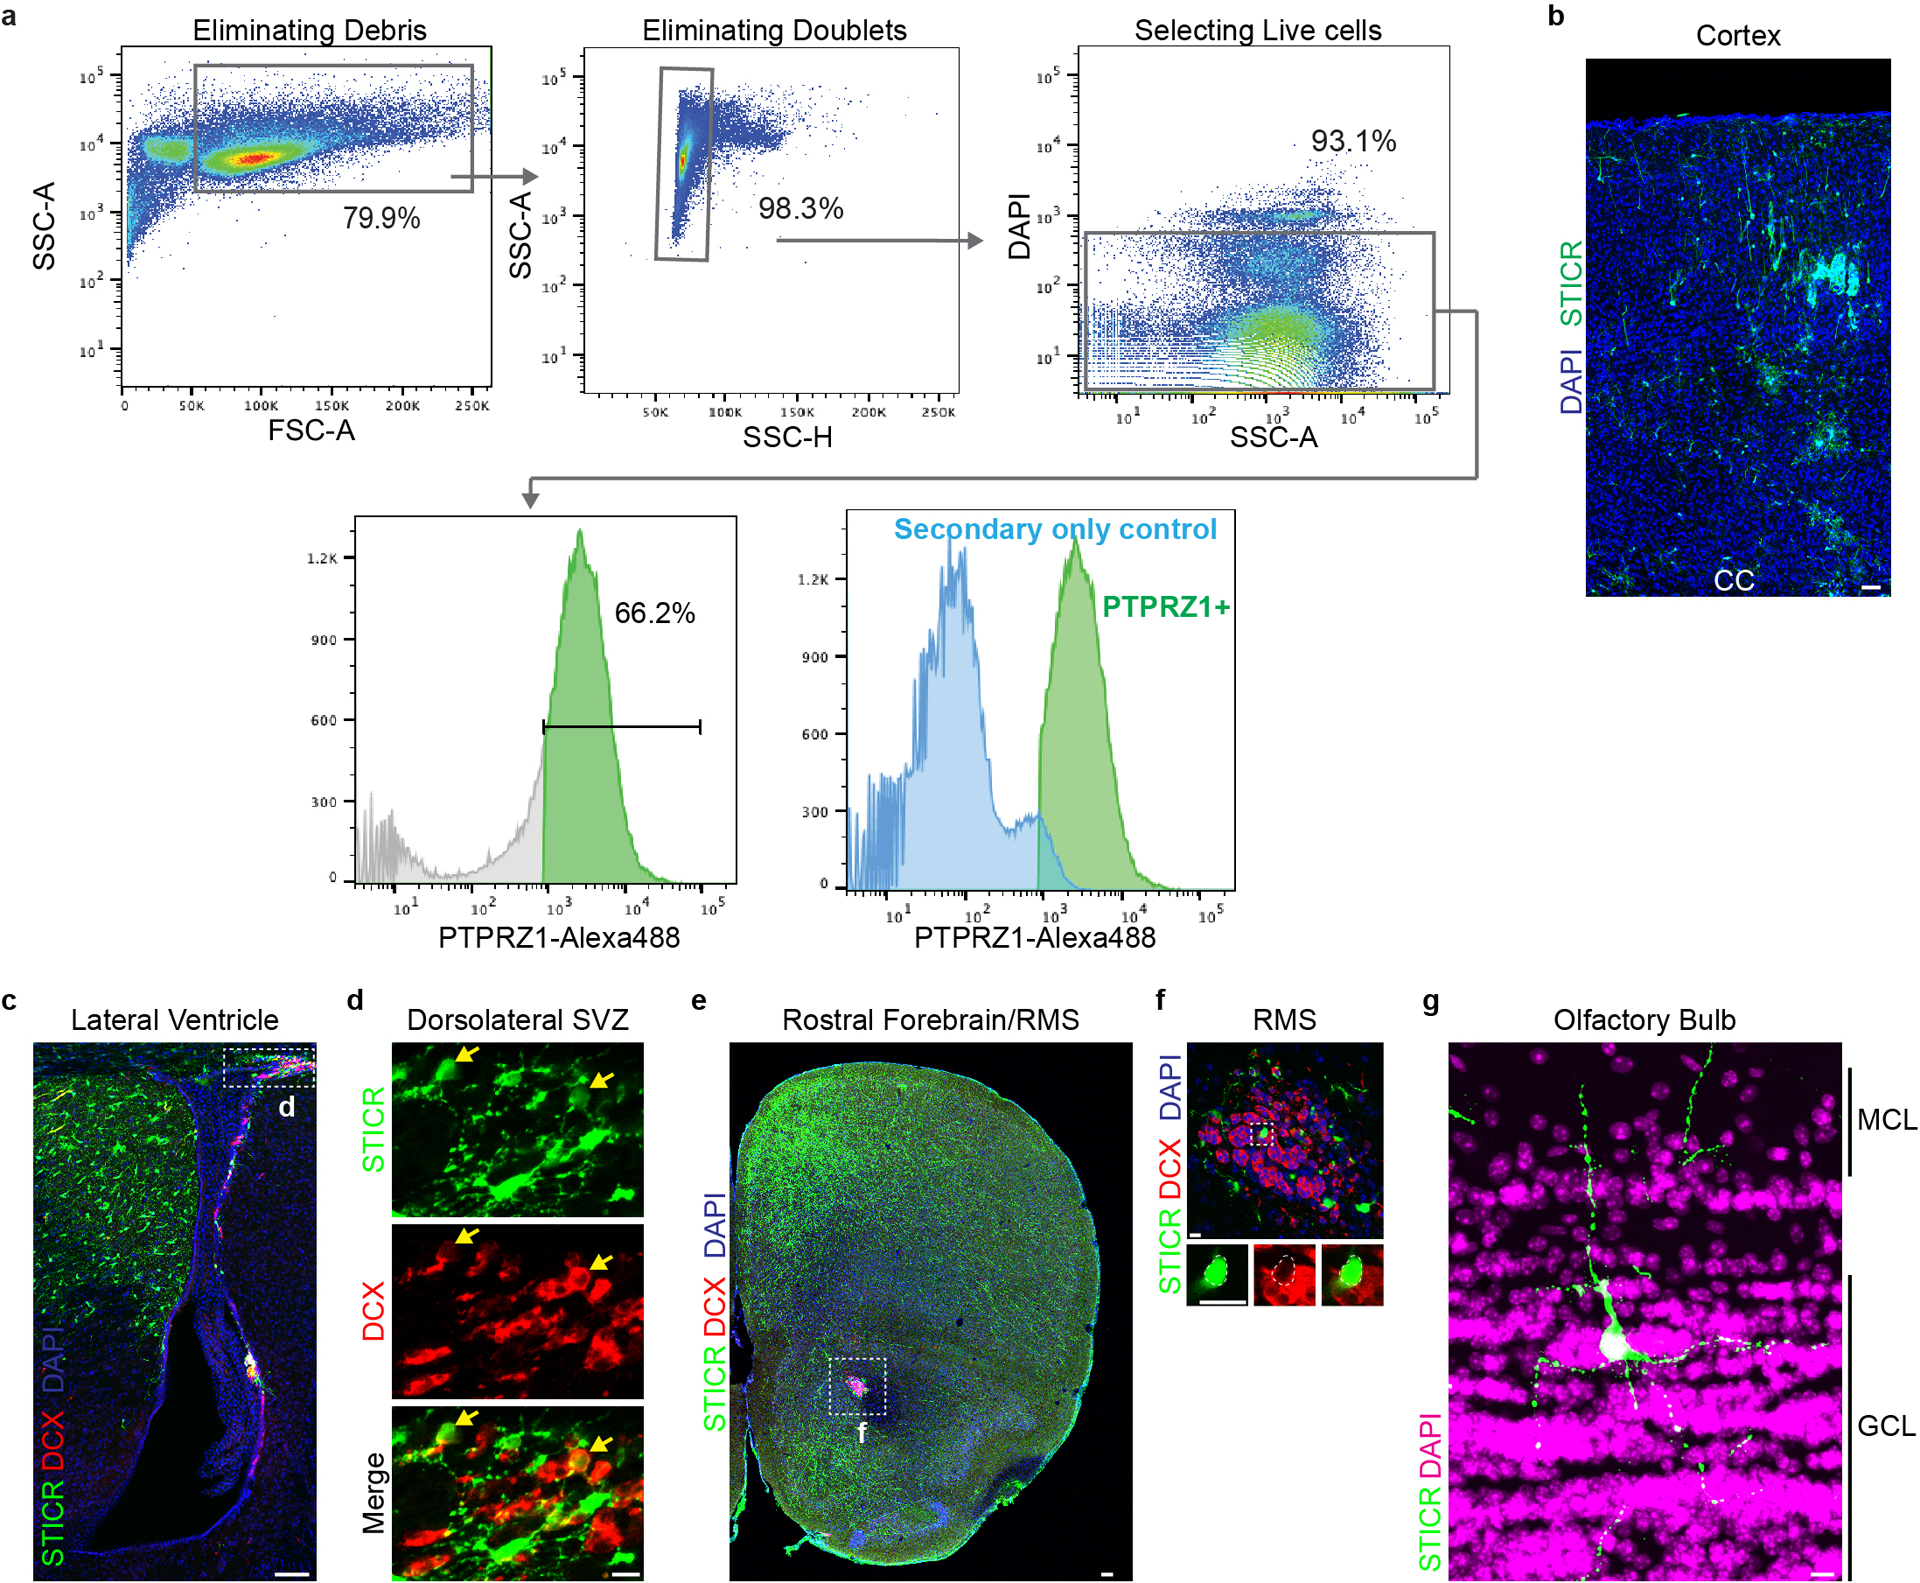
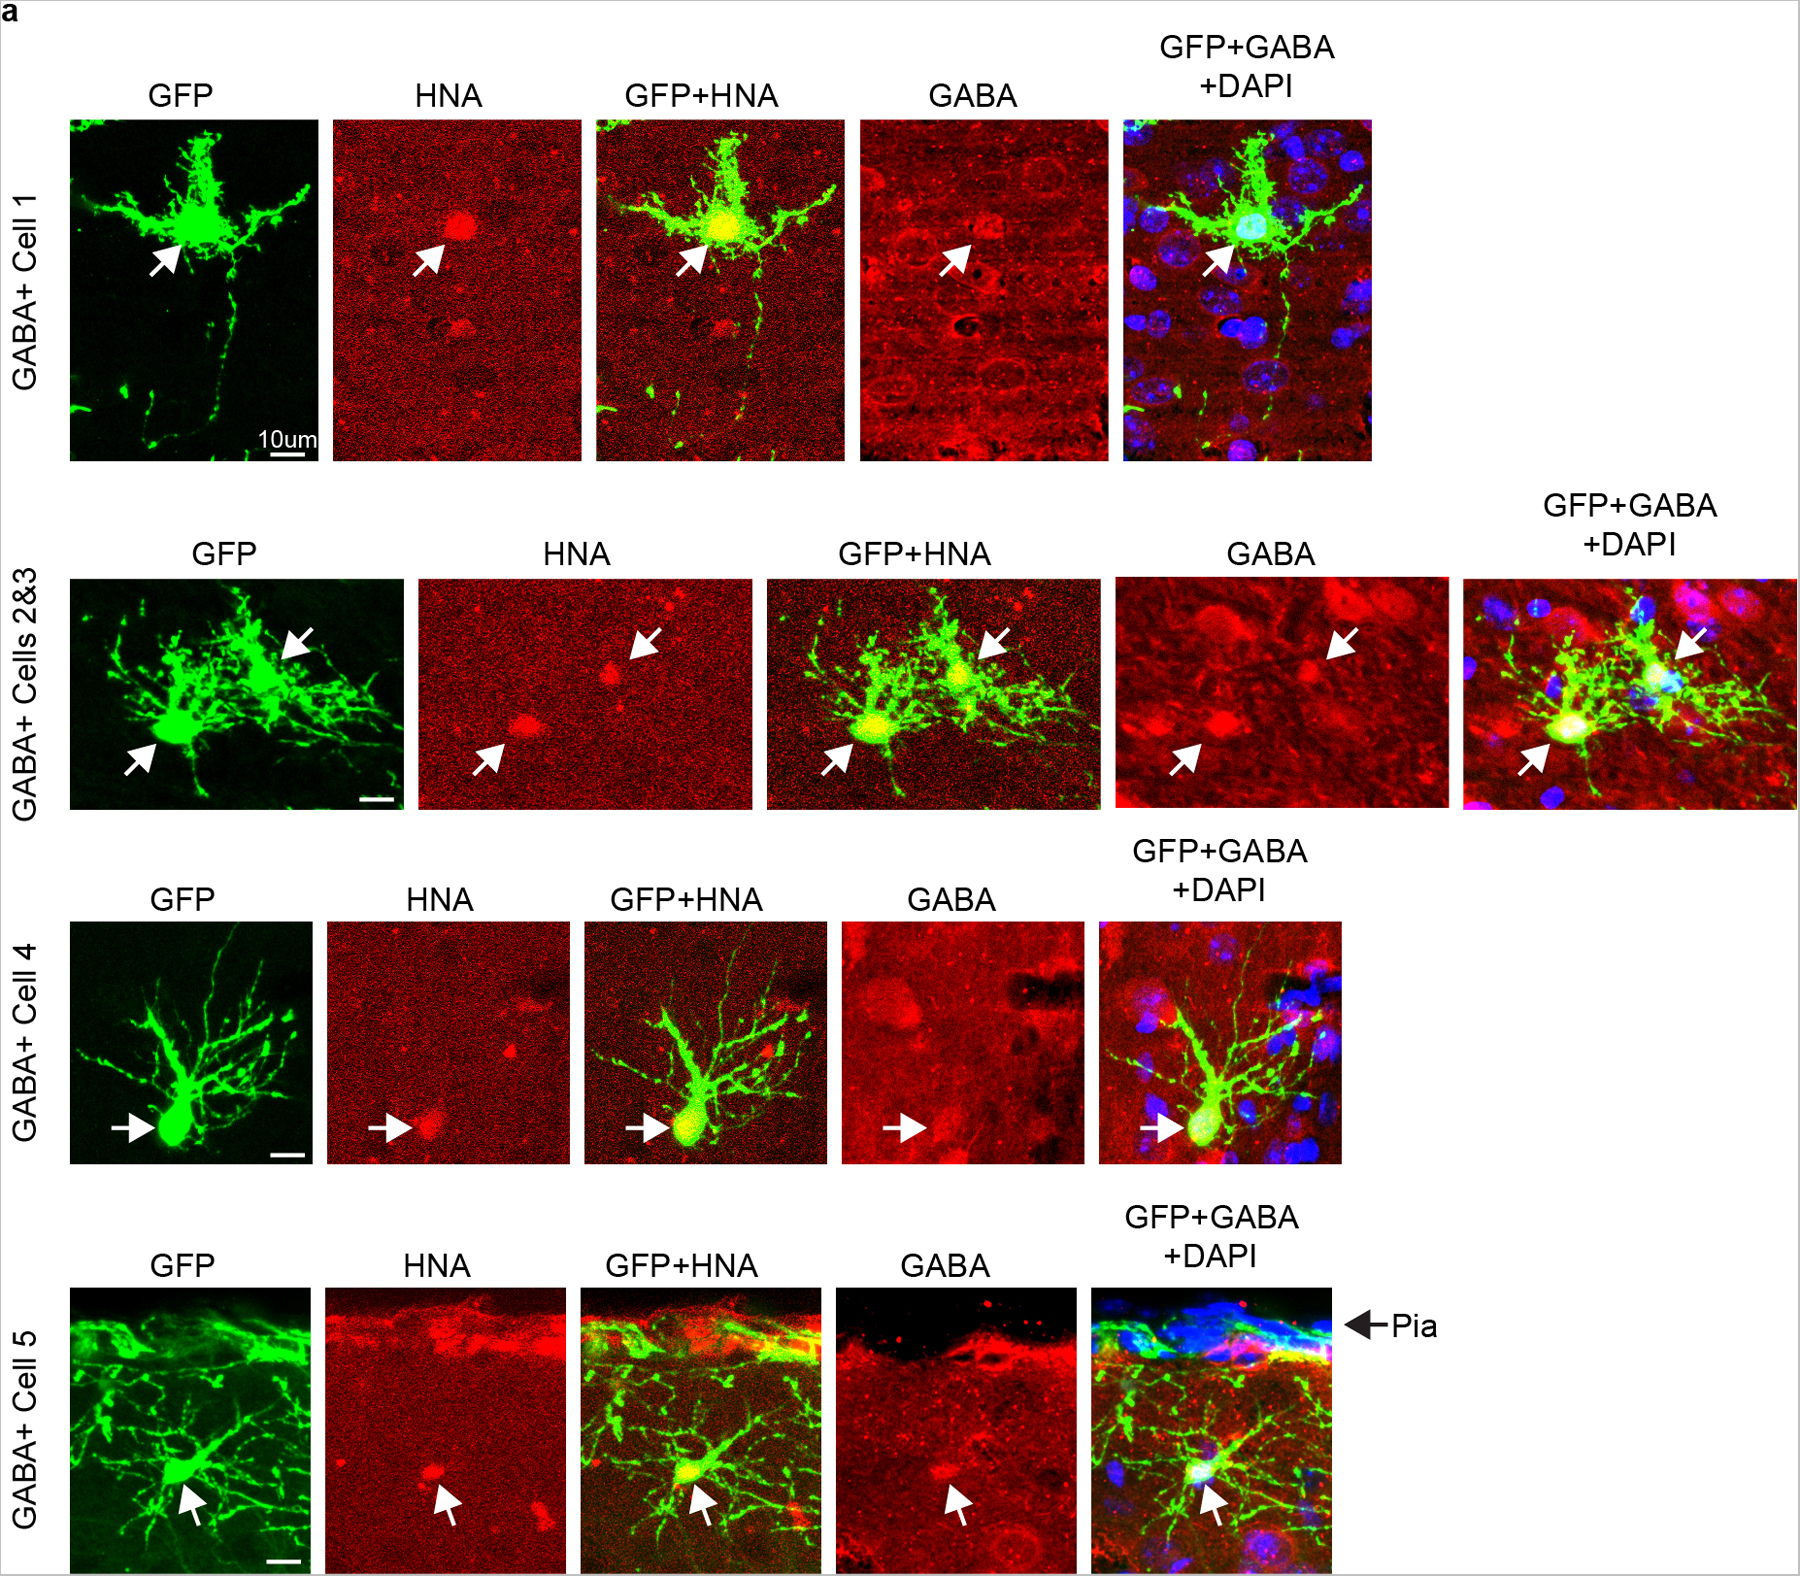
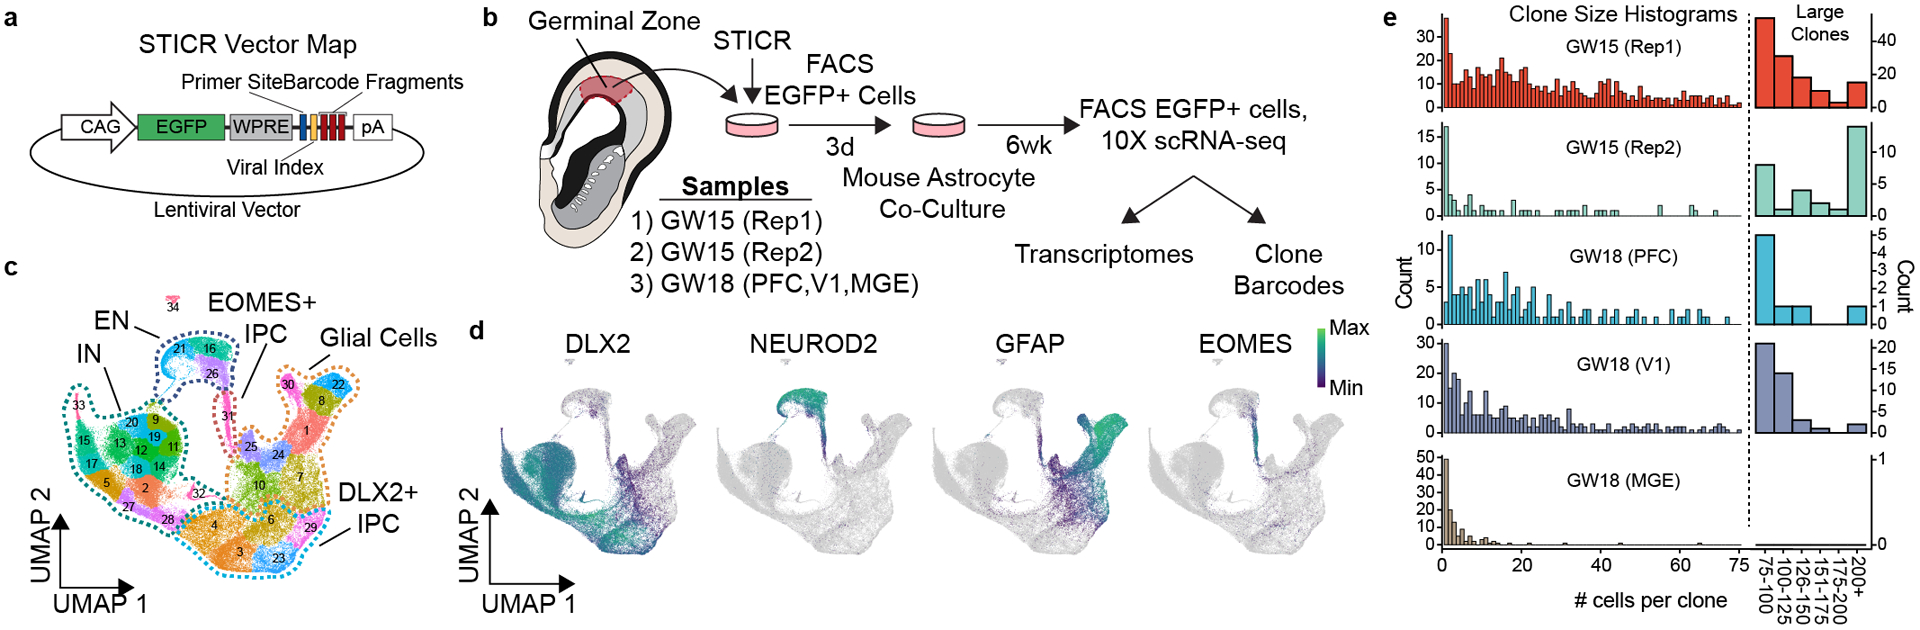
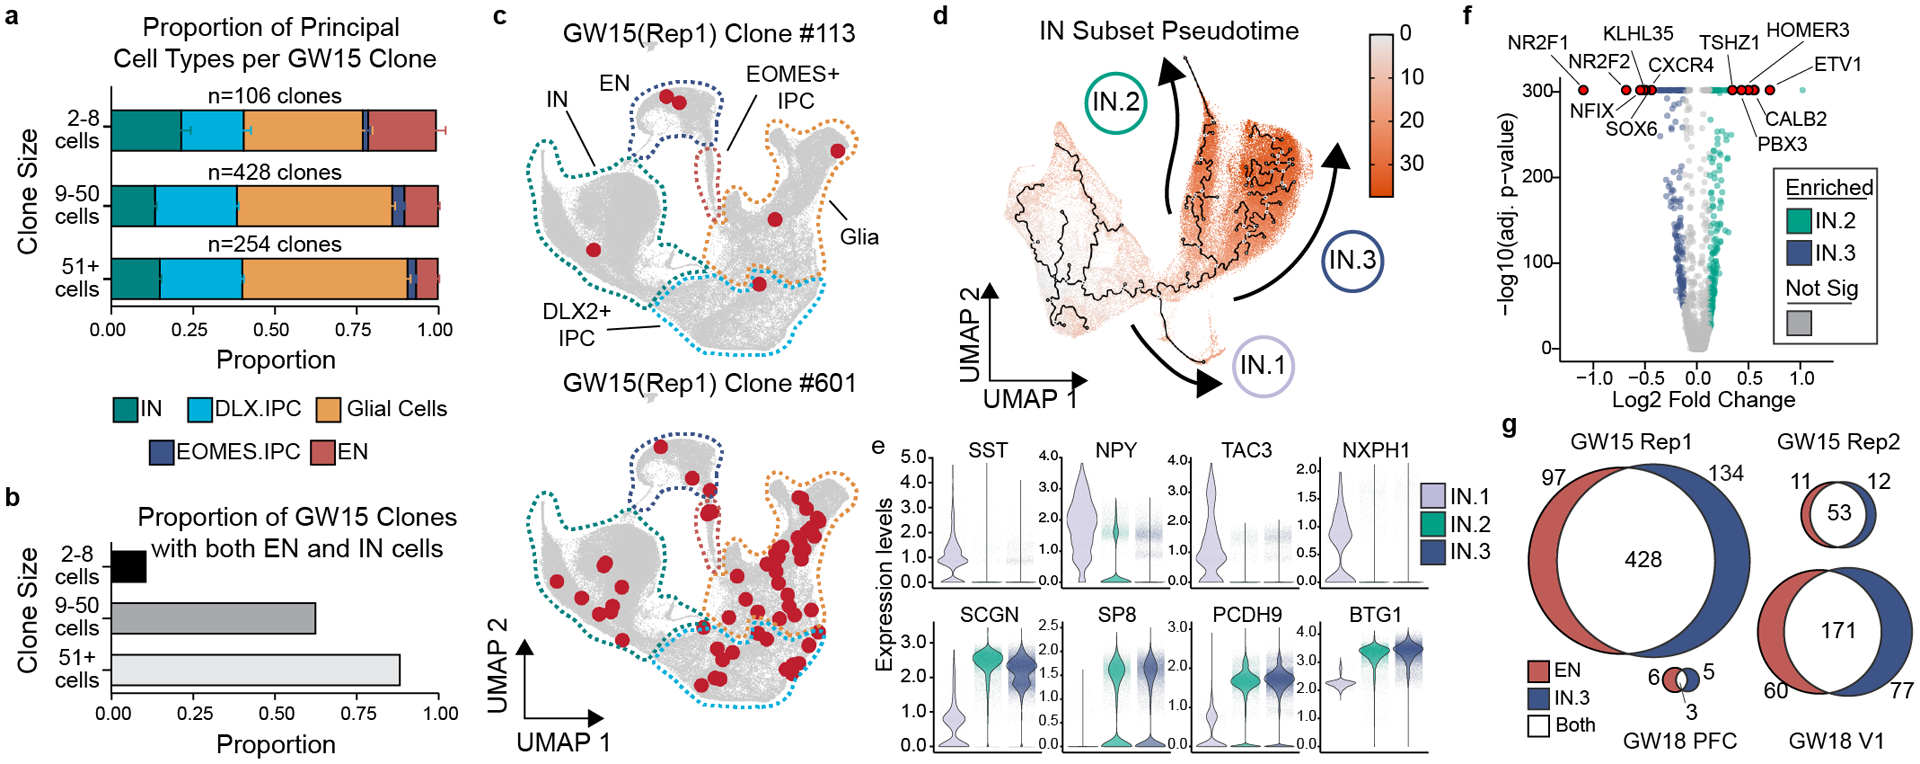
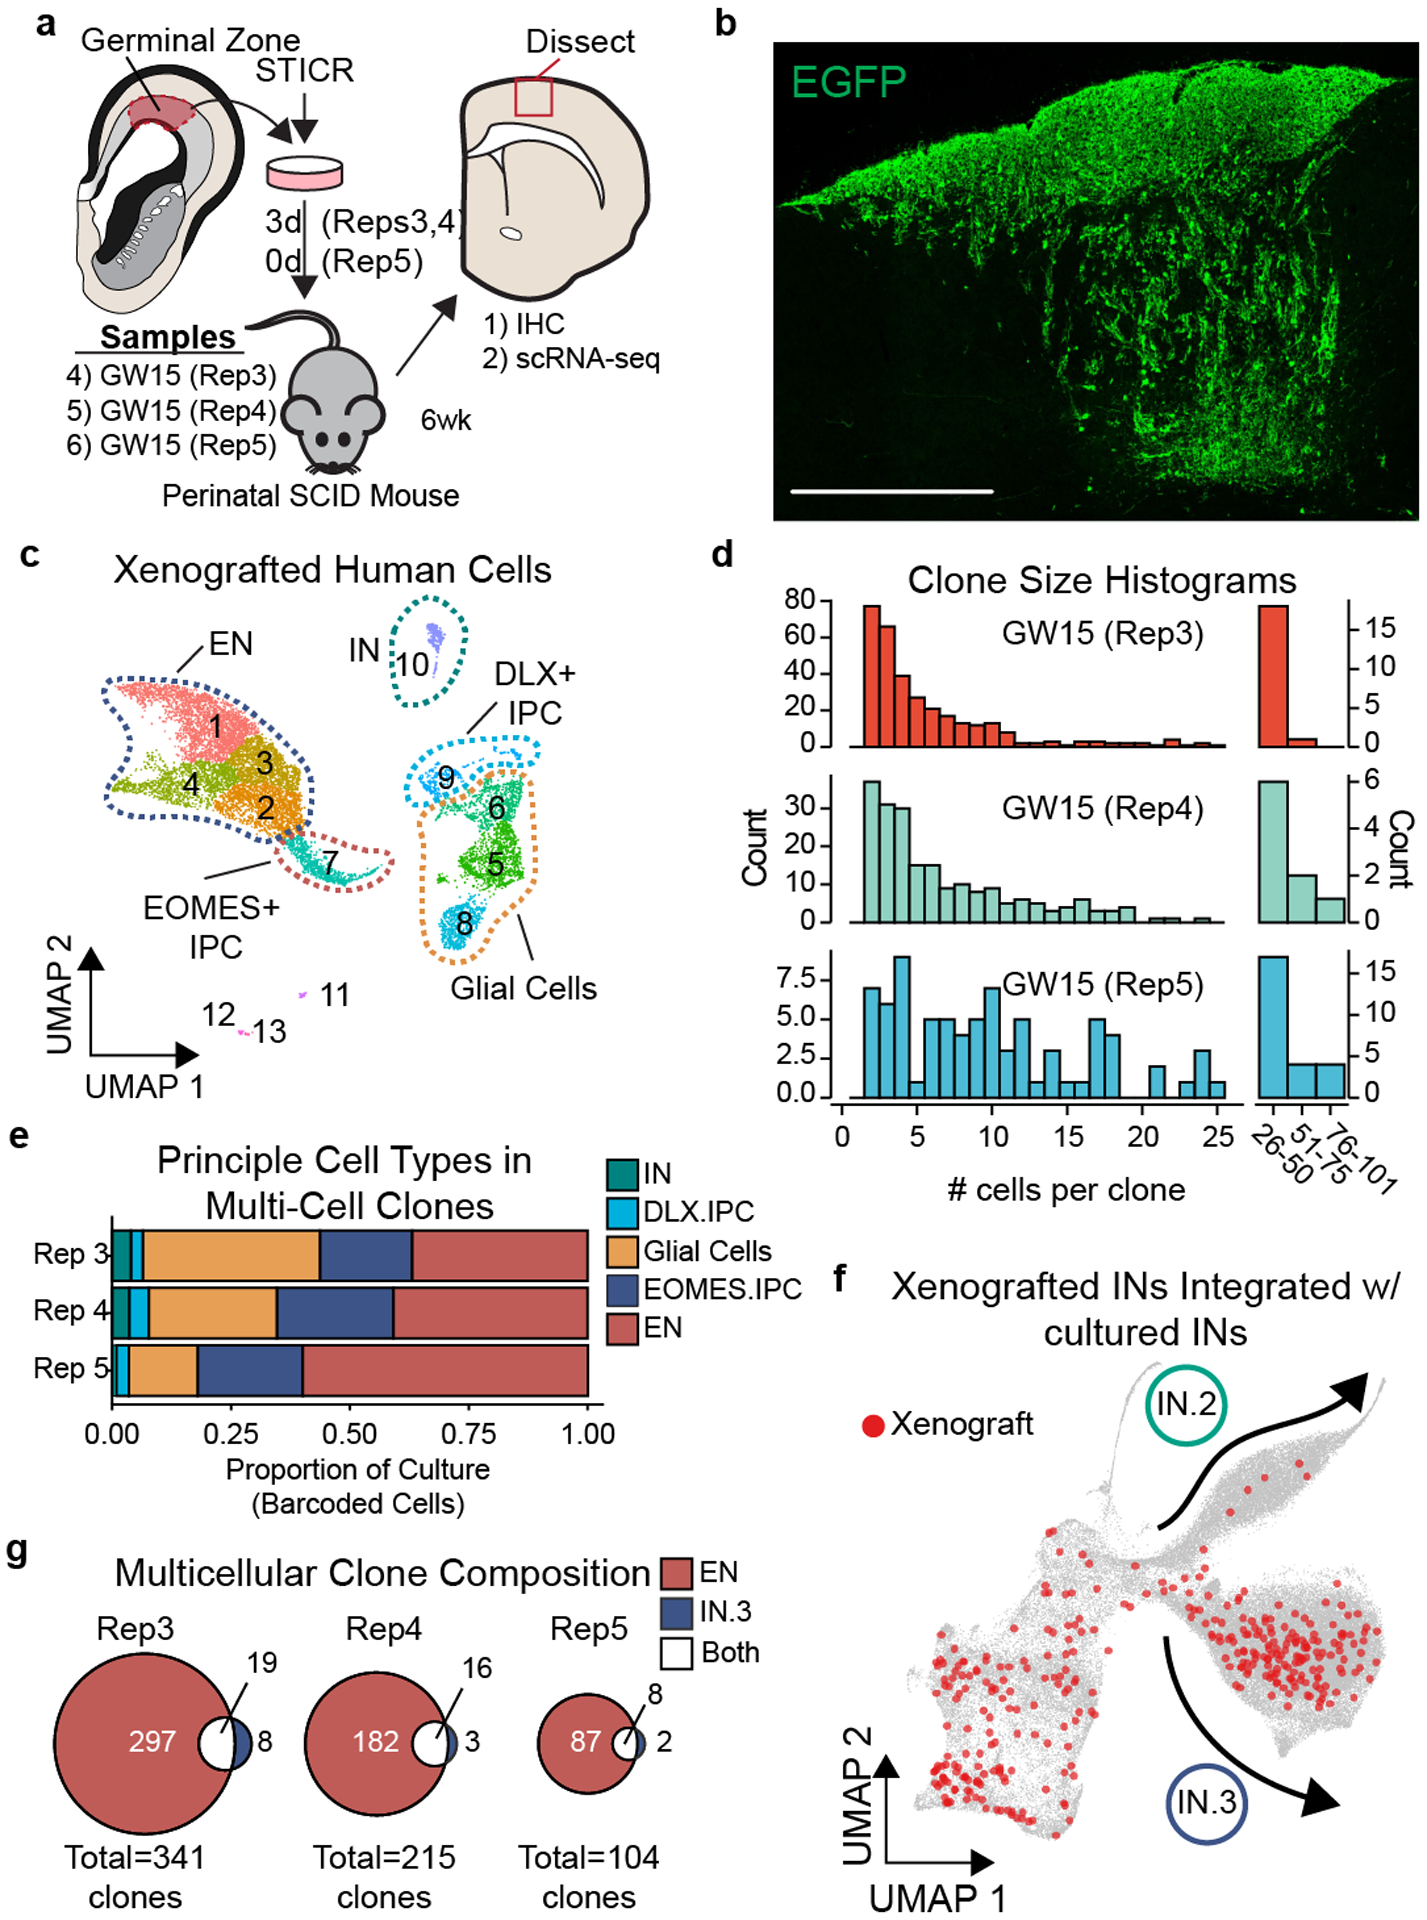
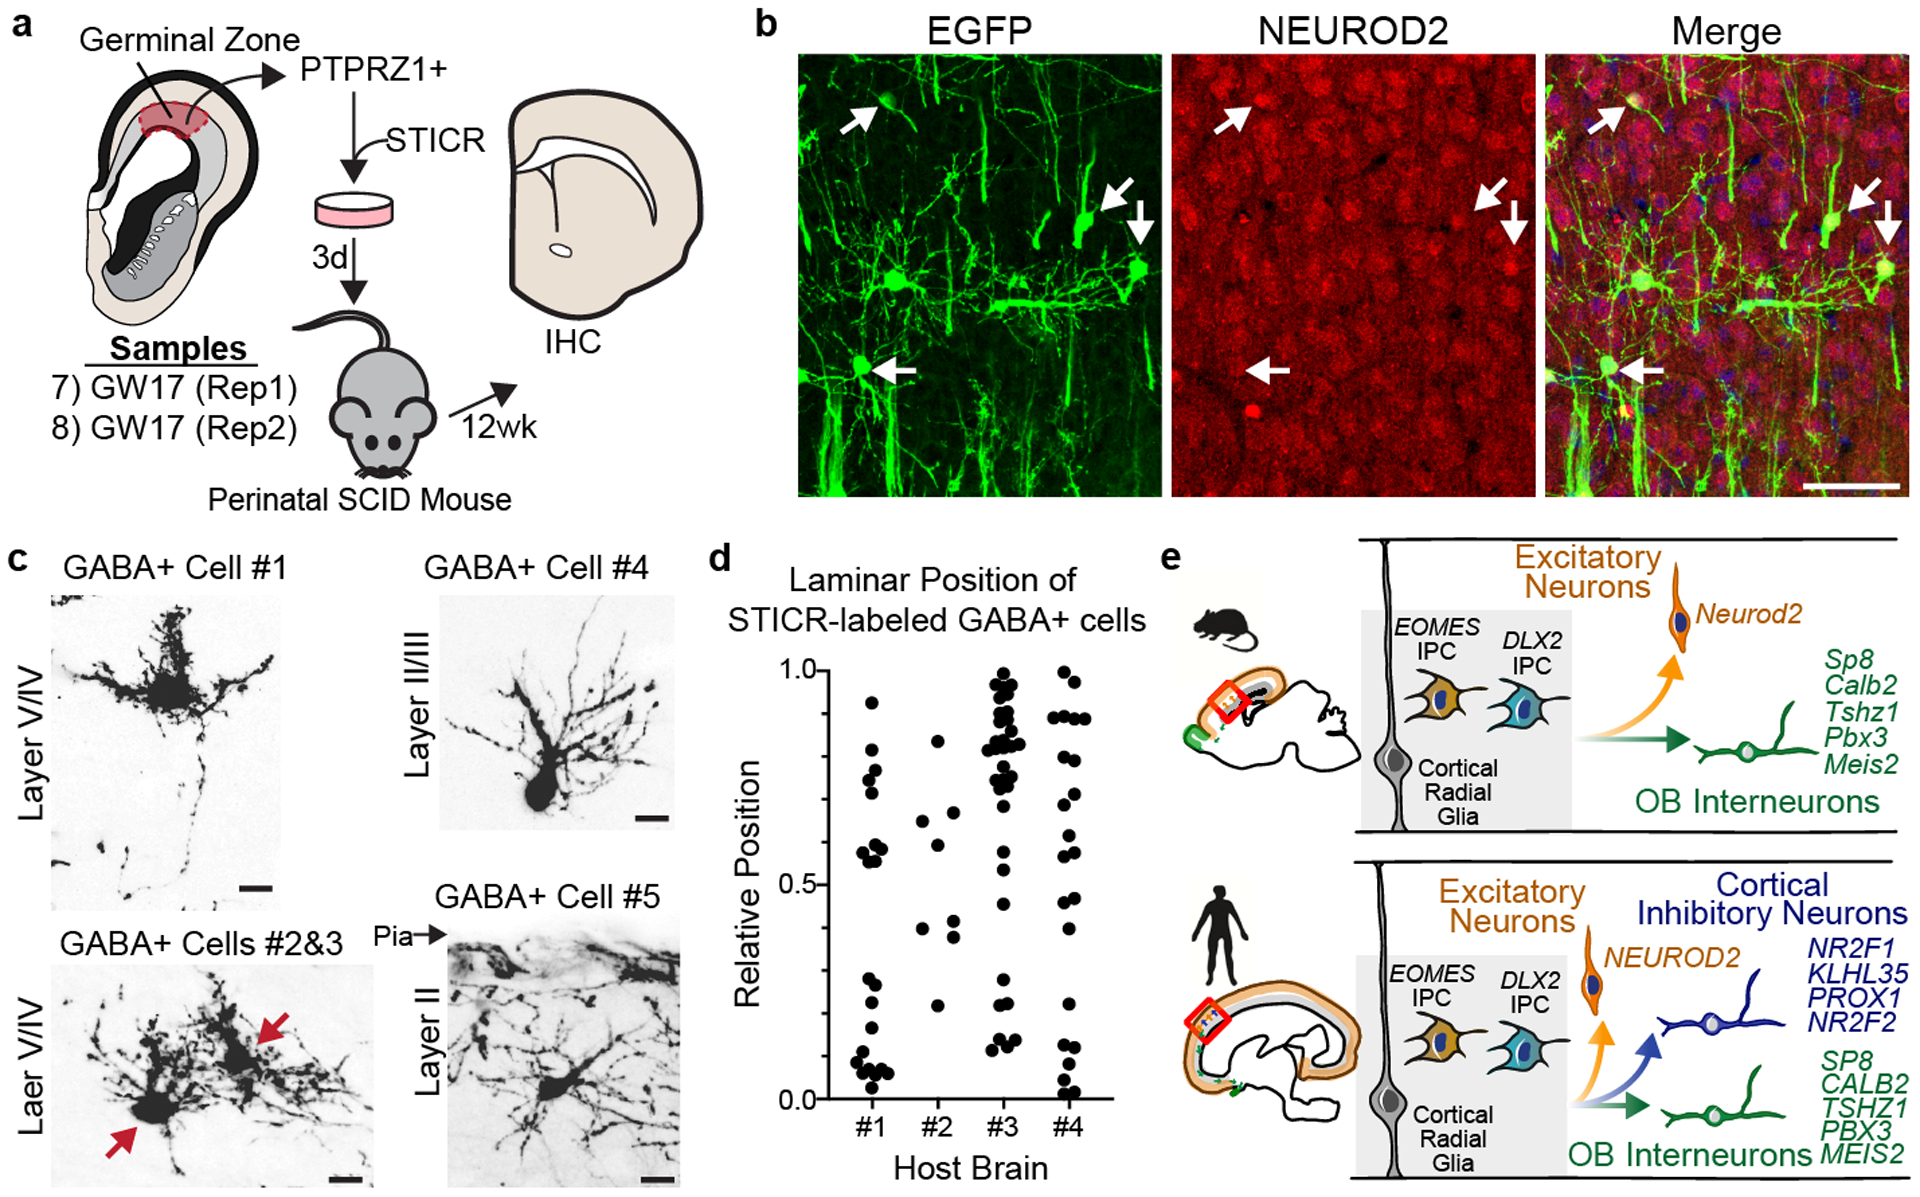
The cerebral cortex is a cellularly complex structure comprising a rich diversity of neuronal and glial cell types. Cortical neurons can be broadly categorized into two classes-excitatory neurons that use the neurotransmitter glutamate, and inhibitory interneurons that use γ-aminobutyric acid (GABA). Previous developmental studies in rodents have led to a prevailing model in which excitatory neurons are born from progenitors located in the cortex, whereas cortical interneurons are born from a separate population of progenitors located outside the developing cortex in the ganglionic eminences1-5. However, the developmental potential of human cortical progenitors has not been thoroughly explored. Here we show that, in addition to excitatory neurons and glia, human cortical progenitors are also capable of producing GABAergic neurons with the transcriptional characteristics and morphologies of cortical interneurons. By developing a cellular barcoding tool called 'single-cell-RNA-sequencing-compatible tracer for identifying clonal relationships' (STICR), we were able to carry out clonal lineage tracing of 1,912 primary human cortical progenitors from six specimens, and to capture both the transcriptional identities and the clonal relationships of their progeny. A subpopulation of cortically born GABAergic neurons was transcriptionally similar to cortical interneurons born from the caudal ganglionic eminence, and these cells were frequently related to excitatory neurons and glia. Our results show that individual human cortical progenitors can generate both excitatory neurons and cortical interneurons, providing a new framework for understanding the origins of neuronal diversity in the human cortex.


Conflict of interest statement

COMPETING INTERESTS

A.A.-B. is Co-founder and on the Scientific Advisory Board of Neurona Therapeutics.

Figures

Extended Data Fig. 1
Extended Data Fig. 1. Validation of the STICR Barcode Design
a) Histogram of pairwise hamming distances between every sequence in each STICR fragment pool. b) Barcode diversity extrapolations derived from sequencing ~30 million reads of a representative STICR plasmid or lentiviral library. Mean±95% confidence range for each library shown. c) Simulated barcode collision frequencies (mean±SD) for a range of starting cell numbers based on barcode diversity estimated in (b). Barcode sampling performed with replacement using measured proportions of barcodes within representative plasmid library depicted in panel b. Each simulation performed 20,000 times. Most error bars (depicting standard deviation) are not visible as they are smaller than the dots (depicting mean value). d) Schematic of “barnyard” species mixing experiment. e) Plot depicting species specific transcript counts from barnyard experiment. Each dot depicts a single cell and the dot color indicates whether the cell was determined to be a 3T3 cell (mouse), Cortex cell (human), or mixed droplet (multiplet). f) Violin plots depicting the number of unique STICR barcode molecules recovered from droplets identified as either mouse, human, or multiplet. ND, not detected.
Extended Data Fig. 2
Extended Data Fig. 2. Cluster Analysis of In Vitro STICR Datasets
a) UMAP plots of each individual biological sample highlighted. b) Top marker gene expression for each cluster. Size of dot corresponds to the proportion of cells in cluster expressing gene while the color of dot corresponds to the average expression level per cluster. c-d) Heatmap depicting pairwise transcriptional cluster correlation of in vitro cultured cells with c) self and d) 2017 Nowakowski et al scRNA-seq atlas. Principal cell type designation depicted next to each column and row. Dendrogram depicts hierarchical clustering distance.
Extended Data Fig. 3
Extended Data Fig. 3. Transcriptional Analysis of In Vitro STICR Datasets
a-f) Feature plots depicting expression of genes corresponding to (a) cell cycle, (b) glia, (c) oligodendroglia, (d) excitatory neurons, (e) interneurons, (f) regional markers. g) Bar plot depicting the proportion of cells within each cluster with a recovered STICR barcode. h) Heatmap depicting percentage of STICR barcodes shared between biological samples. GW15 (Rep1), and all GW18 samples were labeled with same viral stock, while GW15 (Rep2) was labeled with a different stock (methods). i) Stacked barplot depicting relative proportions of principal cell types within each sample, restricted to cells that are members of multi-cellular clones.
Extended Data Fig. 4
Extended Data Fig. 4. Clonal Analysis of EN-Containing Cortical Clones
a) Histogram of excitatory neuron counts within each multi-cell cortical clone. Left, clone sizes from 1–25 cells in single cell bins. Right, clone sizes of >25 cells in indicated bin sizes. b) Box and whisker plot depicting the proportion of EN cells within individual multi-cell clones for each biological sample. Maxima and minima of box depicts 3rd and 1st quartiles, while center of box depicts the median. Whiskers depict 1.5x the interquartile distance. Individual clone value shown as dots. Number of clones is listed below each sample group. c) Ternary plots depicting the relative proportions of interneurons, excitatory neurons, and all other cell types (“Other”) within individual clones. d-e) Immunohistochemistry of in vitro cultures derived from GW15 germinal zone cells labeled with STICR. d) Low-magnification image to show distribution, Scale bar; 25μm. e) High-magnification image showing cluster of ENs, Scale bar; 250μm.
Extended Data Fig. 5
Extended Data Fig. 5. Clonal and Transcriptional Analysis of In Vitro INs and DLX2+ IPCs
a) UMAP embedding and Louvain sub-clustering of GABAergic inhibitory neuron trajectory cells. b) Feature plots depicting expression of MKI67, STMN2, CENPF, and ERBB4. c) Heatmap depicting pairwise transcriptional cluster correlation of this dataset with itself d) Stacked barplot depicting relative proportion of multicellular clones from each sample that comprise each IN trajectory. e) Feature plots depicting MGE-derived cells (red) and expression of NKX2–1, LHX6, ACKR3, MAF, and PDE1A. Enlarged inset shown below shows IN.1 trajectory cells. f) Stacked barplot depicting relative proportion of different IN trajectory cells within multi-cell clones of each sample. g) Heat-plot depicting differential expression of IN.2 and IN.3 marker genes in developing human cortex, OB/rostral migratory stream, and basal ganglia. Data derived from the Allen BrainSpan Laser Capture Microdissection database. Color of each cell corresponds to quantile-normalized z-score. Dendrograms reflect hierarchical clustering of genes and samples while colors represent quantile-normalized z-score. h) Paired violin plots and ISH images of P60 mouse brains from the Allen Brain Atlas for select genes. Log2 fold difference between IN.2 (OB-like) and IN.3 (cortical interneuron-like) cells depicted above each violin plot. i) Stacked bar-plots depicting relative proportions of IN.1, IN.2, IN.3, excitatory neuron, and glia trajectory cells within multi-cell clones. Number of clones listed below each sample. j) Venn diagram depicting the number of EN-containing multicellular cortical clones that also contain IN.2 and/or IN.3 cells.
Extended Data Fig. 6
Extended Data Fig. 6. Clonal and Transcriptional Analysis of In Vitro ENs and EOMES+ IPCs
a) UMAP embedding and Louvain subclustering of EN trajectory cells. b-c) Heatmap depicting pairwise transcriptional cluster correlation of subclustered EN trajectory cells with b) self and c) 2017 Nowakowski et al. developing human brain scRNA-seq atlas. d) Feature plots depicting expression of genes corresponding to labelled subclustered EN trajectory subtypes. e) Stacked barplot depicting relative proportions of EN subtypes within EN trajectory cells of multicellular clones. f) Venn diagram depicting the number of multicellular cortical clones containing Deep-like ENs, Upper-like ENs, and IN.3 cells.
Extended Data Fig. 7
Extended Data Fig. 7. Characterization of Human Cortical Progenitor Xenografts at 6 Weeks
a-b) Representative images of transplanted human cortical cells analyzed by IHC for principal cell type markers 6 weeks after transplantation. EGFP expression from STICR in green, NEUROD2 or GABA shown in red. Scale bars: a, 50μm; b,10μm. c) Bar-plot depicting proportion (mean±SD) of transplanted cells expressing principal cell type markers as assessed by IHC. n=7 sections derived from 6 xenografted mice, 3 of which were transplanted with donor cells from GW15 Rep1 and 3 GW15 Rep2. d) Top marker gene expression for each cluster from xenografted cells. Size of dot corresponds to the proportion of cells in cluster expressing the gene while the color of each dot corresponds to the average expression level per cluster. e) UMAP embedding of xenografted cells and feature plots depicting expression of NEUROD2, EOMES, DLX2, MKI67, and GFAP. f) Heatmap depicting pairwise transcriptional cluster correlation of subclustered EN trajectory cells with 2017 Nowakowski et al. developing human cortex scRNA-seq atlas g) Comparison of principal cell type quantification (mean) in transplanted cells by analysis method (IHC vs scRNA-seq) and biological replicate.
Extended Data Fig. 8
Extended Data Fig. 8. Transcriptional analysis of ENs and INs from Xenografts
a) UMAP embedding and Louvain subclustering of IN trajectory cells from xenografts. b) Feature plots depicting expression of CENPF, MKI67, ERBB4, NR2F1, NFIX, SP8, SCGN, and KLHL35. c) Heatmap depicting pairwise transcriptional cluster correlation of subclustered xenograft IN and DXL2+ IPC trajectory cells with 2017 Nowakowski et al. developing human cortex scRNA-seq atlas. d) UMAP embedding depicting cells in multicellular clones from xenograft IN subclusters 1 (salmon) and 2 (lime) integrated with in vitro cultured STICR IN subset. e) UMAP embedding depicting individual multicellular clones from xenograft IN subset cells integrated with in vitro cultured STICR IN subset, split by biological replicate. Members of multicellular clones highlighted in red. f) UMAP embedding and Louvain subclustering of excitatory neuron and EOMES+ IPC trajectory cells from xenografts. g) Heatmap depicting pairwise transcriptional cluster correlation of subclustered xenograft EN and EOMES+ IPC trajectory cells with 2017 Nowakowski et al. developing human cortex scRNA-seq atlas.
Extended Data Fig. 9
Extended Data Fig. 9. Analysis of PTPRZ1-Sorted STICR+ Cells in Ctx, SVZ, RMS, and OB at 12 weeks
a) Representative FACS plots depicting isolation of PTPRZ1+ cells from cortical germinal zone. b) Representative image of transplanted human cortical cells cells in cortex of 12 week old host mouse. EGFP expression from STICR depicted in green, DAPI in blue. Scale bar, 50μm. CC, corpus callosum. c) Representative images of PTPRZ1-sorted, STICR-labeled cells in the dorsolateral corner of the lateral ventricle of a 12 week old host mouse analyzed by IHC. EGFP from STICR in green, DCX in red, and DAPI in blue. Scale bar, 100um. d) High magnification inset of region boxed in panel c. Scale bar, 10um. e) Representative images of PTPRZ1-sorted, STICR-labeled cells in the rostral forebrain analyzed by IHC. RMS outlined by white box labeled f. GFP expression in green, DCX expression in red, and DAPI in blue. Scale bar, 100um. f) High magnification insets of RMS depicted in white box in panel e. Scale bar, 10um. Cell outlined by white box magnified below. g) Representative images of PTPRZ1-sorted, STICR-labeled cells that migrated from transplantation site in cortex to the olfactory bulb analyzed by IHC. EGFP expression in green and DAPI in magenta. MCL= Mitral cell layer, GCL= glomerular cell layer. Scale bar, 10um.
Extended Data Fig. 10
Extended Data Fig. 10. Immunohistochemistry of STICR-Labeled Cortical INs from Xenografts at 12 weeks
a) Representative images of STICR-labeled GABA+ cells throughout the cortical plate analyzed by IHC. EGFP from STICR in green, GABA in red, and DAPI in blue. Same cells from Fig 4d. Arrows point to STICR-labeled GABA+ cells. Scale bar, 10μm.
Figure 1.
Figure 1.. STICR-labeled progenitors generate all three principal cortical cell types
a) Lentiviral vector design of STICR b) Schematic of experimental design used to label and capture samples. c) UMAP embedding and Louvain clustering of STICR-labeled cells following scRNA-seq. d) Feature plot of principal cell trajectory marker genes DLX2 (GABAergic inhibitory neurons and DLX2+ IPCs), NEUROD2 (excitatory neurons), GFAP (glia), and EOMES (EOMES+ IPCs). e) Histogram of clone sizes within each sample. Left, clone sizes from 1–75 cells. Right, clone sizes of >75 cells in 25 cell bins.
Figure 2.
Figure 2.. Individual human cortical progenitors can generate both excitatory and inhibitory cortical neurons in vitro
a) Stacked boxplot depicting the average (mean±SD) proportion of GABAergic inhibitory neurons, DLX2+ IPCs, EOMES+ IPCs, excitatory neurons, and glia in different sized clones. b) Bar graph depicting the proportions of clones of different sizes that contain both EN and IN cells. c) Representative 6 cell (GW15, Rep1, #113) and 61 cell (GW15, Rep1, #601) clones depicted in UMAP space. Cells within each clone colored in red. Dashed lines depict borders of principal cell types from Fig. 1c. d) Pseudotime transcriptional trajectories of subclustered inhibitory neurons. Three different interneuron transcriptional trajectories (IN.1, IN.2 and IN.3) indicated with arrows. e) Violin plots depicting gene expression of IN.1 marker genes (SST, NPY, TAC3, and NXPH1) and general CGE marker genes (SCGN, SP8, PCDH9, and BTG1) in IN.1, IN.2, and IN.3 trajectories. f) Volcano plot comparing gene expression differences between IN.2 and IN.3 trajectory cells. g) Venn diagram depicting the number of multicellular cortical clones that contain IN.3 or EN cells.
Figure 3.
Figure 3.. Xenografted human cortical progenitors generate both excitatory and inhibitory cortical neurons in the same clone
a) Schematic depicting experimental design and analysis of STICR-labeled progenitors by IHC and scRNA-seq following transplantation into the postnatal murine cortex. b) Representative image of transplanted human cortical cells. EGFP expression from STICR depicted in green. Scale bar, 500um. c) UMAP embedding and Louvain clustering of xenografted cells following scRNA-seq. d) Histogram of clone sizes within each xenograft sample. Left, clone sizes from 1–55 cells. Right, clone sizes of >25 cells in 25 cell bins. e) Stacked barplot depicting relative proportion of principal cell types within multi-cellular clones of each sample. f) UMAP embedding of both cultured and xenograft-derived INs. Xenograft-derived cells that are members of multicellular clones highlighted in red. IN.2 and IN.3 trajectories depicted with arrows. g) Venn diagram showing number of multi-cell clones containing excitatory neurons and/or IN.3 neurons.
Figure 4.
Figure 4.. Xenografted human cortical progenitors generate GABAergic inhibitory neurons that distribute across the cortical laminae
a) Schematic depicting experimental design and analysis of PTPRZ1-enriched, STICR-labeled progenitors by IHC following transplantation into the postnatal murine cortex. c) Representative images of transplanted human cortical cells analyzed by IHC. EGFP expression from STICR depicted in green, NEUROD2 in red, and DAPI counterstain in blue. Arrows indicate NEUROD2+/STICR+ double positive cells. Scale bars, 50um d) Representative images of STICR-labeled GABA+ cells throughout the cortical plate. Red arrows depict soma of two cells in the same image. Scale bar, 10um. e) Relative laminar position of GABA+/STICR+ cells in the cortical plate from corpus callosum (value of 0.0) to pial surface (value of 1.0) in each mouse host brain. Host brains #1 and #2 transplanted with GW17 (Rep2), Host brains #3 and #4 transplanted with GW17 (Rep3). f) Schematic depicting difference in the developmental potential between human and mouse cortical progenitors.

References

    1. Anderson SA, Eisenstat DD, Shi L & Rubenstein JL Interneuron migration from basal forebrain to neocortex: dependence on Dlx genes. Science 278, 474–476 (1997). - PubMed
    1. Sussel L, Marin O, Kimura S & Rubenstein JL Loss of Nkx2.1 homeobox gene function results in a ventral to dorsal molecular respecification within the basal telencephalon: evidence for a transformation of the pallidum into the striatum. Development 126, 3359–3370 (1999). - PubMed
    1. Gorski JA et al. Cortical excitatory neurons and glia, but not GABAergic neurons, are produced in the Emx1-expressing lineage. The Journal of neuroscience : the official journal of the Society for Neuroscience 22, 6309–6314, doi:20026564 (2002). - PMC - PubMed
    1. Xu Q, Tam M & Anderson SA Fate mapping Nkx2.1-lineage cells in the mouse telencephalon. The Journal of comparative neurology 506, 16–29, doi:10.1002/cne.21529 (2008). - DOI - PubMed
    1. Anderson SA, Marin O, Horn C, Jennings K & Rubenstein JL Distinct cortical migrations from the medial and lateral ganglionic eminences. Development 128, 353–363 (2001). - PubMed