. 2022 Jan;601(7891):85-91.
doi: 10.1038/s41586-021-04217-4. Epub 2021 Dec 15.

Spatial genomics enables multi-modal study of clonal heterogeneity in tissues

Affiliations

Spatial genomics enables multi-modal study of clonal heterogeneity in tissues

Tongtong Zhao et al. Nature. 2022 Jan.

Abstract

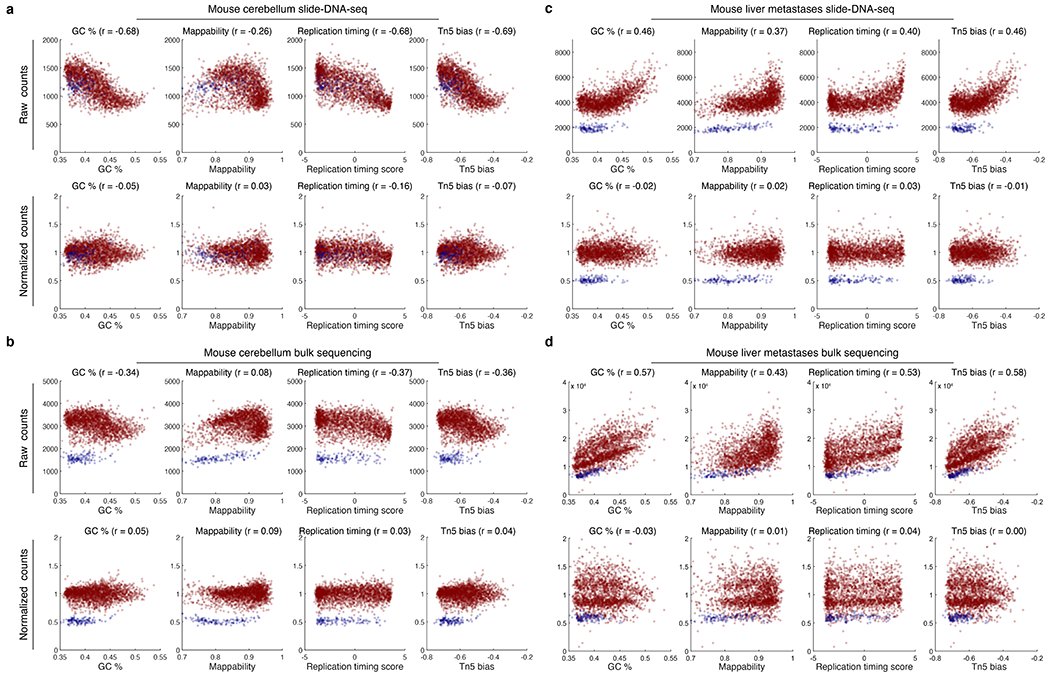
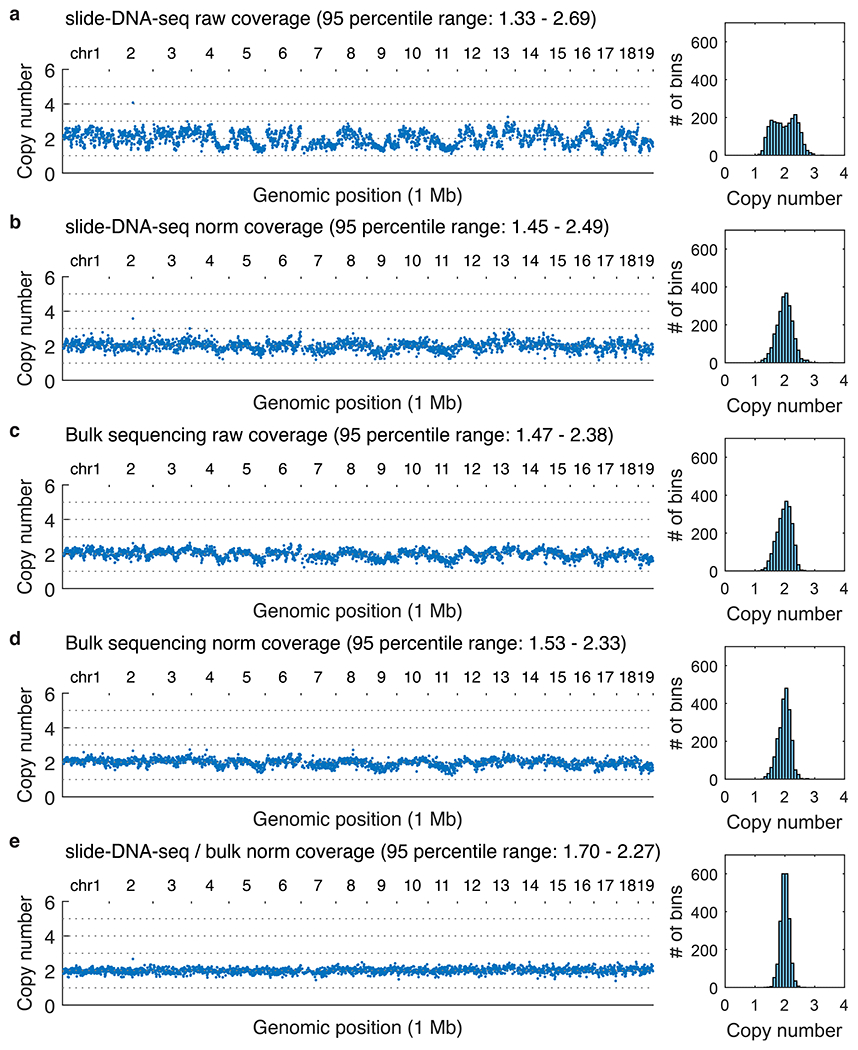
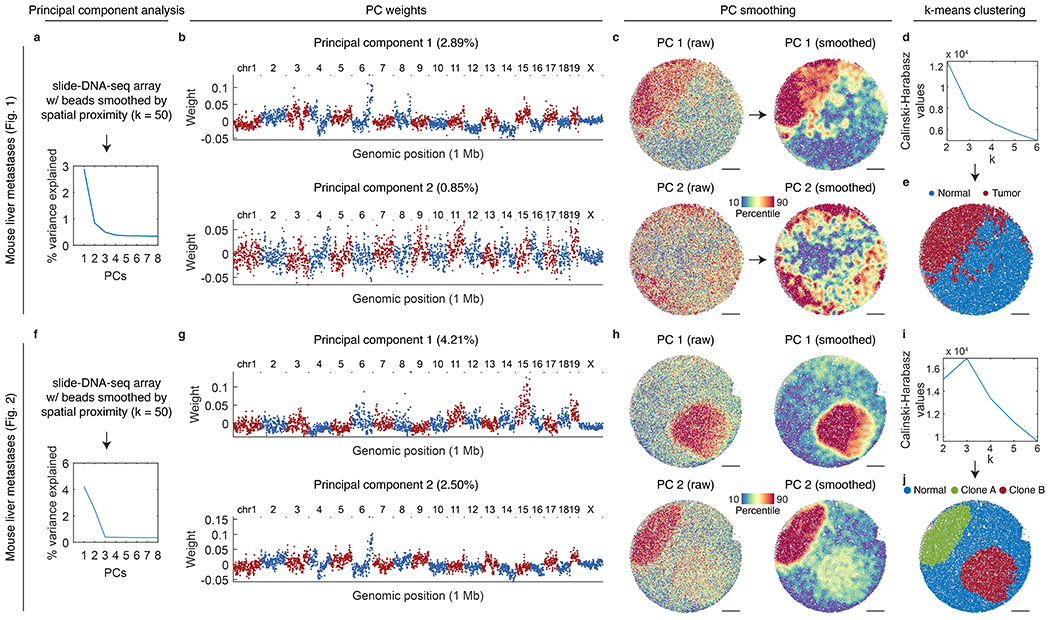
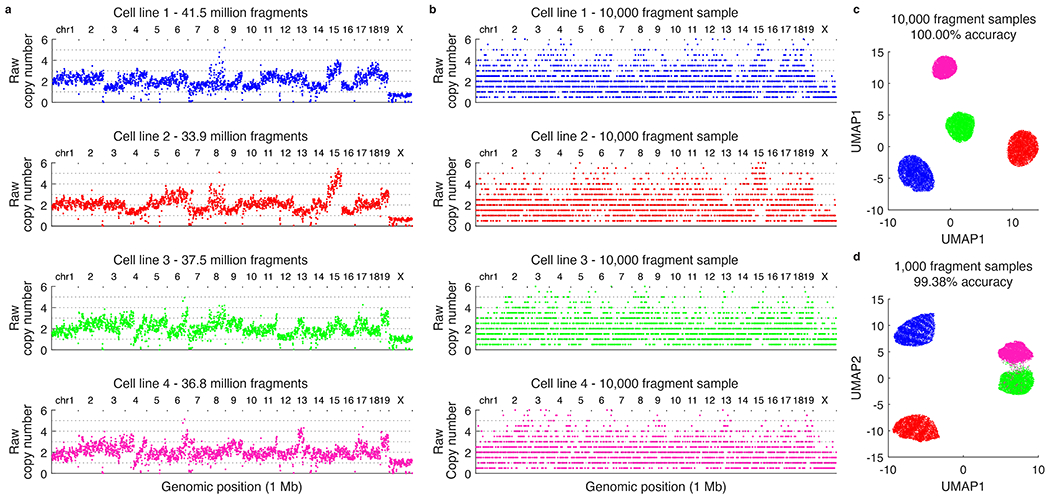
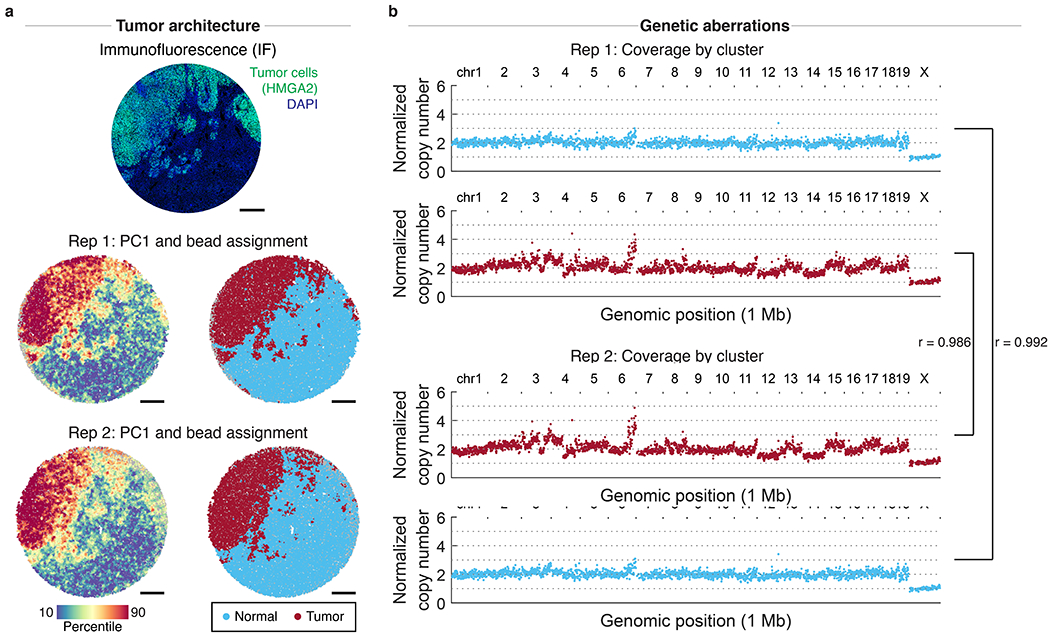
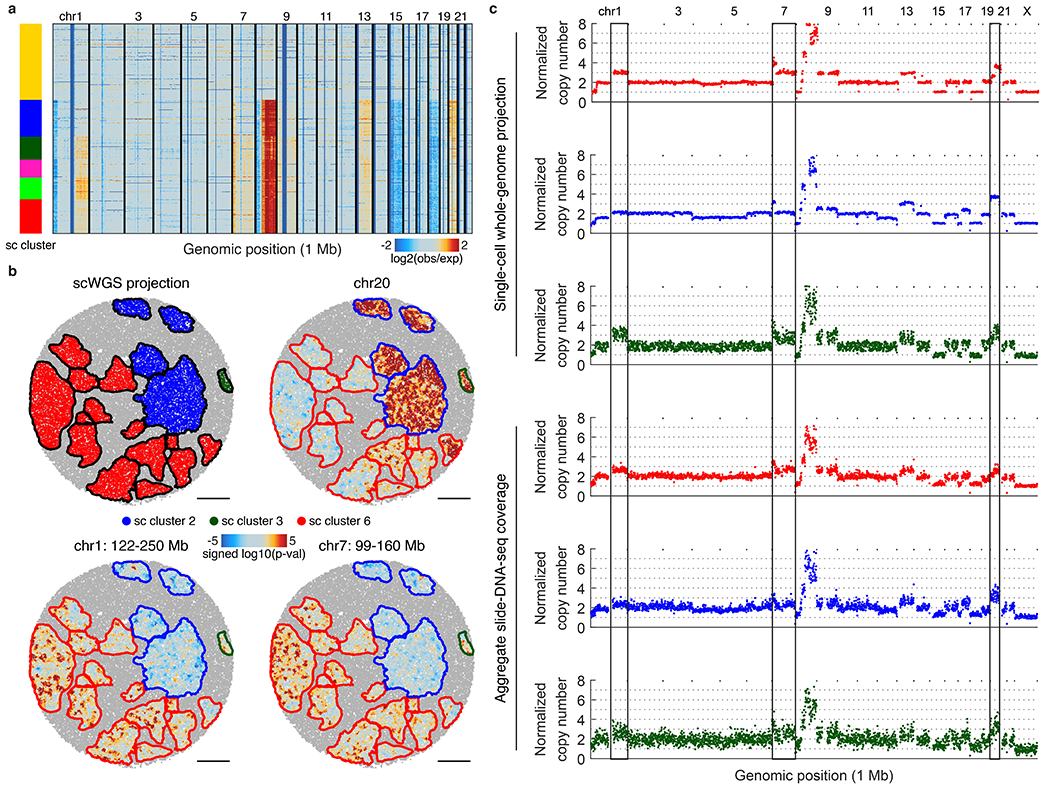
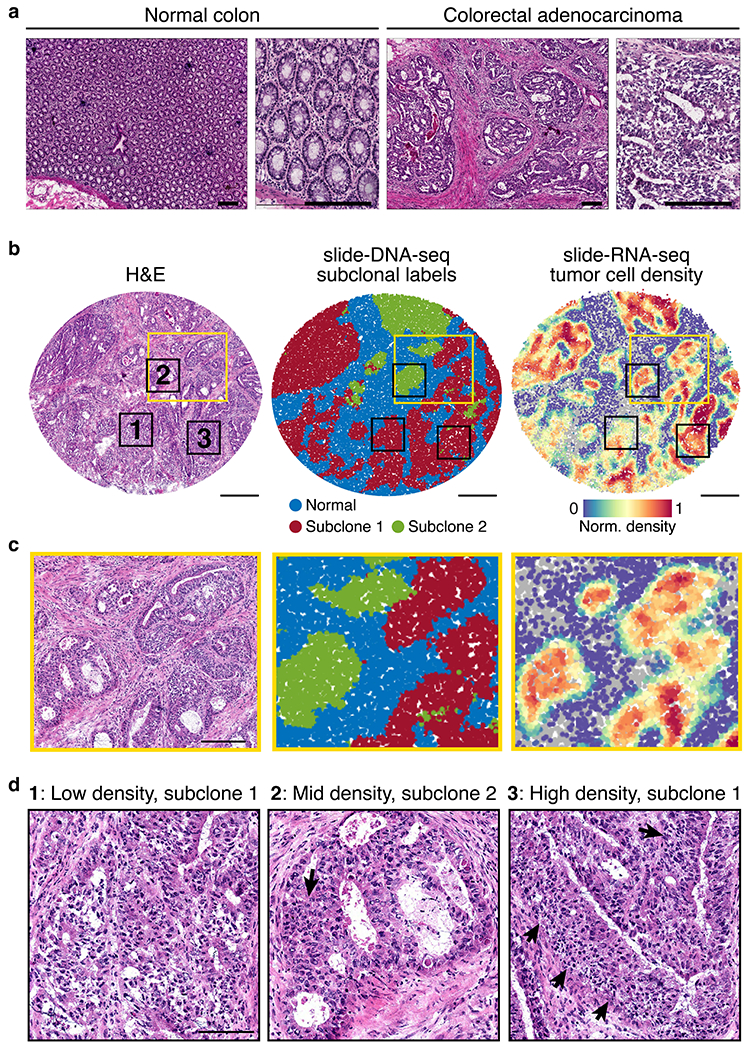
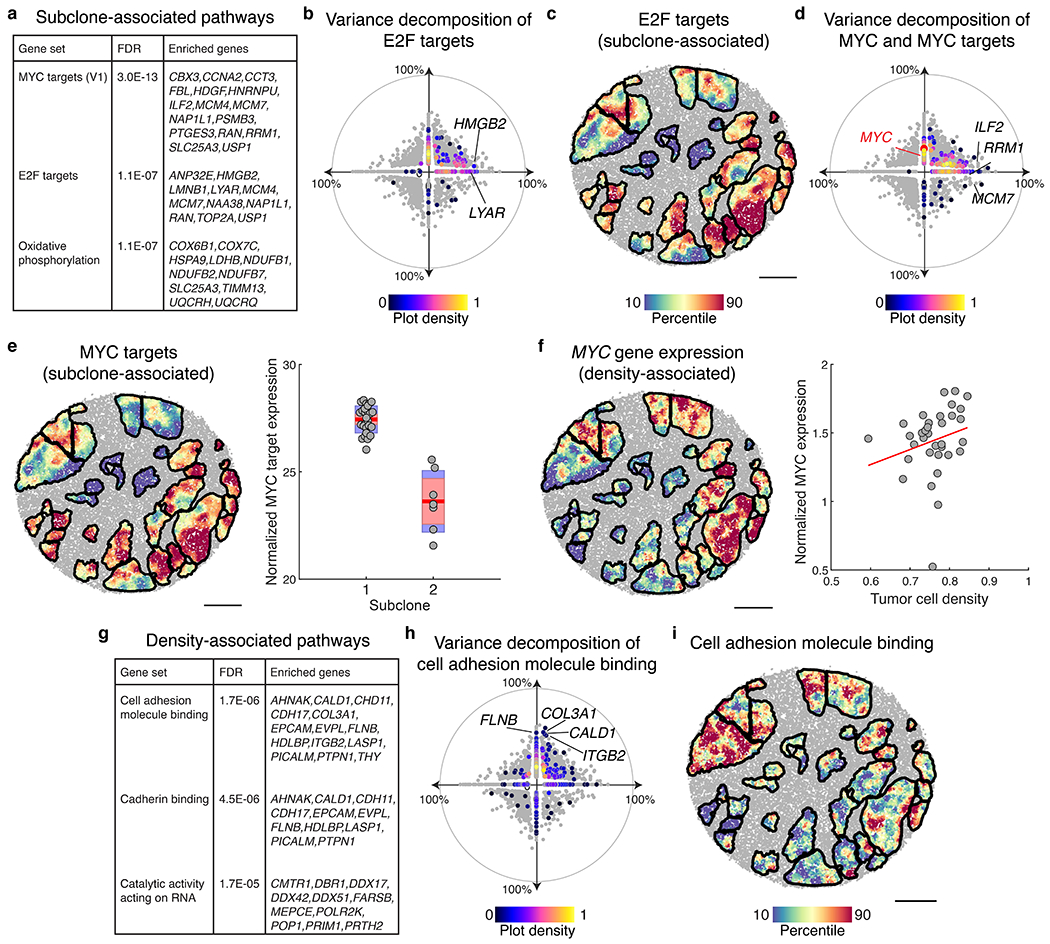
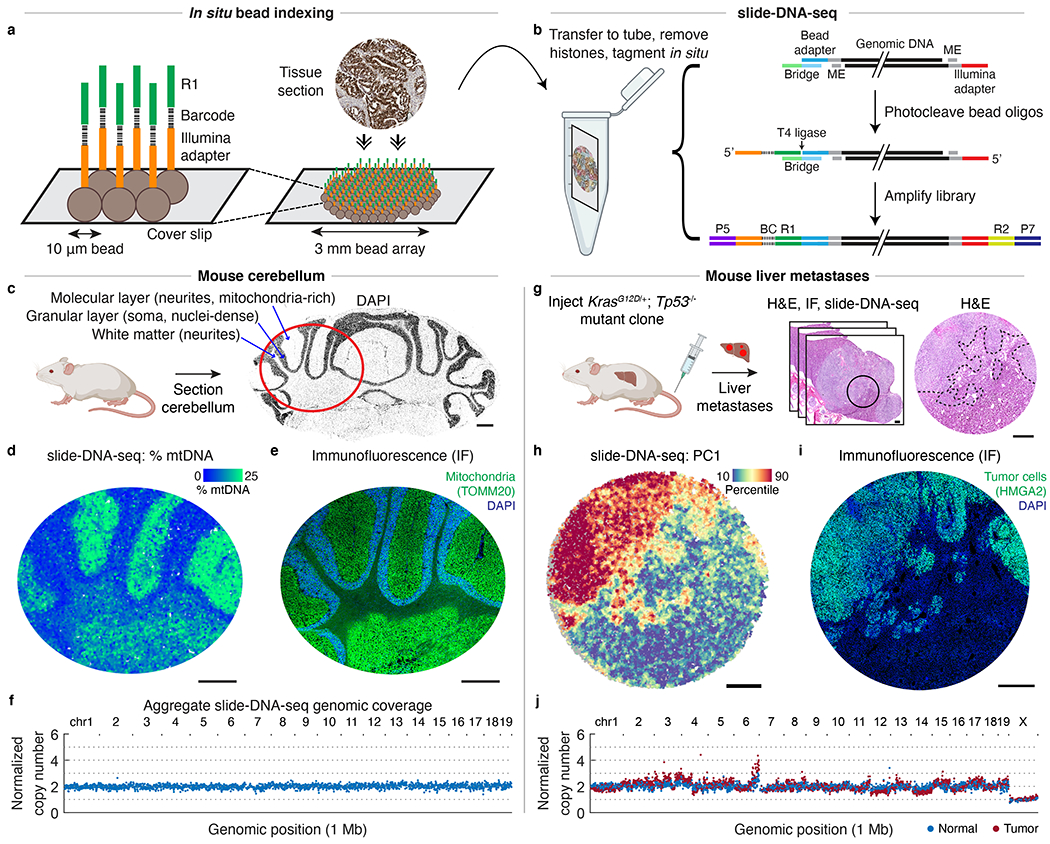
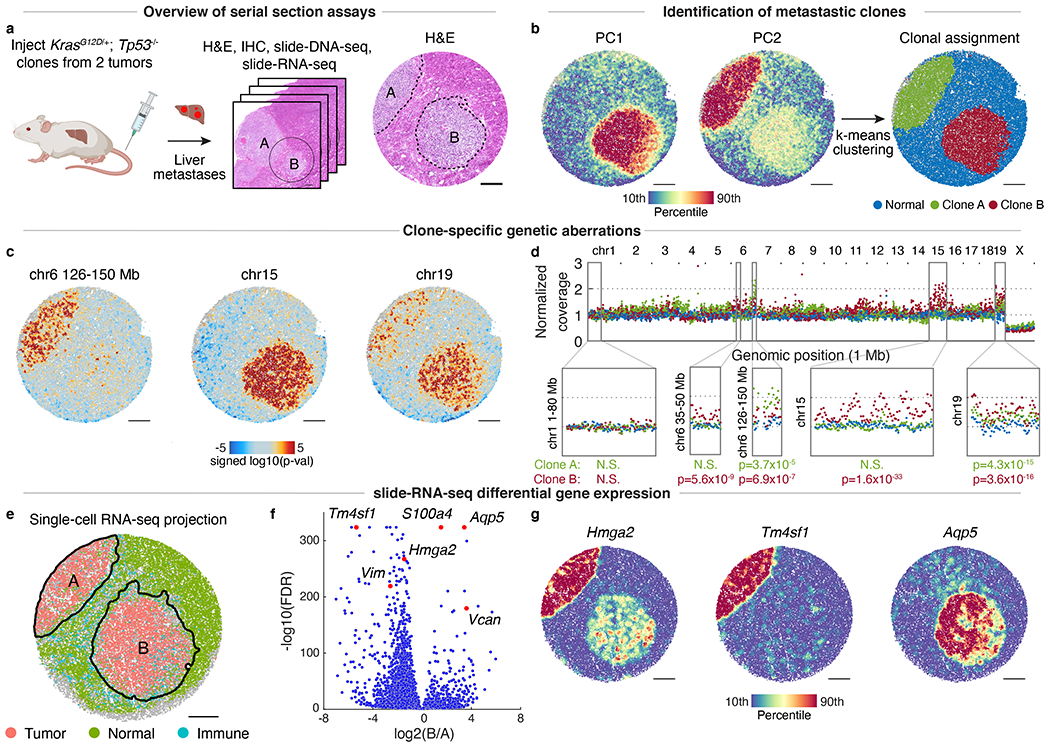
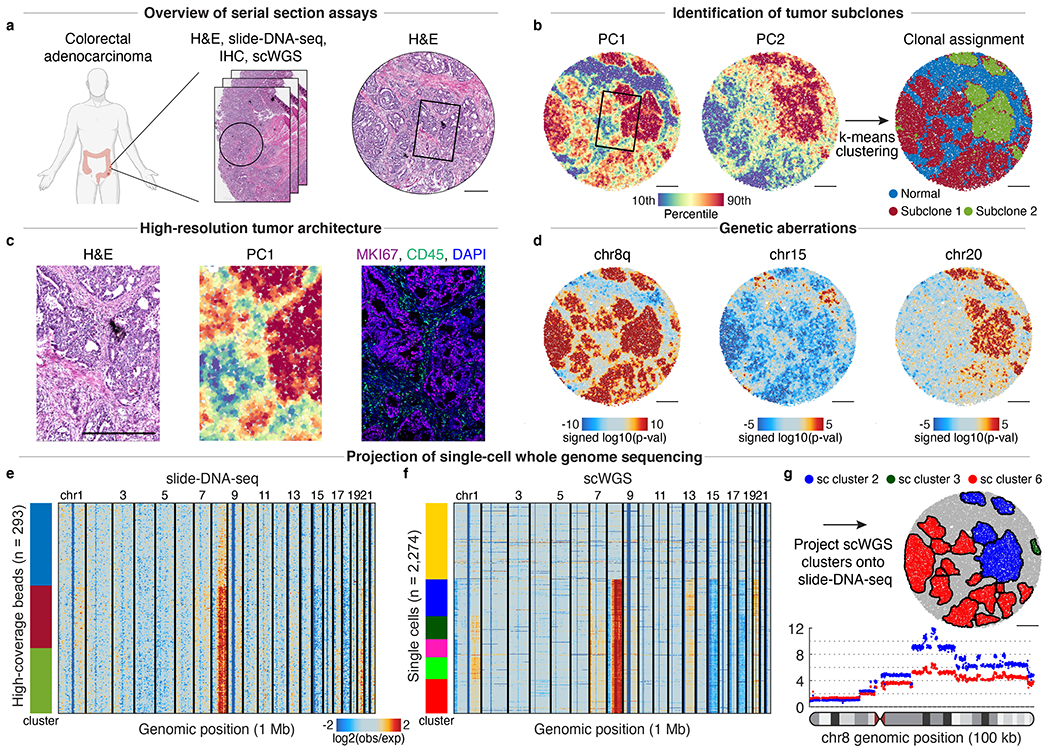
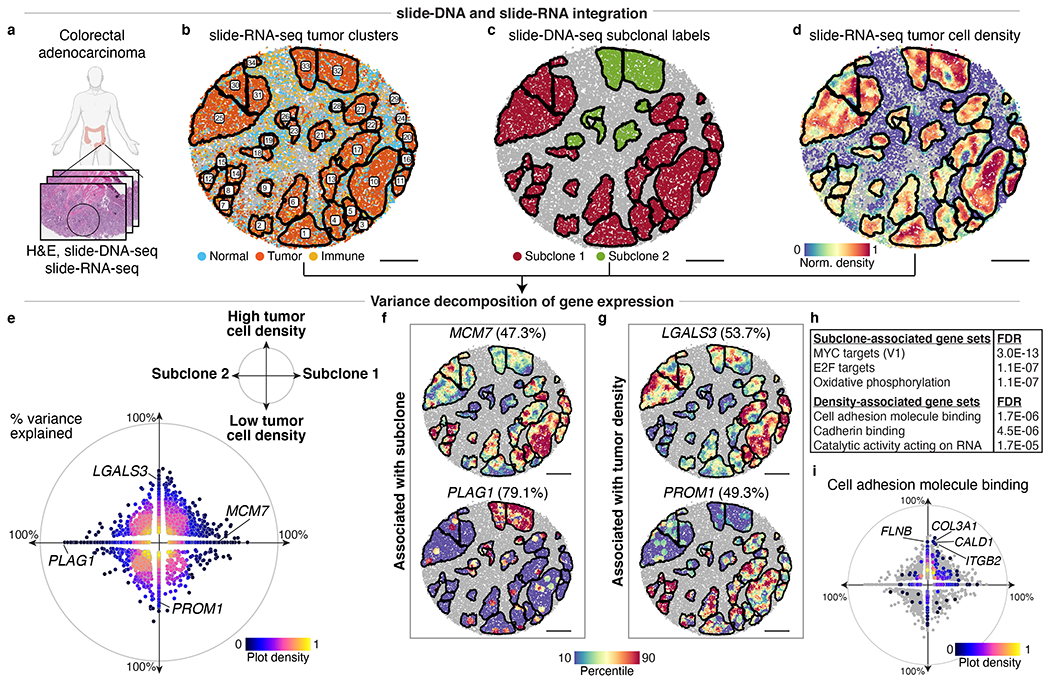
The state and behaviour of a cell can be influenced by both genetic and environmental factors. In particular, tumour progression is determined by underlying genetic aberrations1-4 as well as the makeup of the tumour microenvironment5,6. Quantifying the contributions of these factors requires new technologies that can accurately measure the spatial location of genomic sequence together with phenotypic readouts. Here we developed slide-DNA-seq, a method for capturing spatially resolved DNA sequences from intact tissue sections. We demonstrate that this method accurately preserves local tumour architecture and enables the de novo discovery of distinct tumour clones and their copy number alterations. We then apply slide-DNA-seq to a mouse model of metastasis and a primary human cancer, revealing that clonal populations are confined to distinct spatial regions. Moreover, through integration with spatial transcriptomics, we uncover distinct sets of genes that are associated with clone-specific genetic aberrations, the local tumour microenvironment, or both. Together, this multi-modal spatial genomics approach provides a versatile platform for quantifying how cell-intrinsic and cell-extrinsic factors contribute to gene expression, protein abundance and other cellular phenotypes.


Figures

Extended Data Figure 1:
Extended Data Figure 1:. Optimization of slide-DNA-seq protocol.
a, Library preparation steps. b-e, Library size comparisons for live vs fixed tissue (b); histone extraction protocols (c-d); and varying lengths of a bridge oligo used to connect the barcoded bead oligo to genomic fragments e, either hybridized after tagmentation (left bar) or pre-loaded onto the Tn5 transposase prior to tagmentation (rest). All values are normalized to control condition (first column). f, Rate of ligation of genomic fragments to barcoded oligo either ordered in solution from IDT (left) or cleaved off from beads (center, right). g-j, Frequency of Tn5 insertions in the genome relative to the nearest transcription start site (TSS) for slide-DNA-seq of mouse cerebellum (g), mouse liver metastases (h), human colon tumor (i), and for single-cell ATAC-seq of a mouse brain (j). Error bars, mean ± s.d; n, number of replicate comparisons (generated from 4 biological samples); dots represent values of each replicate.
Extended Data Figure 2:
Extended Data Figure 2:. Comparison of fixation conditions during histone extraction.
Cerebellar sections are exposed to treatment as stated (with or without prior fixation) and stained with DAPI. Scale bars, 500 μm.
Extended Data Figure 3:
Extended Data Figure 3:. Quantification of DNA fragments per slide-DNA-seq array.
a, Nuclear (left) and mitochondrial (center) DNA fragments per bead obtained for tissues used in this study. Right, mitochondrial fraction of fragments. 4x, protocol variant with 4x tagmentation. Black lines on violin plots indicate the mean. b, slide-DNA-seq of the mouse cerebellum experiment in Fig. 1. Beads are colored by the number of nuclear fragments (left), mitochondrial DNA fragments (center), and fraction of mitochondrial DNA fragments (right). c, Visualization of representative convex hulls for different spatial bin values of k for k-nearest neighbor smoothing. Beads are colored by raw counts, insets show convex hulls for k = 1, 10, 25, and 50, centered on salmon colored beads. Hulls are generally circular except at the edge of the array. d, Distribution of mean fragments per 1 Mb genomic bin for different spatial bin values of k. The median diameter of the smoothed features is indicated in parentheses. e, Comparison of nuclear fragments (left) and effective diameter (right) per bead for different spatial bin values of k. Scale bars, 500 μm.
Extended Data Figure 4:
Extended Data Figure 4:. Estimation of slide-DNA-seq lateral diffusion.
a, Interpolated image showing the nuclear fraction of fragments of a 10 μm mouse cerebellar section processed for slide-DNA-seq. Cyan box indicates magnified area (right). Smaller boxes indicate regions taken for linescans in b and e. b, Pseudo-intensity (representing nuclear fraction of fragments) of linescan as indicated by red box in a. Black dots, halfmax. Full Width at Half Maximum (FWHM) = 57.3 μm. c, 10 μm serial section of the same mouse cerebellum stained with DAPI. Blue box indicates magnified area (right). Smaller boxes indicate regions taken for linescans in d and f. d, Linescan of DAPI intensity as indicated in c. Black dots, halfmax. FWHM = 16.4 μm. e, Same as b, but for 3 different regions as indicated by the smaller non-red boxes in a. For the left (green) and middle (yellow) panel, FWHM is calculated as twice the distance between the peak and the halfmax (marked by black dots). f, Same as d, but for 3 different regions as indicated by the smaller non-red boxes in b. For the left (green) and middle (yellow) panel, FWHM is calculated as twice the distance between the peak and the halfmax (marked by black dots). g, Bar graph of average FWHM (n=4 regions). Error bars, mean ± s.d. Upper bound for the diffusion measurement is half of largest FWHM (not taking into account the DAPI measurement). Scale bars, 500 μm (a, c), 200 μm (b, d).
Extended Data Figure 5:
Extended Data Figure 5:. Normalization of slide-DNA-seq sequencing biases.
a, Top, raw sequencing reads per 1 Mb bin for mouse cerebellum slide-DNA-seq are plotted for GC-content, mappability, replication timing score, and Tn5 bias. Pearson’s r values are shown for each. Bottom, bias corrected coverage and correlation values after normalization. b, Same as a but for tagmentation-based bulk sequencing of mouse cerebellum (Methods). c, Same as a but for slide-DNA seq of mouse liver metastases. d, Same as b but for tagmentation-based bulk sequencing of mouse liver metastases. Blue points, bins from chrX (not included in the calculation of the fit).
Extended Data Figure 6:
Extended Data Figure 6:. Quantification of genomic coverage in a diploid sample.
Left (all panels), copy number profiles at 1 Mb genomic resolution of the mouse cerebellum for the sequencing modality and processing indicated. For this diploid sample, each copy number distribution is normalized to a median of 2. Right (all panels), histogram of the number of bins per copy number. a, Raw coverage profile of slide-DNA-seq. b, Coverage profile of slide-DNA-seq normalized by GC-content and mappability. c, Coverage profile for bulk tagmentation-based sequencing. d, Coverage profile of bulk sequencing normalized by GC-content and mappability. e, Coverage profile of slide-DNA-seq normalized by the GC-content and mappability divided by bulk sequencing normalized by GC-content and mappability.
Extended Data Figure 7:
Extended Data Figure 7:. slide-DNA-seq clonal analysis workflow.
a, Principal components calculated from smoothed slide-DNA-seq beads, ordered by the percentage of variance explained for the mouse liver metastases array shown in Fig. 1. b, Weights per 1 Mb genomic bin for principal components 1 and 2. Red points indicate bins from chromosomes with an odd number, blue from chromosomes with an even number (and chrX). c, slide-DNA-seq array for the mouse liver metastases array shown in Fig. 1 with points colored by raw PC 1 scores (top left), smoothed PC 1 scores (top right), raw PC 2 scores (bottom left), smoothed PC 2 scores (bottom right). d, Calinski-Harabasz criterion values used to select the optimal value of k for k-means clustering. e, slide-DNA-seq array colored by cluster assignment using the value of k selected in d. f-j, Same as a-e, but for the mouse liver metastases array shown in Fig. 2.
Extended Data Figure 8:
Extended Data Figure 8:. Accuracy of clonal assignment via downsampling of bulk tumor cell lines.
a, Raw copy number profiles for four tumor cell lines profiled using tagmentation-based bulk sequencing. b, Representative 10,000 fragments samples of the cell lines shown in a. c, Clonal assignment accuracy for 10,000 fragment samples (n=5,000 samples of each cell line) using the analysis workflow shown in Extended Data Fig. 7. d, Same as c but for 1,000 fragment samples.
Extended Data Figure 9:
Extended Data Figure 9:. Reproducibility of slide-DNA-seq across serial sections.
a, Immunofluorescence (IF) against tumor marker HMGA2 (top) and two slide-DNA-seq replicates (center, bottom) were performed on two serial sections of a mouse liver metastasis. Beads colored by PC1 scores (left) and cluster assignment (right) show similar spatial architecture between replicates. Scale bars, 500 μm. b, Aggregate copy number profiles of normal and tumor beads show high correlation (Pearson’s r = 0.986 and 0.992) between the two replicates.
Extended Data Figure 10:
Extended Data Figure 10:. Quantification of genomic coverage by bin size and number of beads.
Each column represents normalized copy number profiles aggregated across the number of slide-DNA-seq beads indicated (10,000; 1,000; or 100), while each row indicates the genomic bin size (10 Mb, 5 Mb, 2.5 Mb, 1 Mb, and 500 kb) for the mouse cerebellum array.
Extended Data Figure 11:
Extended Data Figure 11:. Integrated slide-RNA-seq and single-nucleus RNA-seq analysis of clones.
a, H&E stain (left), IHC against tumor marker HMGA2 (center), and Hmga2 expression from slide-RNA-seq (right) of three serial sections of mouse liver metastases. b, UMAP of unsupervised clustering of single nucleus RNA-seq performed on nuclei from mouse liver metastasis sample. c, Dot plot showing the expression of marker genes used to annotate clusters in b. d, Spatial projection of cell types from b onto the slide-RNA-seq array, colored in the same fashion. Black lines indicate spatial tumor clusters. e, Differential localization of cell types between clone A, clone B and normal regions. Heatmap shows signed (positive, enrichment; negative, depletion) log10(p-value) from permutation testing (two-sided, not adjusted for multiple comparisons). f, Spatial plot of monocyte localization on the array, which is significantly enriched for clone B. Black lines indicate spatial tumor clusters. VSMC, vascular smooth muscle cell; LSEC, liver sinusoidal endothelial cells.
Extended Data Figure 12:
Extended Data Figure 12:. Validation of ploidy and copy number of metastatic clones.
a, Assignment of beads to normal tissue, clone A, and clone B based on k-means clustering. b-d, Histogram of DNA content of single cells measured by propidium iodide (PI) fluorescence intensity through flow cytometry. (b) bone marrow cells (normal control); (c) clone A; (d) clone B. Diploid G1 (2N) and G2 (4N) gates are determined on bone marrow histogram and applied to clones A and B, revealing that the clone A genome is triploid; and the clone B genome is diploid with some amplifications (e.g. of chr. 15 and 19, see Fig. 2d). e, Aggregate copy number profiles of beads assigned to clone A. f, Aggregate copy number profiles of beads assigned to clone B.
Extended Data Figure 13:
Extended Data Figure 13:. Spatial projection of single-cell whole-genome sequencing (scWGS) clusters.
a, Genomic copy number profiles for 2,274 single cells obtained using scWGS, with cluster annotations colored. b, Top left: projection of scWGS clusters onto slide-DNA-seq. All other: three genomic regions of differential CNA profiles between the three projected clusters, shown are spatial heatmaps of signed p-value differences from the average profile (two-sided permutation test, not adjusted for multiple comparisons). c, Normalized copy number profiles for the three scWGS clusters, and the corresponding spatial clusters. Vertical lines denote variable regions from b. Single-cell cluster 2 (blue) shows complex CNA patterns that obscure cluster ploidy, nevertheless, copy number values are normalized to 2 for easy comparison to other clusters.
Extended Data Figure 14:
Extended Data Figure 14:. Tumor morphology of primary human colon cancer sample.
a, H&E stain of normal colon (left) and colon tumor (right) tissue from the same patient. Scale bars, 200 μm. b, Serial sections processed for H&E stain (left), slide-DNA-seq (center), and slide-RNA-seq (right). Scale bars, 500 μm. Yellow and black boxes indicate magnified areas in c and d, respectively. c, Magnified views of H&E stain, slide-DNA-seq and slide-RNA-seq reconstructions show concordant spatial tissue architecture across three modalities; scale bar, 200 μm. d, Magnified view of H&E stain of three regions that are assigned low, medium, and high tumor density by slide-RNA-seq transcriptomic analysis (b, right). Arrows indicate regions of high tumor density identified through H&E stain. Scale bar, 100 μm.
Extended Data Figure 15:
Extended Data Figure 15:. Biological pathways explained by subclone or tumor density.
a, Subclone-associated pathways identified through gene set enrichment analysis. b, Hallmark E2F target genes (n=200) plotted according to percent variance explained by clonal identity (x-axis) and tumor density (y-axis). Included genes colored by normalized density on the scatter plot, all other genes are shown in grey. c, Expression of highly subclone-associated E2F target genes (n=11, listed in a), plotted for spatial tumor regions of the slide-RNA-seq array from Fig. 4. d, MYC target genes (n=200) plotted according to percent variance explained by clonal identity (x-axis) and tumor density (y-axis). Included genes are colored by normalized density on the scatter plot, MYC is colored red, all other genes are shown in grey. e, Expression of highly subclone-associated MYC target genes (n=16, listed in a), plotted for spatial tumor regions (left). Box plot showing normalized MYC target gene expression by subclone assignment; each point represents a spatial tumor cluster (right). Red line, mean, red box, 95% confidence interval for mean, blue box, standard deviation. f, MYC expression plotted for spatial tumor regions (left). Scatter plot showing normalized MYC expression by tumor cell density; each point represents a spatial tumor cluster (right). g, Subclone-associated pathways identified through gene set enrichment analysis. h, Cell adhesion molecule binding genes (n=514) plotted according to percent variance explained by clonal identity (x-axis) and tumor density (y-axis). Included genes are colored by normalized density on the scatter plot, all other genes are shown in grey (reproduced from Fig. 4i). i, Expression of highly density-associated cell adhesion molecule binding genes (n=14, listed in g), plotted for spatial tumor regions. Scale bars, 500 μm.
Fig. 1:
Fig. 1:. slide-DNA-seq enables spatially-resolved DNA sequencing.
a, Schematic of in situ bead indexing. Array of randomly-deposited beads is spatially indexed through in situ sequencing of DNA barcodes. Fresh-frozen tissue is cryosectioned onto array. b, Schematic of slide-DNA-seq library construction. Genomic DNA is transposed with Tn5. Hybridization of a bridge oligo allows ligation of photocleaved, spatially-indexed bead oligos to genomic fragments. ME, mosaic ends; BC, barcode; R1, Illumina read 1; R2, Illumina read 2. c, DAPI stained cryosection of a mouse cerebellum. Red circle indicates approximate region shown in d and e. d, slide-DNA-seq of a cerebellar section with beads colored by percentage of fragments aligned to mitochondrial genome. e, Serial section to d stained with DAPI and antibody against mitochondrial protein TOMM20. f, Normalized copy number per 1 Mb genomic bin for aggregated beads from d. g, Serial sections from KrasG12D/+; Tp53−/− liver metastases were processed for H&E staining (center, circle indicates region analyzed; right, dotted lines indicate tumor boundary), slide-DNA-seq (h), and IF against HMGA2 (i). h, slide-DNA-seq of mouse liver section with beads colored by principal component 1 scores (PC1). For visualization, scores for each bead are smoothed by 50 PC neighbors and 10 spatial neighbors (36 μm diameter). i, Serial section to h stained with DAPI and antibody against tumor marker HMGA2 . j, Normalized copy number per 1 Mb genomic bin for aggregated normal and tumor beads from liver section from h. Scale bars, 500 μm. Grey beads shown for spatial context but excluded from analysis.
Fig. 2:
Fig. 2:. Paired slide-DNA-seq and slide-RNA-seq characterize the genetics and transcriptomes of distinct metastatic clones.
a, Serial sections from KrasG12D/+; Trp53−/− liver metastases were processed for H&E staining (center, circle indicates region analyzed; right, dotted lines indicate tumor boundaries), immunohistochemistry (IHC, Extended Data Fig. 5), slide-DNA-seq (b-d), and slide-RNA-seq (e-g). b, Principal components 1 (left) and 2 (middle) of slide-DNA-seq genomic coverage. Beads clustered using k-means (k=3) and annotated as normal, clone A, or clone B (right). c, Genomic region enrichment signed p-values for chromosomes 6 (126-150 Mb), 15, and 19 (two-sided permutation test, not adjusted for multiple comparisons). Amplifications, red; deletions, blue. d, Genomic coverage profiles of aggregate normal (blue), clone A (green), and clone B (red) beads from b. Genomic coverage normalized to 1 to compare profiles of different ploidy (Extended Data Fig. 12). p-values calculated using two-sided Wilcoxon Rank Sum test to compare clone and normal coverage. e, slide-RNA-seq of mouse liver serial section colored by tumor, normal and immune cell classes as assigned from single-cell projection. Detailed cell type labels in Extended Data Fig. 13. f, Differentially-expressed genes between clones A and B. Genes shown in g or referred to in text are labeled and colored in red. g, Normalized expression of select genes from f. Scale bars, 500 μm. Grey beads shown for spatial context but excluded from analysis.
Fig. 3:
Fig. 3:. De novo identification of spatial tumor clones in primary human colorectal cancer.
a, Serial sections of primary human colorectal tumor were processed for H&E staining (right, c), slide-DNA-seq (b-e), and multiplexed IHC (c); single-cell whole-genome sequencing (scWGS) was performed on the same sample (f-g). b, Principal components 1 (left) and 2 (middle) of slide-DNA-seq genomic coverage. Beads clustered using k-means (k=3) and annotated as normal, subclone 1, or subclone 2 (right). c, Magnified view of boxed regions in a-b. Right, serial section stained with antibodies against MKI67 , CD45 , and DAPI. d, Genomic region enrichment signed p-values for chromosomes 8q, 15, and 20 (two-sided permutation test, not adjusted for multiple comparisons). e, Copy number profiles for 293 high-coverage slide-DNA-seq beads. f, Copy number profiles for 2,274 single cells profiled via scWGS. Profiles within each cluster are ordered by PC1 score in e-f. g, Matched single-cell clusters projected onto slide-DNA-seq array (top). Genomic coverage of chromosome 8 at 100 kb resolution for single-cell clusters 2 and 6 (bottom). Scale bars, 500 μm. Amplifications, red; deletions, blue in d-f. Grey beads shown for spatial context but excluded from analysis.
Fig. 4:
Fig. 4:. Decomposition of transcriptional programs driven by genetic aberrations and tumor density.
a, Serial sections from nearby region of human colorectal tumor from Fig. 3 were processed for H&E staining, slide-DNA-seq (Extended Data Fig. 14), and slide-RNA-seq (b-j) b, slide-RNA-seq of colon tumor section with beads colored by assignment to normal, tumor, or immune clusters. Black lines denote boundaries of spatially-distinct tumor regions. c, Subclone labels for spatial tumor regions (defined via co-registration with slide-DNA-seq serial section) plotted on slide-RNA-seq array from b. d, Tumor density plotted on slide-RNA-seq array from b. e, Genes plotted by percent variance explained by subclone (x-axis) and/or tumor density (y-axis), colored by plot density (n=2,148, stepwise regression, p<0.05). f, Top subclone-associated genes, with expression plotted for spatial tumor regions. g, Same as f but for top density-associated genes. h, Select gene sets significantly associated with either subclone or tumor density. i, Cell adhesion molecule binding genes (n=544) plotted by percent variance explained by subclone (x-axis) and tumor density (y-axis), colored by plot density. All other genes from e shown in grey. Scale bars, 500 μm. Grey beads shown for spatial context but excluded from analysis.

Comment in

References

    1. McGranahan N & Swanton C Clonal Heterogeneity and Tumor Evolution: Past, Present, and the Future. Cell 168, 613–628 (2017). - PubMed
    1. Turajlic S, Sottoriva A, Graham T & Swanton C Resolving genetic heterogeneity in cancer. Nat. Rev. Genet 20, 404–416 (2019). - PubMed
    1. Ramón y Cajal S et al. Clinical implications of intratumor heterogeneity: challenges and opportunities. J. Mol. Med 98, 161–177 (2020). - PMC - PubMed
    1. Pogrebniak KL & Curtis C Harnessing Tumor Evolution to Circumvent Resistance. Trends Genet. 34, 639–651 (2018). - PMC - PubMed
    1. Duan Q, Zhang H, Zheng J & Zhang L Turning Cold into Hot: Firing up the Tumor Microenvironment. Trends Cancer Res. 6, 605–618 (2020). - PubMed

Publication types