. 2022 Jan;601(7891):98-104.
doi: 10.1038/s41586-021-04191-x. Epub 2021 Dec 15.

Transforming representations of movement from body- to world-centric space

Affiliations

Transforming representations of movement from body- to world-centric space

Jenny Lu et al. Nature. 2022 Jan.

Abstract

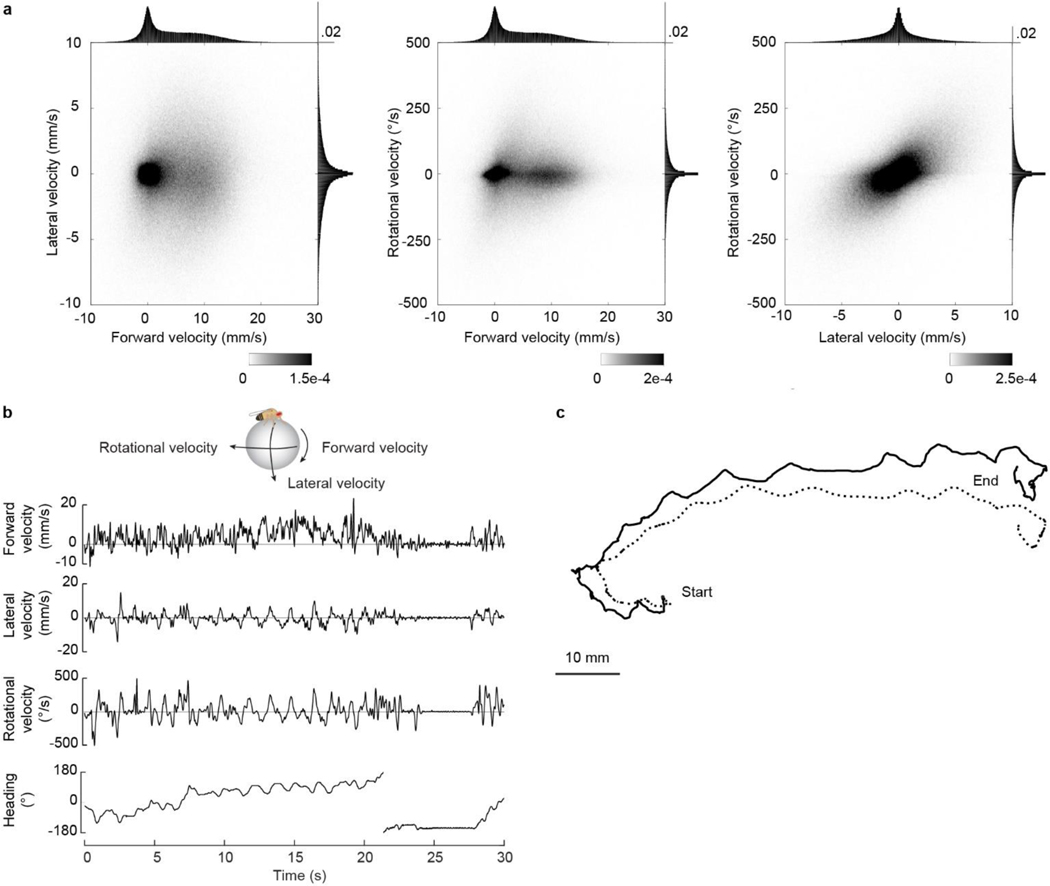
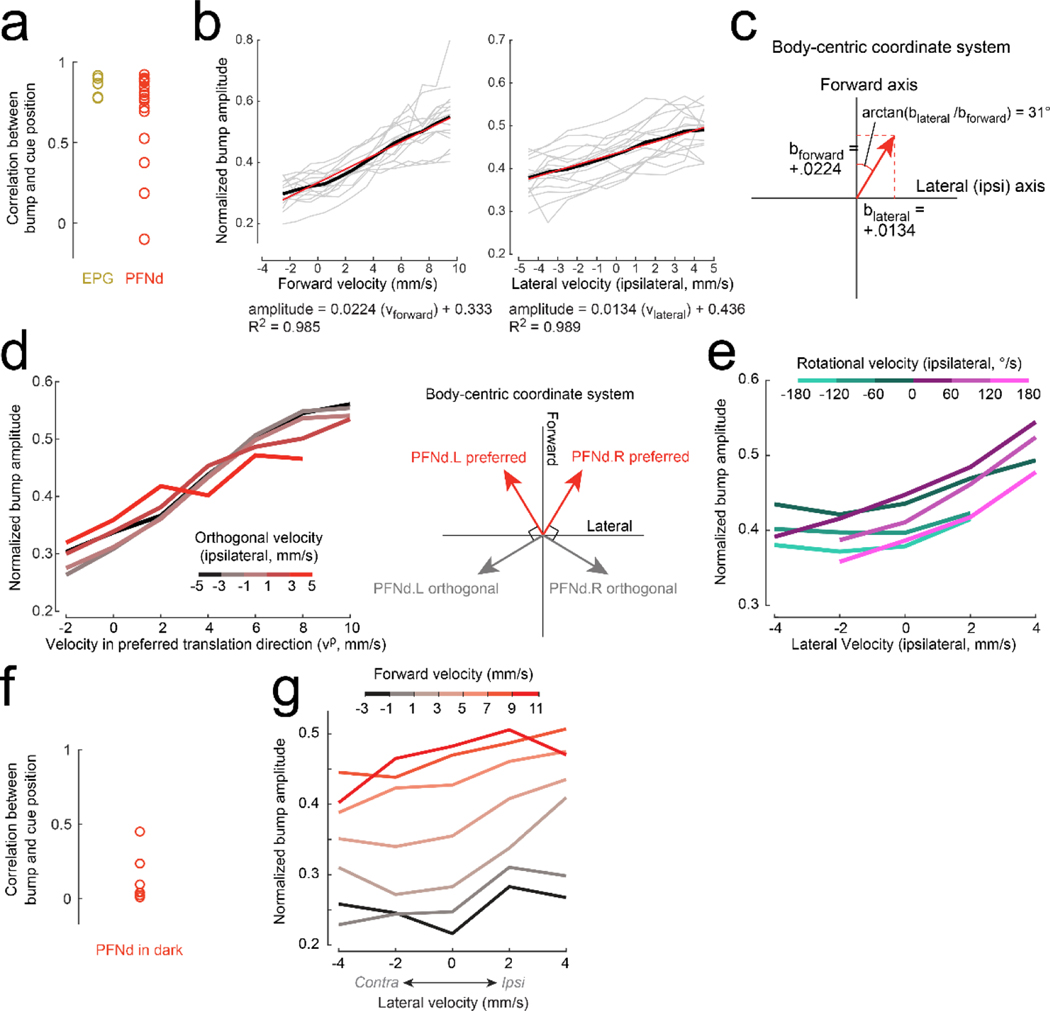
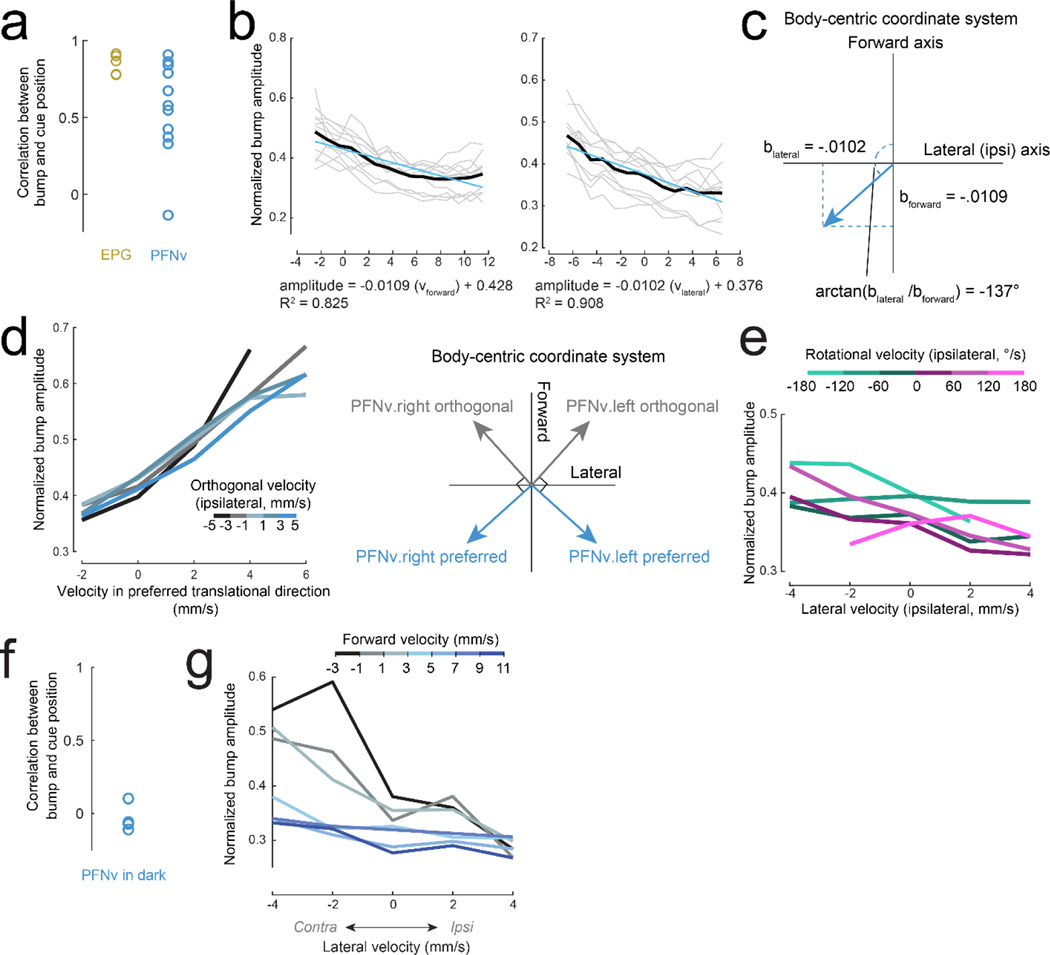
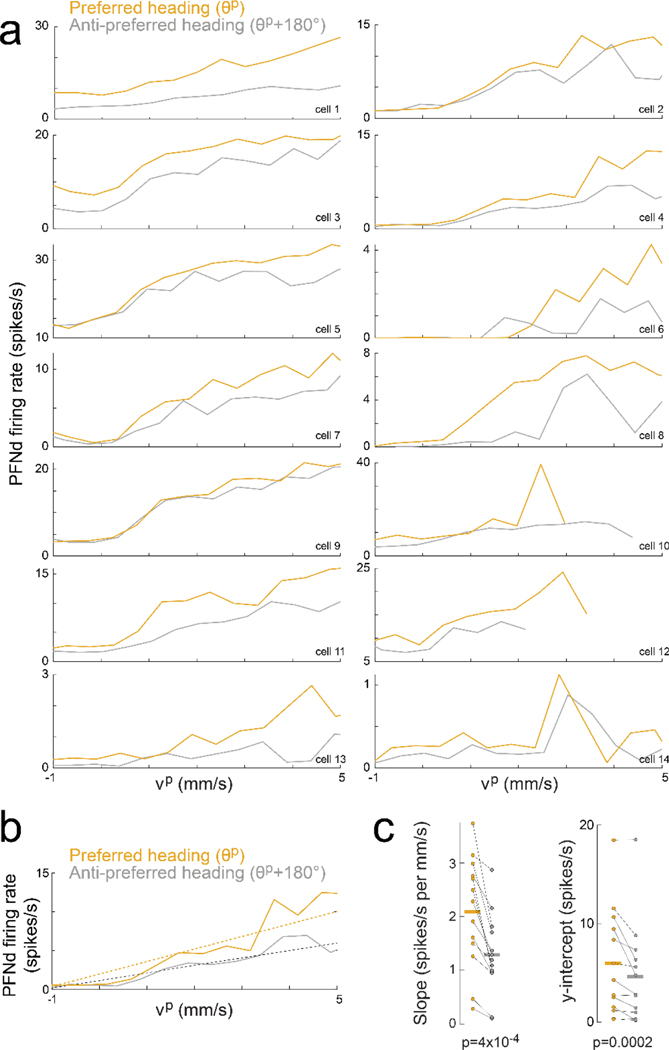
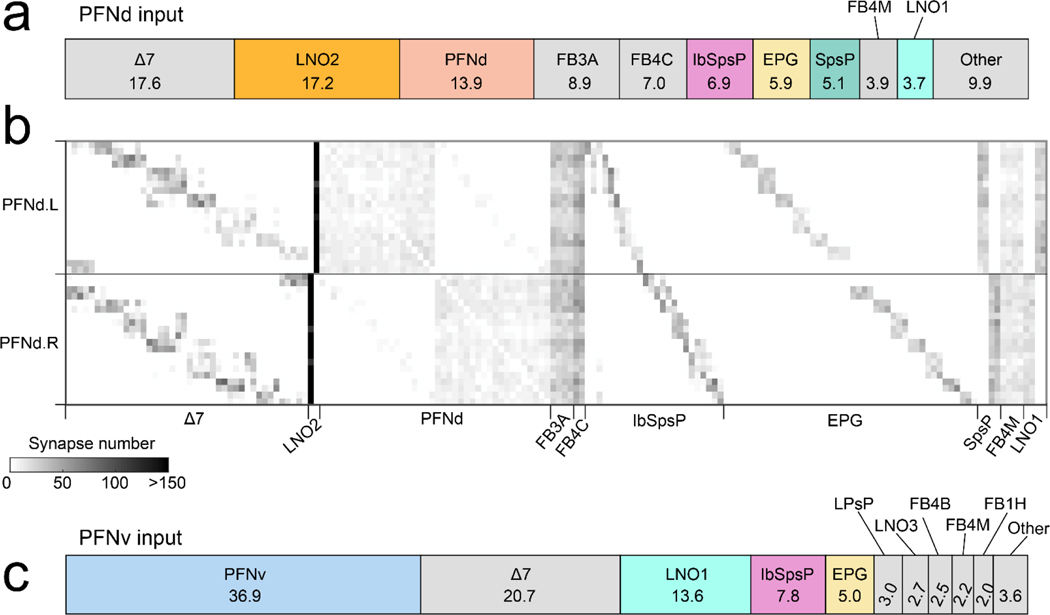
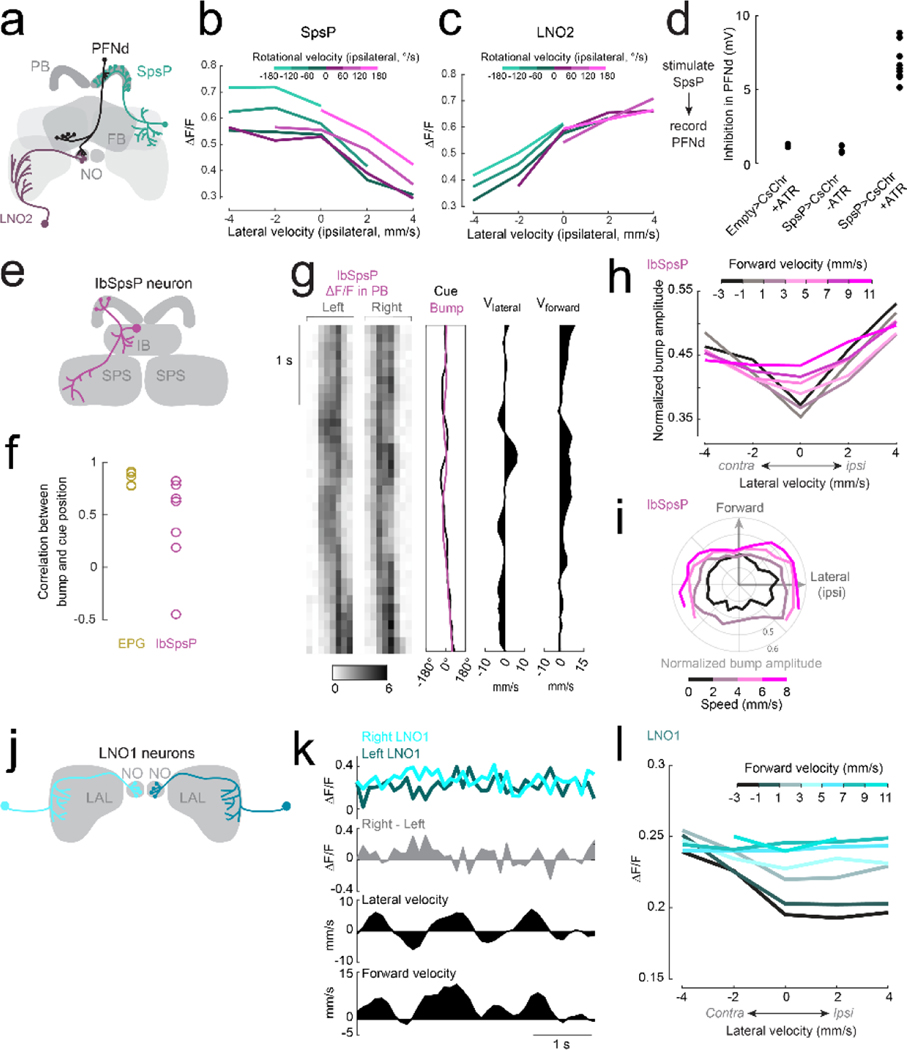
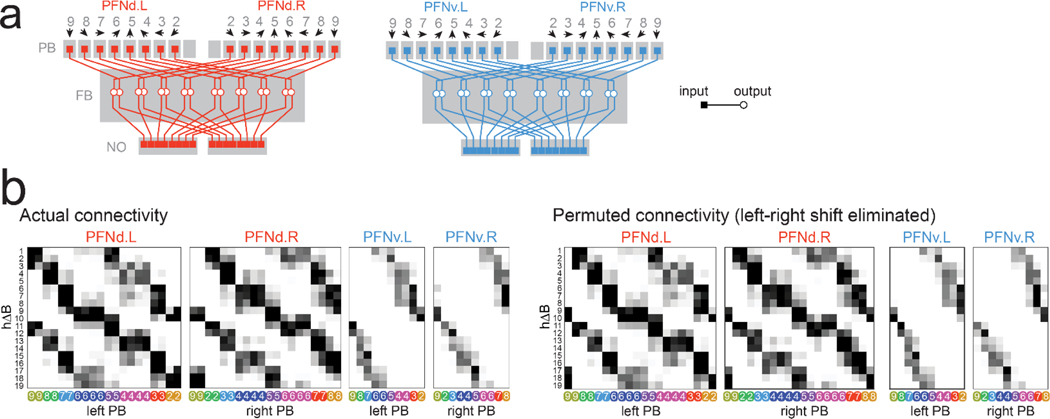
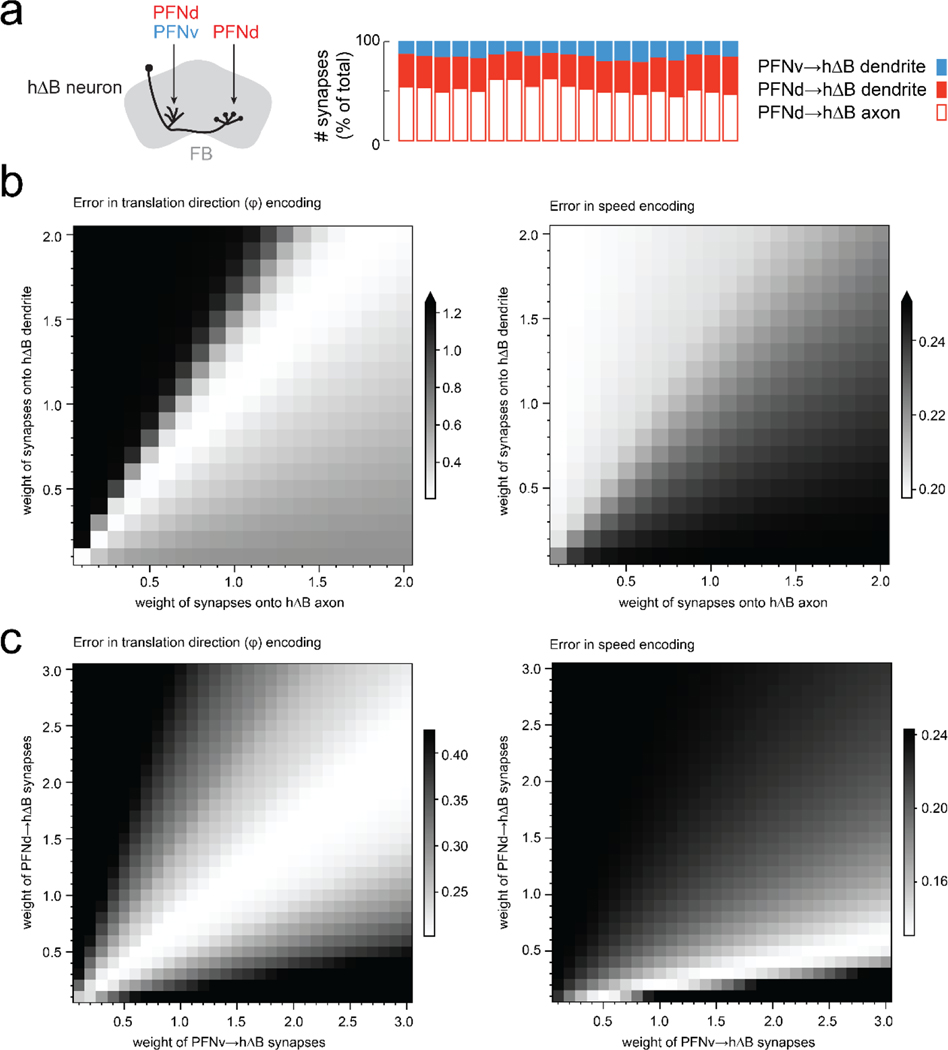
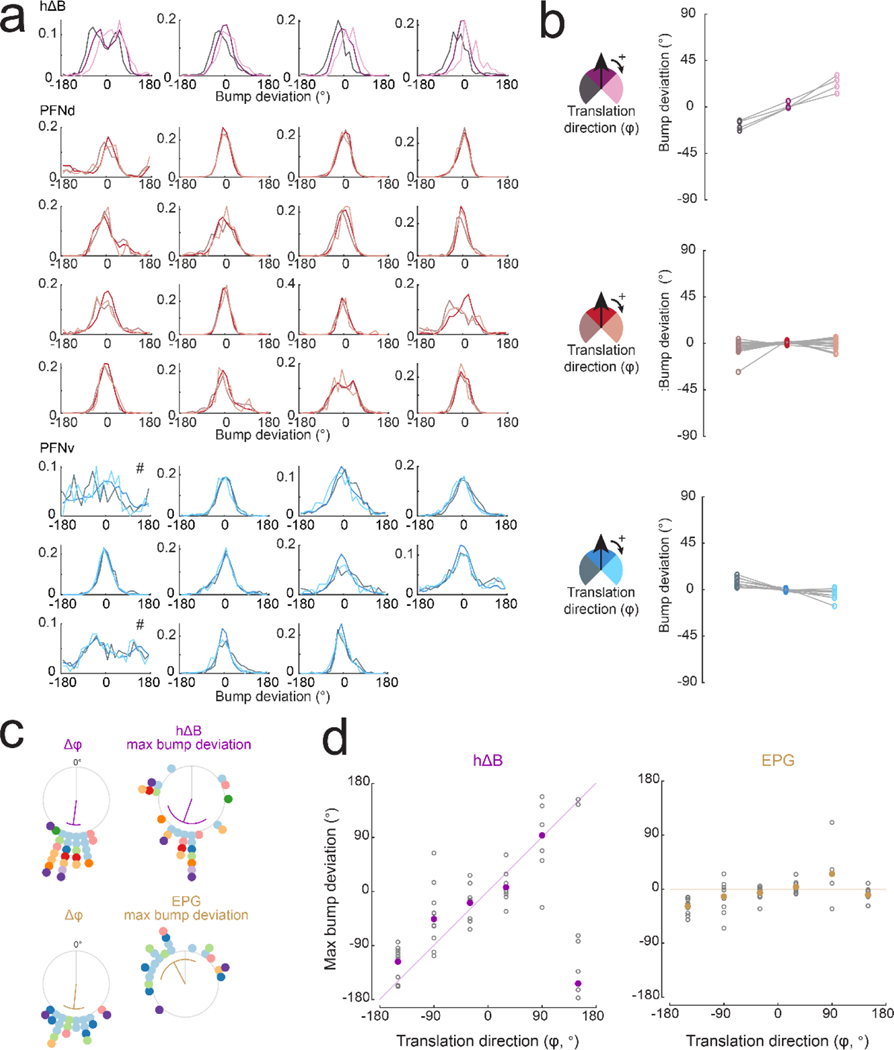
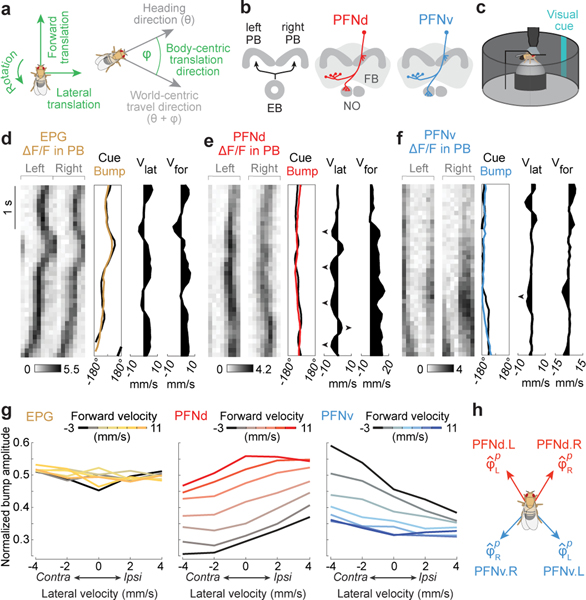
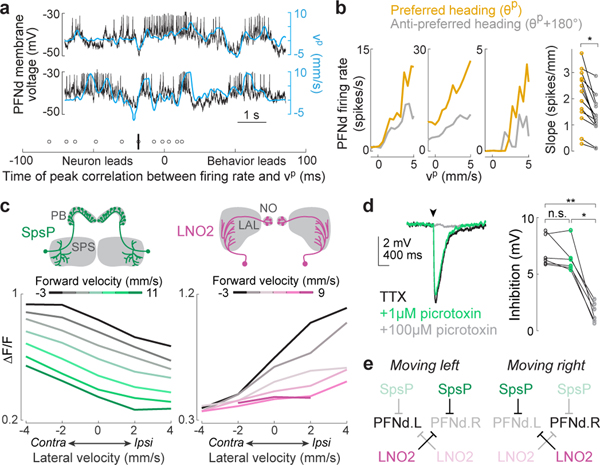
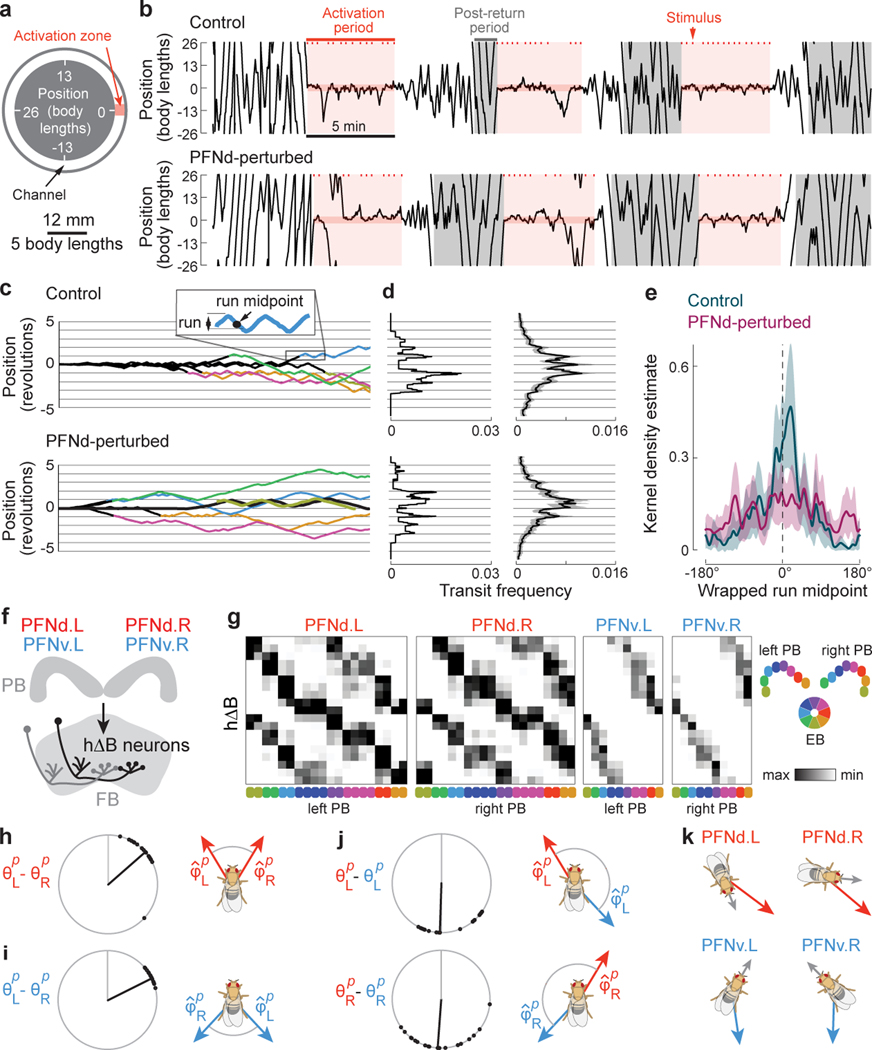
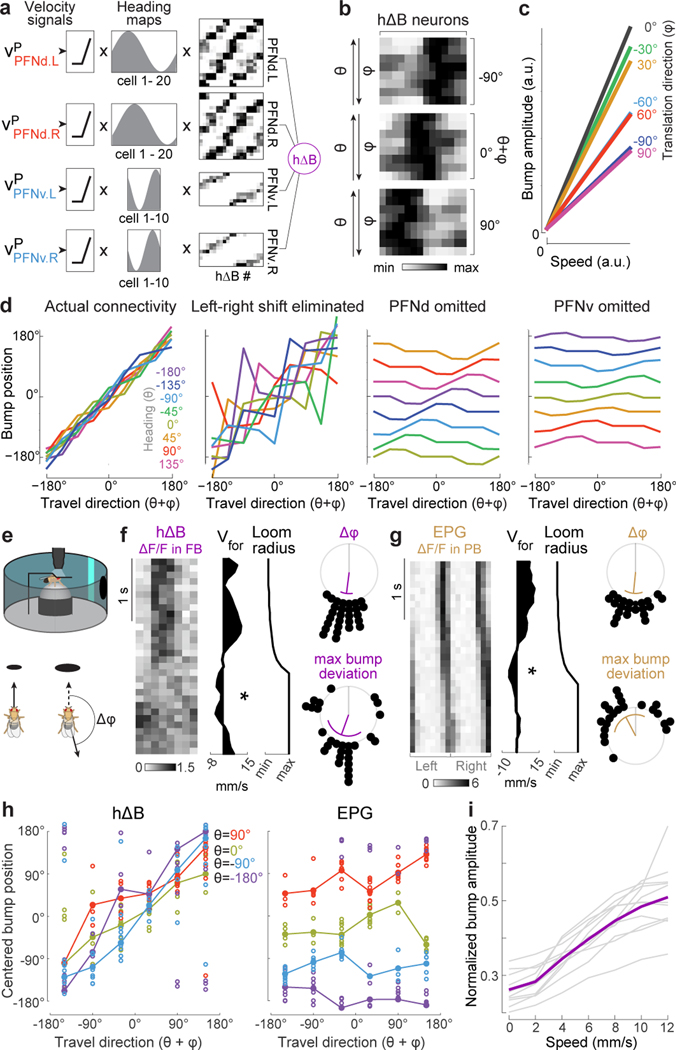
When an animal moves through the world, its brain receives a stream of information about the body's translational velocity from motor commands and sensory feedback signals. These incoming signals are referenced to the body, but ultimately, they must be transformed into world-centric coordinates for navigation1,2. Here we show that this computation occurs in the fan-shaped body in the brain of Drosophila melanogaster. We identify two cell types, PFNd and PFNv3-5, that conjunctively encode translational velocity and heading as a fly walks. In these cells, velocity signals are acquired from locomotor brain regions6 and are multiplied with heading signals from the compass system. PFNd neurons prefer forward-ipsilateral movement, whereas PFNv neurons prefer backward-contralateral movement, and perturbing PFNd neurons disrupts idiothetic path integration in walking flies7. Downstream, PFNd and PFNv neurons converge onto hΔB neurons, with a connectivity pattern that pools together heading and translation direction combinations corresponding to the same movement in world-centric space. This network motif effectively performs a rotation of the brain's representation of body-centric translational velocity according to the current heading direction. Consistent with our predictions, we observe that hΔB neurons form a representation of translational velocity in world-centric coordinates. By integrating this representation over time, it should be possible for the brain to form a working memory of the path travelled through the environment8-10.


Conflict of interest statement

Declaration of competing interests: The authors declare no competing interests.

Figures

Extended Data Figure 1:
Extended Data Figure 1:. Walking statistics on a spherical treadmill.
a. Distribution of forward × lateral, forward × rotational, and lateral × rotational velocities. Shown along each axis is the marginal distribution (gray lines on top right of each heatmap denote scale for the marginal distribution). Data are pooled across n=27 flies. We used the velocities recorded at the camera sampling rate (50 Hz) prior to down-sampling to volumetric calcium imaging rate. b. An example walking bout (30 seconds). Shown are the fly’s forward, lateral, and rotational velocity as well as its heading (based on the position of the visual cue shown in closed loop; note that we used a visual closed loop gain of 0.8×, meaning that the landmark is displaced by an azimuthal angle equal to 0.8× the ball’s yaw displacement). c. Fictive trajectory of the fly in 2D space based on the walking parameters in the example bout shown in b. The dotted line shows the calculated trajectory using only the forward velocity and the heading of the fly, ignoring the lateral velocity. The solid line shows the calculated trajectory using the forward velocity, lateral velocity, and heading of the fly. Note that the dotted line underestimates the curvature of the fly’s path.
Extended Data Figure 2:
Extended Data Figure 2:. PFNd tuning properties.
a. Circular correlation between bump and cue position for PFNd (n=16 flies) and EPG neurons (n=5 flies). Note that PFNd bump position is not as correlated with heading as EPG activity is. This is because PFNd neurons conjunctively encode velocity and heading, whereas EPG neurons encode only heading. For example, when the fly walks forward right, the PFNd bump on the left diminishes in amplitude, and vice versa. When the left and right bumps have different amplitudes, this diminishes the accuracy of our estimate of the bump position. Moreover, when the fly steps backward, both PFNd bumps diminish in amplitude, which again makes it difficult to accurately estimate bump position. b. Normalized PFNd PB bump amplitude versus forward velocity (left), and lateral velocity (right). Gray lines are individual flies and the black line is the mean across flies (n=16 flies). Data from the right and left PB are combined, and lateral velocity is computed in the ipsilateral direction (so that, for PFNd.L neurons, leftward lateral velocity is positive and rightward lateral velocity is negative). The red line shows the linear fit to the mean line, with the fitted equation below each plot. c. Computation of preferred translational direction angle using the linear regression slopes for forward and lateral velocity. We used the ratio of the slopes of the linear fits to lateral and forward velocity to calculate the angle of preferred translational direction. d. PFNd data from Fig. 1g, re-plotted in polar coordinates. Here, normalized bump amplitude is displayed as a function of body-centric translation direction and binned by speed. e. Normalized PFNd bump amplitude versus velocity in the preferred translational direction (vp). Data from the right and left PB are combined and binned by the fly’s velocity orthogonal to the preferred translational direction (see schematic at right). Shown is the mean across flies (n=16 flies). Note that a positive value in the orthogonal axis is in the ipsilateral direction. Whereas there is a significant effect of velocity in the preferred direction (2-way ANCOVA, P<10−10), there is no significant effect of velocity in the orthogonal direction (p=0.97). f. Normalized PFNd bump amplitude versus lateral velocity in the ipsilateral direction. Data from the right and left PB are combined, binned by ipsilateral rotational velocity, and averaged across flies (n=16 flies). Whereas there is a significant effect of lateral velocity (2-way ANCOVA, P<10−10), there is no significant effect of rotational velocity (p=0.59). This analysis shows that there is little or no systematic relationship between PFNd activity and rotational velocity once we account for the effect of lateral velocity. Note that, because rotational and lateral velocity are correlated, rotational velocity bins are asymmetrically populated. g. Circular correlation between bump and cue position for PFNd neurons when the fly walks in darkness (n=7 flies). h. Normalized bump amplitude versus lateral velocity in the ipsilateral direction, binned and color-coded by forward velocity, for PFNd neurons when the fly walks in darkness (n=7 flies). Lateral velocity is measured in the ipsilateral direction, and data from the right and left PB are combined and then averaged across flies. Both forward and lateral velocity have a significant effect (2-way ANCOVA, P<10−10 and P<10−5).
Extended Data Figure 3:
Extended Data Figure 3:. PFNv tuning properties.
a. Circular correlation between bump and cue position for EPG (n=5 flies, reproduced from Extended Data Fig. 2a) and PFNv neurons (n=11 flies). Note that PFNv bump position is not as correlated with heading as EPG activity is. This is because PFNv neurons conjunctively encode velocity and heading, whereas EPG neurons encode only heading. In particular, PFNv bump amplitude is generally quite low when the fly is walking forward. b. Normalized PFNv PB bump amplitude versus forward velocity (left), and lateral velocity (right). Gray lines correspond to individual flies and the black line corresponds to the mean across flies (n=11 flies). Data for the right and left PB are combined, and lateral velocity is computed in the ipsilateral direction. The blue line shows the linear fit to the mean line, with the fitted equation below each plot. c. Computation of preferred translational direction angle using the linear regression slopes for forward and lateral velocity. We used the ratio of the slopes of the linear fits to lateral and forward velocity to calculate the angle of preferred translational direction. d. PFNv data from Fig. 1g, re-plotted in polar coordinates. Here, normalized bump amplitude is displayed as a function of body-centric translation direction and binned by speed. e. Normalized PFNv bump amplitude versus velocity along the angle of preferred translational direction (vp). Data are combined between the right and left PB and binned by the velocity along the angle of translational movement orthogonal to the preferred direction (see schematic at right). Shown is the mean across flies (n=11 flies). The orthogonal directions for the right and left PFNv population are shown (right); note that a positive value in the orthogonal axis remains in the contralateral direction for the given right/left population. Whereas there is a significant effect of velocity in the preferred direction (2-way ANCOVA, P<10−10), there is no significant effect of velocity in the orthogonal direction (p=0.30). f. Normalized PFNv bump amplitude versus lateral velocity in the ipsilateral direction. Data for the right and left PB are combined, binned by the ipsilateral rotational velocity, and averaged across flies (n=11 flies). For this cell type, both lateral and rotational velocity have significant effects (2-way ANCOVA, P<10−10 and P<0.005). Note that, because rotational and lateral velocity is correlated, rotational velocity bins are asymmetrically populated. g. Circular correlation between bump and cue position for PFNv neurons when the fly walks in darkness (n=4 flies). h. Normalized bump amplitude versus lateral velocity in the ipsilateral direction, binned and color-coded by forward velocity, for PFNv neurons when the fly walks in darkness (n=4 flies). Lateral velocity is measured in the ipsilateral direction, and data from the right and left PB are combined and then averaged across flies. Both forward and lateral velocity have a significant effect (2-way ANCOVA, p<10−7 for each factor).
Extended Data Figure 4:
Extended Data Figure 4:. Interaction between heading and velocity tuning in PFNd neurons.
a. Firing rate versus vp for all PFNd recordings. Data are divided into bins based on the proximity of the fly’s heading to the neuron’s preferred heading. Three of these cells are shown in Fig. 2b. b. Linear fits for one example cell. c. Fitted slope values (reproduced from Fig. 2b) and y-intercept values for all cells (n=14 cells in 9 flies). Horizontal lines indicate mean values. For both parameters, there is a statistically significant effect of heading (2-way paired t-tests, Bonferroni-corrected p values). However, the effect of heading on the slope is relatively large and consistent, as compared to the effect on the y-intercept, which is smaller and less consistent. This implies that the effect of heading (θ) on the cell’s firing rate (f) is largely multiplicative, i.e., it controls the slope of the relationship between f and vp, as in f ∝ (cos(θθp) + a) vp + b where θp, a, and b are constants. In our computational model (Fig. 4a-d), we use this same relationship, with θp=0, a=1, b=0.
Extended Data Figure 5:
Extended Data Figure 5:. Connectomics analysis of inputs to PFNd and PFNv neurons.
a. Distribution of input synapses onto PFNd neurons from the hemibrain connectome, grouped by cell type. Shown are the top ten cell type inputs onto PFNd neurons; all other identified cell types are grouped into “Other.” Collectively, the distribution shown comprises 94.2% of all input synapses onto PFNd neurons. Numbers indicate the percentage of synapses contributed by each input cell type. Note that Δ7 neurons and FB3A/4C/4M neurons are major inputs to PFNd neurons, but we did not screen these neurons as part of our search for the origin of body-centric velocity signals in PFNd neurons, for the following reasons: Δ7 neurons: Δ7 population activity is known to encode the fly’s heading direction, reflecting the strong input to Δ7 neurons from EPG neurons. It has been proposed that the function of Δ7 neurons is to reshape the heading bump into a cosine-shaped activity profile,. Thus, much of the “compass input” that we refer to in our study as originating from EPG neurons is probably due to the combined action of EPG neurons (which constitute the primary computational map of the compass system) and Δ7 neurons (which reshape and reinforce the compass system output). FB3A/4C/4M neurons: These neurons are FB tangential cells, meaning their axons run across the entire horizontal extent of the FB, perpendicular to PFNd dendrites. Like other FB tangential cells, these neurons receive input from outside the central complex and they synapse onto a variety of cell types in the FB. There is evidence that FB tangential cells encode information about context, behavioral state, and internal physiological needs, including the need for sleep. b. Input connectivity matrix for PFNd neurons, shown for the top ten input cell types. Connections comprising 3 or fewer synapses are not shown. Note that the cell types that provide major unilateral input to PFNd neurons are LNO2, IbSpsP, EPG, SpsP, and LNO1. c. Same as (a) but for PFNv neurons. Collectively, the distribution shown comprises 93.1% of all input synapses onto PFNv neurons.
Extended Data Figure 6:
Extended Data Figure 6:. LNO2 and hΔB split-Gal4 line characterization.
a. GFP expression driven by the LNO2 split-Gal4 line: +; Mi{Trojan-p65AD.2}VGlut[MI04979-Tp65AD.2]; P{VT008681-Gal4.DBD}attP2. Shown is a coronal projection of a confocal stack through the anterior half of the brain. GFP staining is shown in green, and neuropil staining (nc82) is shown in magenta. The scale bar is 50 μm. Note that, in addition to targeting LNO2 neurons in the LAL, there are some cells labeled in the superior brain which are not LNO2 cells. The observation that this VGlut-split-Gal4 construct drives expression in LNO2 neurons is evidence in support of the conclusion that LNO2 neurons are glutamatergic. b. Same as (a) but for individual optical slices. Shown are the location of the LNO2 cell bodies (left, arrows), neurites in the LAL (middle, arrows), and neurites in NO2 (right, arrows). Scale bars are 50 μm. c. Skeleton of LNO2 neuron from the hemibrain dataset. Overlaid are the anatomical boundaries of the LAL and the NO (divided into subunits NO1, NO2, and NO3). The black sphere denotes the position of the cell body. There is one LNO2 neuron per hemisphere. d. MCFO labeling of a single LNO2 neuron from the LNO2-split Gal4 line. Scale bar is 50 μm. e. On occasion, the LNO2 split-Gal4 line shows expression in NO3. Shown is an MCFO sample from the LNO2-split Gal4 line that labels this additional neuron in NO3 (arrow). Given that two channels (green and red) label the LNO2 on the ipsilateral side, whereas only one channel (red) shows the NO3-innervating neuron, this neuron appears to be a distinct neuron from LNO2. Scale bar is 50 μm. f. Skeletons of two hΔB neurons from the hembrain dataset. Overlaid are the anatomical boundaries of the FB. Spheres denote soma positions. g. MCFO labeling of two hΔB neurons from the hΔB split Gal4 line +; P{R72B05-p65.AD}attP40; P{VT055827-Gal4.DBD}attP2. Scale bar is 20 μm.
Extended Data Figure 7:
Extended Data Figure 7:. SpsP, LNO2, IbSpsP, and LNO1 physiology.
a. Schematic of SpsP and LNO2 input onto a single PFNd neuron. PFNd neurons have dendrites in the PB on the side ipsilateral to their soma, and dendrites in the NO on the side contralateral to their soma. As a result, PFNd neurons receive input from ipsilateral SpsP neurons and the contralateral LNO2 neuron. Thus, although SpsP and LNO2 neurons have opposite velocity preferences (Fig. 2c), they have congruent effects on PFNd neurons. b. SpsP and LNO2 activity as a fly walks in closed loop with a visual cue. c. SpsP and LNO2 ΔF/F versus lateral velocity in the ipsilateral direction. Data for the right and left PB are combined, binned by the ipsilateral rotational velocity, and averaged across flies (n=8 flies for SPS, 4 flies for LNO2). Because rotational and lateral velocity are correlated, rotational velocity bins are asymmetrically populated. There is a significant effect of lateral velocity (2-way ANCOVA, P<10−10 for both SpsP and LNO2) but not rotational velocity (p=0.59 for SpsP, p=0.14 for LNO2). Note however that SpsP activity increases when rotational speed is high, for both ipsi- and contralateral rotations. d. Control experiments for SpsP optogenetic activation. There is little effect of light in PFNd recordings from flies where an empty split-Gal4 line is combined with UAS-CsChrimson (n=3) or in flies with UAS-CsChrimson expressed under SpsP split-Gal4 control (ss52267) but reared in the absence of all-trans-retinal (ATR; n=3). We consistently see strong inhibition in flies that express UAS-CsChrimson under SpsP split-Gal4 control (ss52267) and that are raised on culture media containing ATR (n=9, reproduced from Fig. 2d). PFNd recordings were performed in TTX to isolate monosynaptic responses (see Methods). e. Each IbSpsP neuron receives input from the inferior bridge (IB) and SPS, and projects to a few adjacent PB glomeruli. f. Circular correlation between visual cue position and IbSpsP bump position (n=8 flies). Shown for comparison is the circular correlation for EPG neurons (n=5 flies), reproduced from Extended Data Fig. 2a. g. IbSpsP population activity in the PB as a fly walks in closed loop with a visual cue. h. Normalized IbSpsP bump amplitude versus forward velocity. Data are binned by lateral velocity in the ipsilateral direction, combined for the right and left PB, and averaged across flies (n=8 flies). There is a significant effect of lateral velocity (P<0.01) but not forward velocity (p=0.65, 2-way ANCOVA). i. Normalized IbSpsP bump amplitude in the PB, versus body-centric translational direction. Data are binned by speed. Lateral velocity is expressed in the direction ipsilateral to the imaged PB, allowing us to combine data from the right and left PB before averaging across flies (n=8 flies). j. Each LNO1 neuron receives input from the LAL and synapses onto PFNv and PFNd dendrites in the NO. k. LNO1 activity as a fly walks in closed loop with a visual cue. We used jGCaMP7s in these experiments (rather than jGCaMP7f) because LNO1 fluorescence was dim with jGCaMP7f. l. LNO1 activity versus forward velocity. Data for the left and right NO are combined, binned by lateral velocity in the ipsilateral direction, and averaged across flies (n=8 flies). LNO1 activity decreases slightly with ipsilateral backward movement. There is a significant effect of both forward velocity (P<10−10) and lateral velocity (P<0.01, 2-way ANCOVAs).
Extended Data Figure 8:
Extended Data Figure 8:. PFN→hΔB connectivity.
a. Schematized projections of the PFNd and PFNv populations, from the hemibrain connectome. Gray numbers denote PB glomeruli. Note that the mapping from PB glomeruli to FB horizontal locations is the same for PFNd (red) and PFNv (blue). For each cell type, each half of the PB contains a complete heading map (black arrows) which is projected onto the full horizontal axis of the FB. b. Top: PFN→hΔB connection matrix from the hemibrain connectome, reproduced from Fig. 3g. Note that, for a given hΔB neuron, PFN projections from the left and right PB are horizontally shifted, corresponding to the morphologies in (a). Bottom: Permuted PFN→hΔB connection matrix. Here, the shifts between left and right PFN matrices are eliminated. We used this permuted connection matrix in Fig. 4d (“left-right shift eliminated”).
Extended Data Figure 9:
Extended Data Figure 9:. Model performance as a function of relative synaptic weight.
a. hΔB dendrites receive PFNd and PFNv inputs at their dendrites. By contrast, hΔB axon terminals receive PFNd inputs but no PFNv input. In the bar plot at right, each bar represents one hΔB neuron in the hemibrain connectome (n = 19 neurons). The computational model in Fig. 4a-d assigns an equal weight to all synapses, meaning that all connections are simply weighted by the number of synapses they contain, regardless of whether they are axo-dendritic or axo-axonic connections. b. To determine if the model might perform better if we treated these connections differently, we systematically varied the weight of PFN synapses onto hΔB dendrites versus axons, and we used the population vector average of hΔB activity to decode the fly’s simulated movement. Grayscale heatmap shows the error in translational direction encoding (left) and speed encoding (right), with lower values indicating more accurate encoding. Note that we obtain the best translation direction encoding if we apply equal weight to axo-dendritic or axo-axonic connections (as we do in Fig. 4a-d). Speed encoding improves if we minimize the weight at the synapses onto hΔB axons; this is because this reduces the contribution of PFNd inputs (relative to PFNv), and so it tends to reduce the disproportionate gain when the fly is walking in the preferred direction φp of the PFNd population (Fig. 4c). We do not know whether axo-dendritic and axo-axonic connections are actually weighted equally in the real network, but the fact that we observe good encoding of φ in the hΔB population (Fig. 4h) suggests that these connections carry similar weight, at least as measured with jGCaMP7f. c. We also systematically varied the weight of PFNd and PFNv synapses. We obtain the best translation direction encoding if we apply equal weight to PFNd and PFNv connections (as we do in Fig. 4a-d). Speed encoding improves if we reduce PFNd weights, again because this reduces the disproportionate gain when the fly is walking in the preferred direction φp of the PFNd population (Fig. 4c).
Extended Data Figure 10:
Extended Data Figure 10:. hΔB bump deviations
a. hΔB ΔF/F in each FB column as a fly walks in closed loop with a visual cue. When the fly steps laterally (◄), the bump deviates from the cue. b. Histograms showing the difference between cue position and bump position, mean-centered in each experiment, and binned by translation direction; n=4 flies for hΔB, 16 flies for PFNd, and 11 flies for PFNv, # = relatively poor correlation between cue and bump; these experiments are omitted from panel c. At more lateral translation angles, the hΔB bump deviates away from where it would be when the fly is walking forward. c. Mean difference between cue position and bump position. Each set of connected symbols is one experiment. For hΔB neurons (n=4 flies), we found the shift was significant when comparing left translation-heading deviations to centered translation-heading deviations (P=0.0013, 2-sided paired-sample t-test with Bonferroni-corrected α = 0.0167, CI = [−0.460, −0.191] radians) and when comparing right translation-heading deviations to centered translation-heading deviations (P=0.0115, α = 0.0167, CI = [−0.698, −0.0473] radians). For PFNd neurons (n=16 flies), the shift is not significant when comparing left translation-heading deviations to centered translation-heading deviations (P=0.0215, 2-sided paired-sample t-test with Bonferroni-corrected α = 0.0167, CI = [−0.180, 0.0044] radians) or when comparing right translation-heading deviations to centered translation-heading deviations (P=0.4790, α = 0.0167, CI = [−0.0467, 0.0812] radians). For PFNv neurons (n=9 flies; 2 flies were excluded from our analysis), this shift is significant when comparing left translation-heading deviations to centered translation-heading deviations (P=0.0011, 2-sided paired-sample t-test with Bonferroni-corrected α = 0.0167, CI = [0.0544, 0.222] radians) but not significant when comparing right translation-heading deviations to centered translation-heading deviations (P=0.0313, α = 0.0167, CI = [−0.0135, 0.1848] radians); note that the shift is opposite to hΔB neurons. d. Same as Fig. 4f-g but color-coded by fly (n=28 epochs in 10 flies for hΔB, n=22 epochs in 6 flies for EPG). e. Maximum bump deviation versus φ, measured in all epochs ≥300ms when the φ was consistent over the epoch. Within each fly, epochs are binned by φ and then averaged (○) before averaging across flies (●). For hΔB neurons, the data are close to the identity line (purple); while for EPG neurons, the data are close to the zero line (gold). n=10 flies for hΔB, n=10 flies for EPG. f. Normalized hΔB bump amplitude versus φ, binned by speed (n=11 flies).
Figure 1.
Figure 1.. PFN neurons that encode heading and translational velocity.
a. Body-centric variables are green, world-centric are gray. b. The right and left PB receive a heading map from the EB. PFNd and PFNv neurons receive input in the PB and NO, and they send output to the FB. There are 40 PFNd and 20 PFNv neurons, tiling the PB and FB. c. Two-photon calcium imaging as a fly walks on a spherical treadmill with a visual heading cue in closed loop. d. EPG bump amplitude is relatively constant. First column (from left to right): ΔF/F in the PB. Second column: bump position, shifted to overlap with cue position, correcting for the arbitrary offset between the bump and the cue. Third column: lateral velocity. Fourth column: forward velocity. e. PFNd bump amplitude increases when forward velocity is high. When lateral velocity is leftward (◄), activity is higher on the left, and vice versa. f. PFNv bump amplitude increases during backward walking. When lateral velocity is leftward, activity is higher on the right. g. Normalized bump amplitude versus lateral velocity in the ipsilateral direction (right for the right hemisphere and left for the left hemisphere), binned and color-coded by forward velocity. Data are combined across hemispheres and averaged across flies (n = 5 flies for EPG, 16 PFNd, 11 PFNv). Forward and lateral velocity have a significant effect for PFNd and PFNv (2-way ANCOVA, P<10−10 for each factor in both cell types) but no significant effect for EPG (P=0.8 and 0.08). h. Preferred body-centric translational direction (φp) of each cell type, fit to data in (g); φp is ±31° for PFNd, ±137° for PFNv.
Figure 2.
Figure 2.. Velocity tuning in PFNd neurons from graded release of inhibition.
a. Top: example PFNd voltage (black) with velocity in the cell’s preferred translation direction (blue, Vp=Vφ^p, where v is translational velocity and φ^p is the unit vector in the direction φp, Fig. 1h). Bottom: time of peak cross–correlation between firing rate and vp; median is −18 ms (vertical bar), n=11 cells in 9 flies. b. Left: firing rate versus vp for three example neurons. When heading is close to θp for this cell (gold), the slope is steeper than when heading is opposite to θp (gray). Right: slope of a linear fit is significantly higher near the preferred heading (n=14 cells in 11 flies, * P= 2×10⁻⁴, 2-sided paired t-test). c. ΔF/F versus lateral velocity in the ipsilateral direction (n=8 flies for SpsP, n=4 flies for LNO2). Both forward and lateral velocity have a significant effect (2-way ANCOVA, P<10−10 for each factor in both cell types). d. Left: whole-cell voltage response of a PFNd neuron to SpsP optogenetic stimulation (arrowhead), recorded in TTX (to isolate monosynaptic input), TTX+1 μM picrotoxin (to block GABAA receptors), and TTX+100 μM picrotoxin (to block GluCl receptors). Each trace is an average of >50 trials. Right: stimulus-evoked inhibition (n=6 cells in 6 flies, ** P= 2.67×10⁻⁴, * P=7.02×10⁻⁴, 2-sided paired t-tests with Bonferroni-corrected α = 0.0167). e. Schematic: LNO2 and SpsP disinhibit PFNd on the left during a leftward movement, and vice versa (Extended Data Fig. 7a).
Figure 3.
Figure 3.. Behavior and connections downstream from PFN neurons.
a. Experimental setup. b. Example trajectories (1D wrapped paths). Ticks are fictive fructose stimuli. After the 5-min activation period, the stimulus disappears, and the fly strays from the activation zone. The post-return period starts when the fly walks 1 revolution from the activation zone. c. Trajectories from one control and one PFNd-perturbed fly, shown from the end of the activation period, and colored during the post-return period. A run is defined as a segment between consecutive reversals. d. Left: mean distribution of transits for post-return trajectories in (c). Right: mean transit distributions for 27 control flies (162 trials) and 25 PFN-perturbed flies (150 trials), ± 95% CI. e. Normalized kernel density estimate of the wrapped run midpoint in the post-return period (mean ± 95% CI). f. Schematic: each hΔB neuron receives PFNd and PFNv input from both hemispheres. g. Synapses per connection (hemibrain dataset). Rows are hΔB neurons (19 in total). Columns are PFNd/v neurons (40 and 20 in total) sorted and color-coded by θp. Because PFNd neurons target hΔB axons and dendrites, there are two “hotspots” per column; because PFNv neurons target only dendrites, there is one hotspot per column (Extended Data Fig. 9a). h. Left: difference in θp between PFNd.R and PFNd.L inputs to the same hΔB neuron. Each dot is a hΔB neuron (n=19 cells), black line is the circular median, gray line is 0°. Right: shift in φp in PFNd.R and PFNd.L. i. Same for PFNv. j. PFNd and PFNv inputs from the same hemisphere have opposite values of θp and φp. k. Summary of PFN inputs to an example hΔB neuron (top row in g). Each input has a different φp (red/blue) and θp (gray). Red arrows point in the same direction, as do blue arrows, although red and blue are not quite aligned.
Figure 4.
Figure 4.. From heading and body-centric velocity to world-centric velocity.
a. Model: rectified vp scales the heading map in each PFN population. These values are multiplied by PFN→hΔB weights and summed before adding noise. b. Model: hΔB population activity. The fly’s path is a straight line at a fixed speed. Each row is normalized to its maximum. Across rows, θ is rotated through 360°, while φ is counter-rotated, so θ+φ is constant within a block. c. Model: hΔB bump amplitude versus translation speed. d. Model: hΔB bump position versus world-centric travel direction with actual connectivity, with permuted connectivity that removes the left-right phase shift (Extended Data Fig. 8b), and with PFNv or PFNd omitted. e. A looming stimulus in front of the fly induces a change in φ. f. Left: when an example fly walks backward in response to loom (✻), the hΔB bump jumps. Right: 28 backward-walking events in 10 flies; purple line is the circular mean, purple arc is the circular SD, gray line is 0°. Top shows change in φ; bottom shows maximum difference between cue position and bump position, relative to where the bump would be if the fly were walking forward. g. The EPG bump does not jump during backward-walking events (n=22 events in 6 flies). h. Centered bump position versus travel direction, in epochs ≥300 ms when φ was consistent (10 flies each for hΔB and EPG). Epochs are binned by θ and averaged within a fly (○) and across flies (●). Here “centering” means correcting for the arbitrary compass offset in each fly. For hΔB, circular-linear fits to the data are close to the line of unity (slope≈1, intercept≈0°), whereas for EPG, fits are close to y=θ (see Methods for statistical tests). i. Normalized hΔB bump amplitude versus translation speed. Each gray line is a fly; purple is mean across flies (n=11 flies).

References

    1. Bicanski A. & Burgess N. Neuronal vector coding in spatial cognition. Nat. Rev. Neurosci 21, 453–470 (2020). - PubMed
    1. Wang C, Chen X. & Knierim JJ Egocentric and allocentric representations of space in the rodent brain. Curr. Opin. Neurobiol 60, 12–20 (2020). - PMC - PubMed
    1. Wolff T, Iyer NA & Rubin GM Neuroarchitecture and neuroanatomy of the Drosophila central complex: A GAL4-based dissection of protocerebral bridge neurons and circuits. J. Comp. Neurol 523, 997–1037 (2015). - PMC - PubMed
    1. Wolff T. & Rubin GM Neuroarchitecture of the Drosophila central complex: A catalog of nodulus and asymmetrical body neurons and a revision of the protocerebral bridge catalog. J. Comp. Neurol 526, 2585–2611 (2018). - PMC - PubMed
    1. Hulse BK et al. A connectome of the Drosophila central complex reveals network motifs suitable for flexible navigation and context-dependent action selection. bioRxiv doi:10.1101/2020.12.08.413955 (2020). - DOI - PMC - PubMed

Additional references for Online Methods

    1. Wilson RI & Laurent G. Role of GABAergic inhibition in shaping odor-evoked spatiotemporal patterns in the Drosophila antennal lobe. J. Neurosci 25, 9069–9079 (2005). - PMC - PubMed
    1. Pfeiffer B. et al. Refinement of tools for targeted gene expression in Drosophila. Genetics 186, 735–755 (2010). - PMC - PubMed
    1. Tirian L. & Dickson BJ The VT GAL4, LexA, and split-GAL4 driver line collections for targeted expression in the Drosophila nervous system. bioRxiv 198648 (2017).
    1. Nern A, Pfeiffer BD & Rubin GM Optimized tools for multicolor stochastic labeling reveal diverse stereotyped cell arrangements in the fly visual system. Proc. Natl. Acad. Sci. U. S. A 112, E2967–76 (2015). - PMC - PubMed
    1. Miyamoto T, Slone J, Song X. & Amrein H. A fructose receptor functions as a nutrient sensor in the Drosophila brain. Cell 151, 1113–1125 (2012). - PMC - PubMed

Publication types

LinkOut - more resources