. 2022 Jul 1;163(7):e821-e836.
doi: 10.1097/j.pain.0000000000002498. Epub 2021 Sep 24.

Unbiased immune profiling reveals a natural killer cell-peripheral nerve axis in fibromyalgia

Affiliations

Unbiased immune profiling reveals a natural killer cell-peripheral nerve axis in fibromyalgia

Vivek Verma et al. Pain. .

Abstract

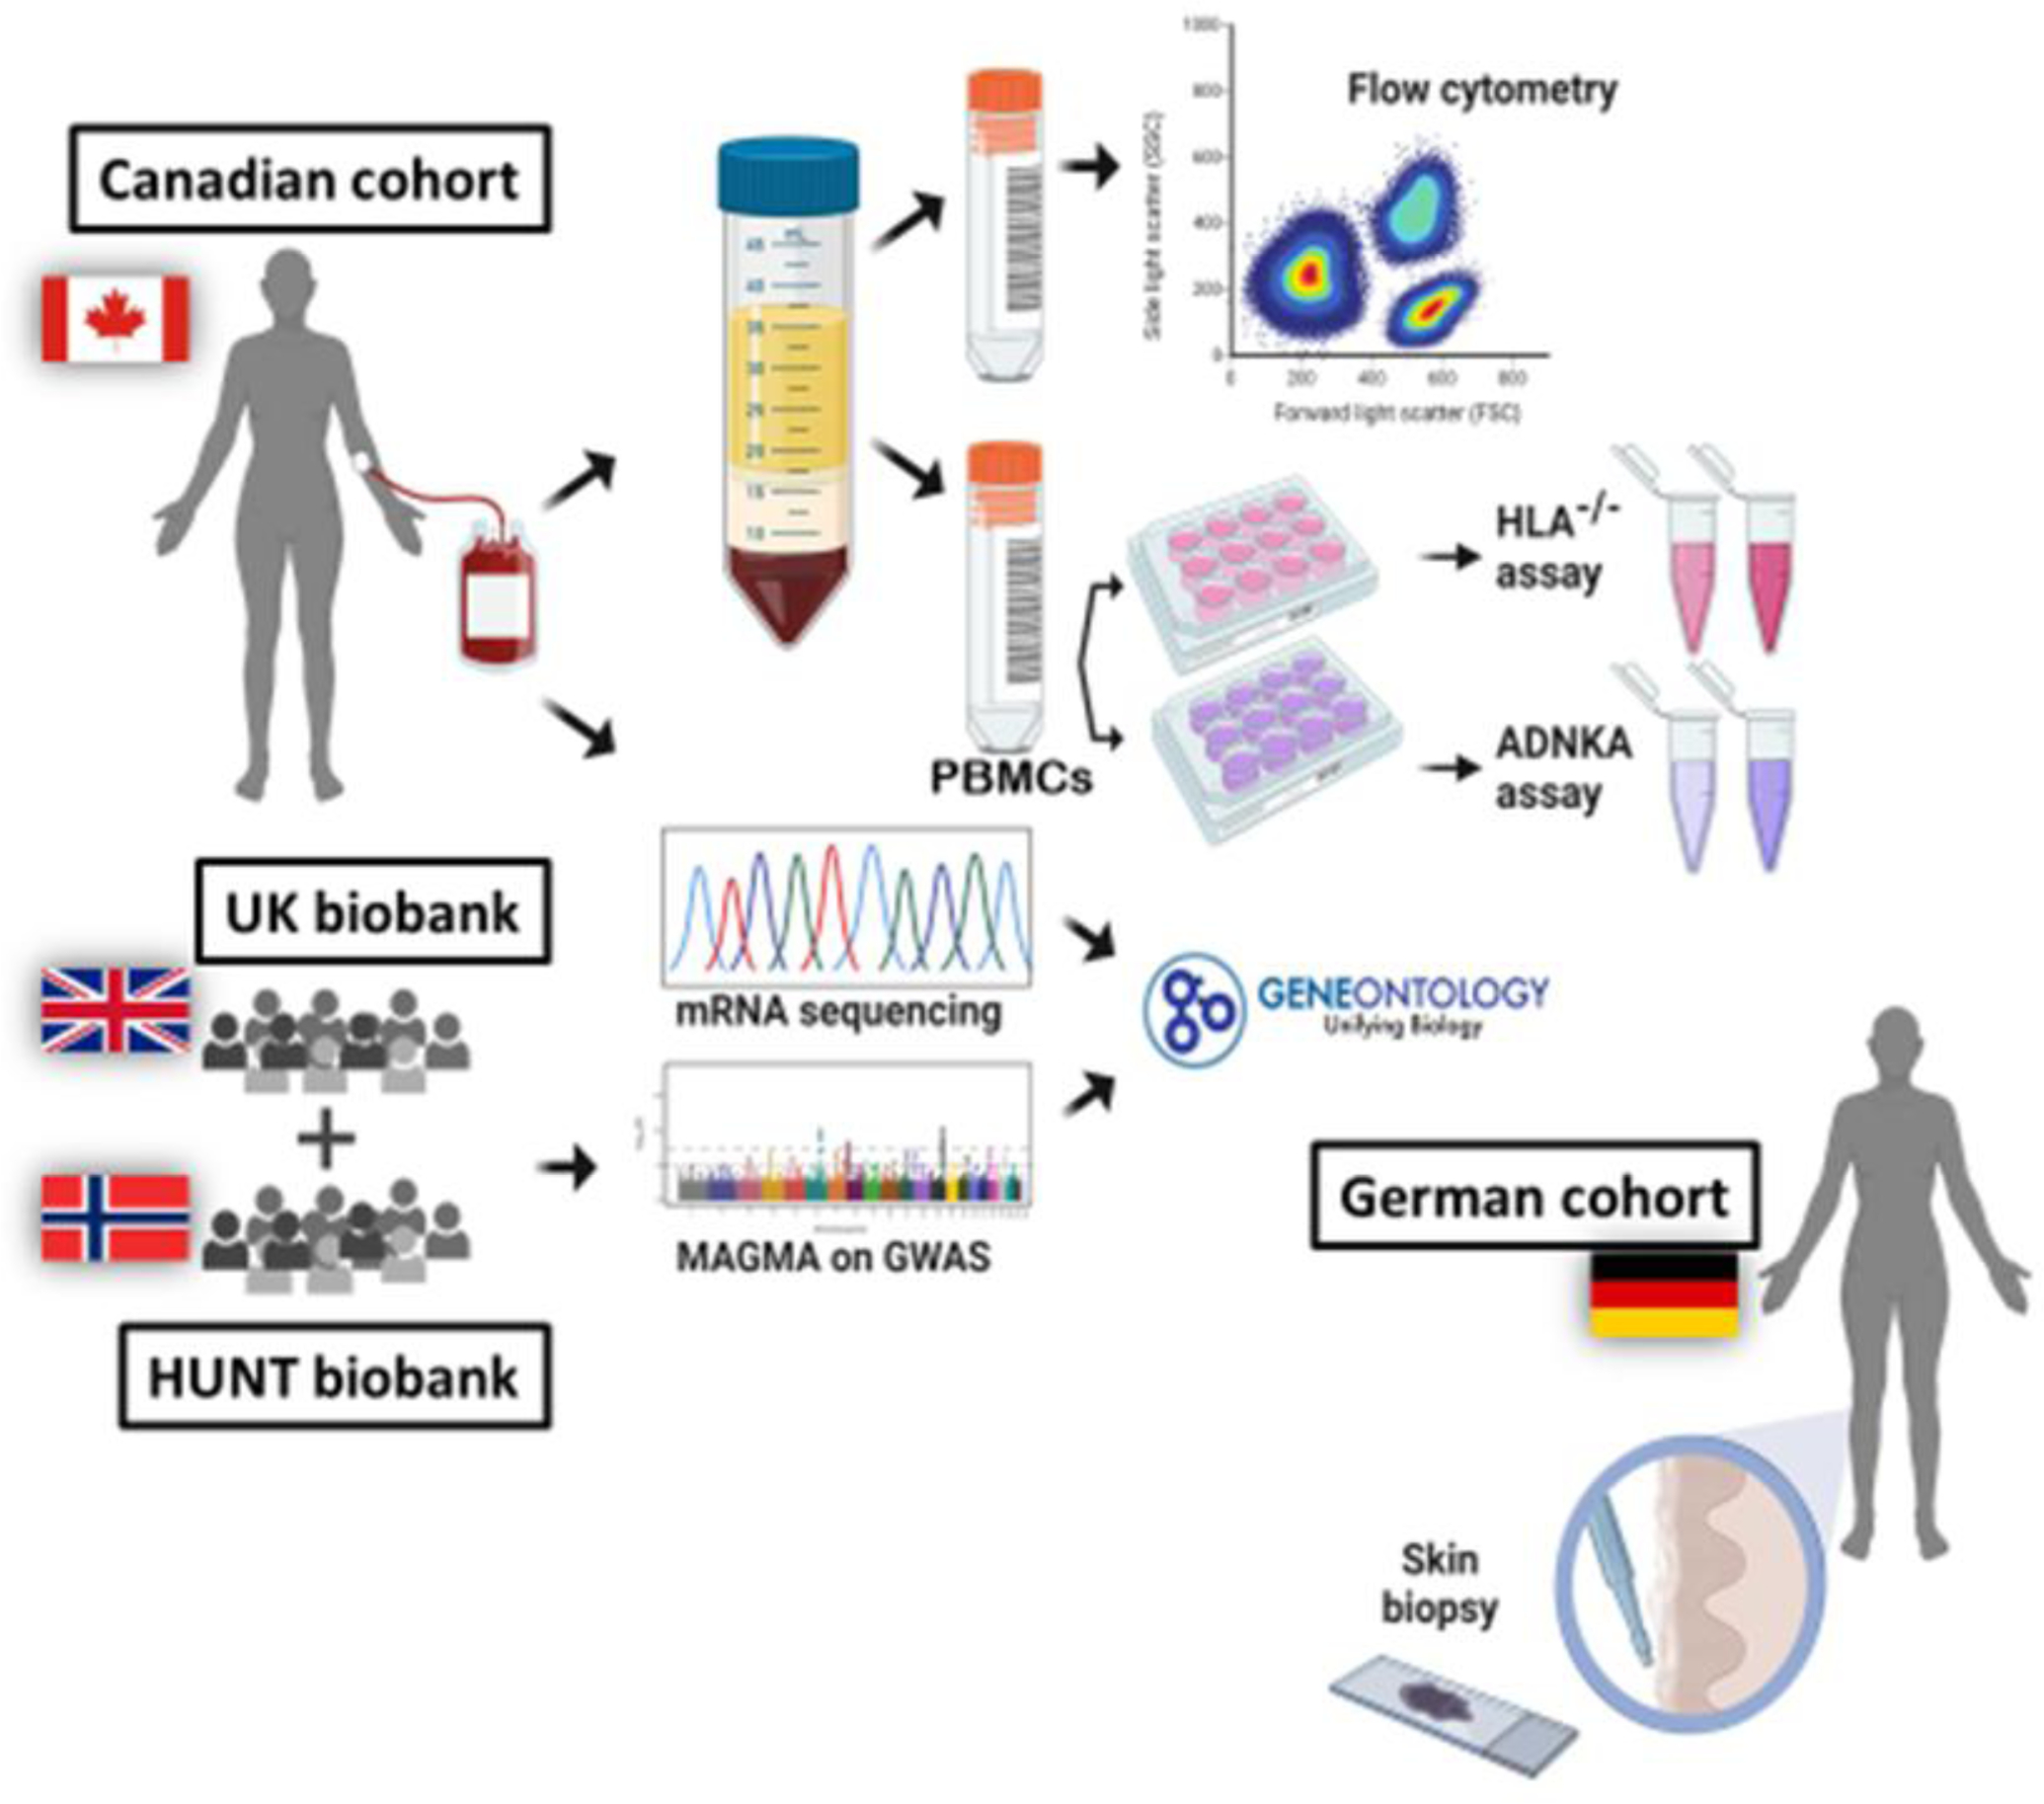
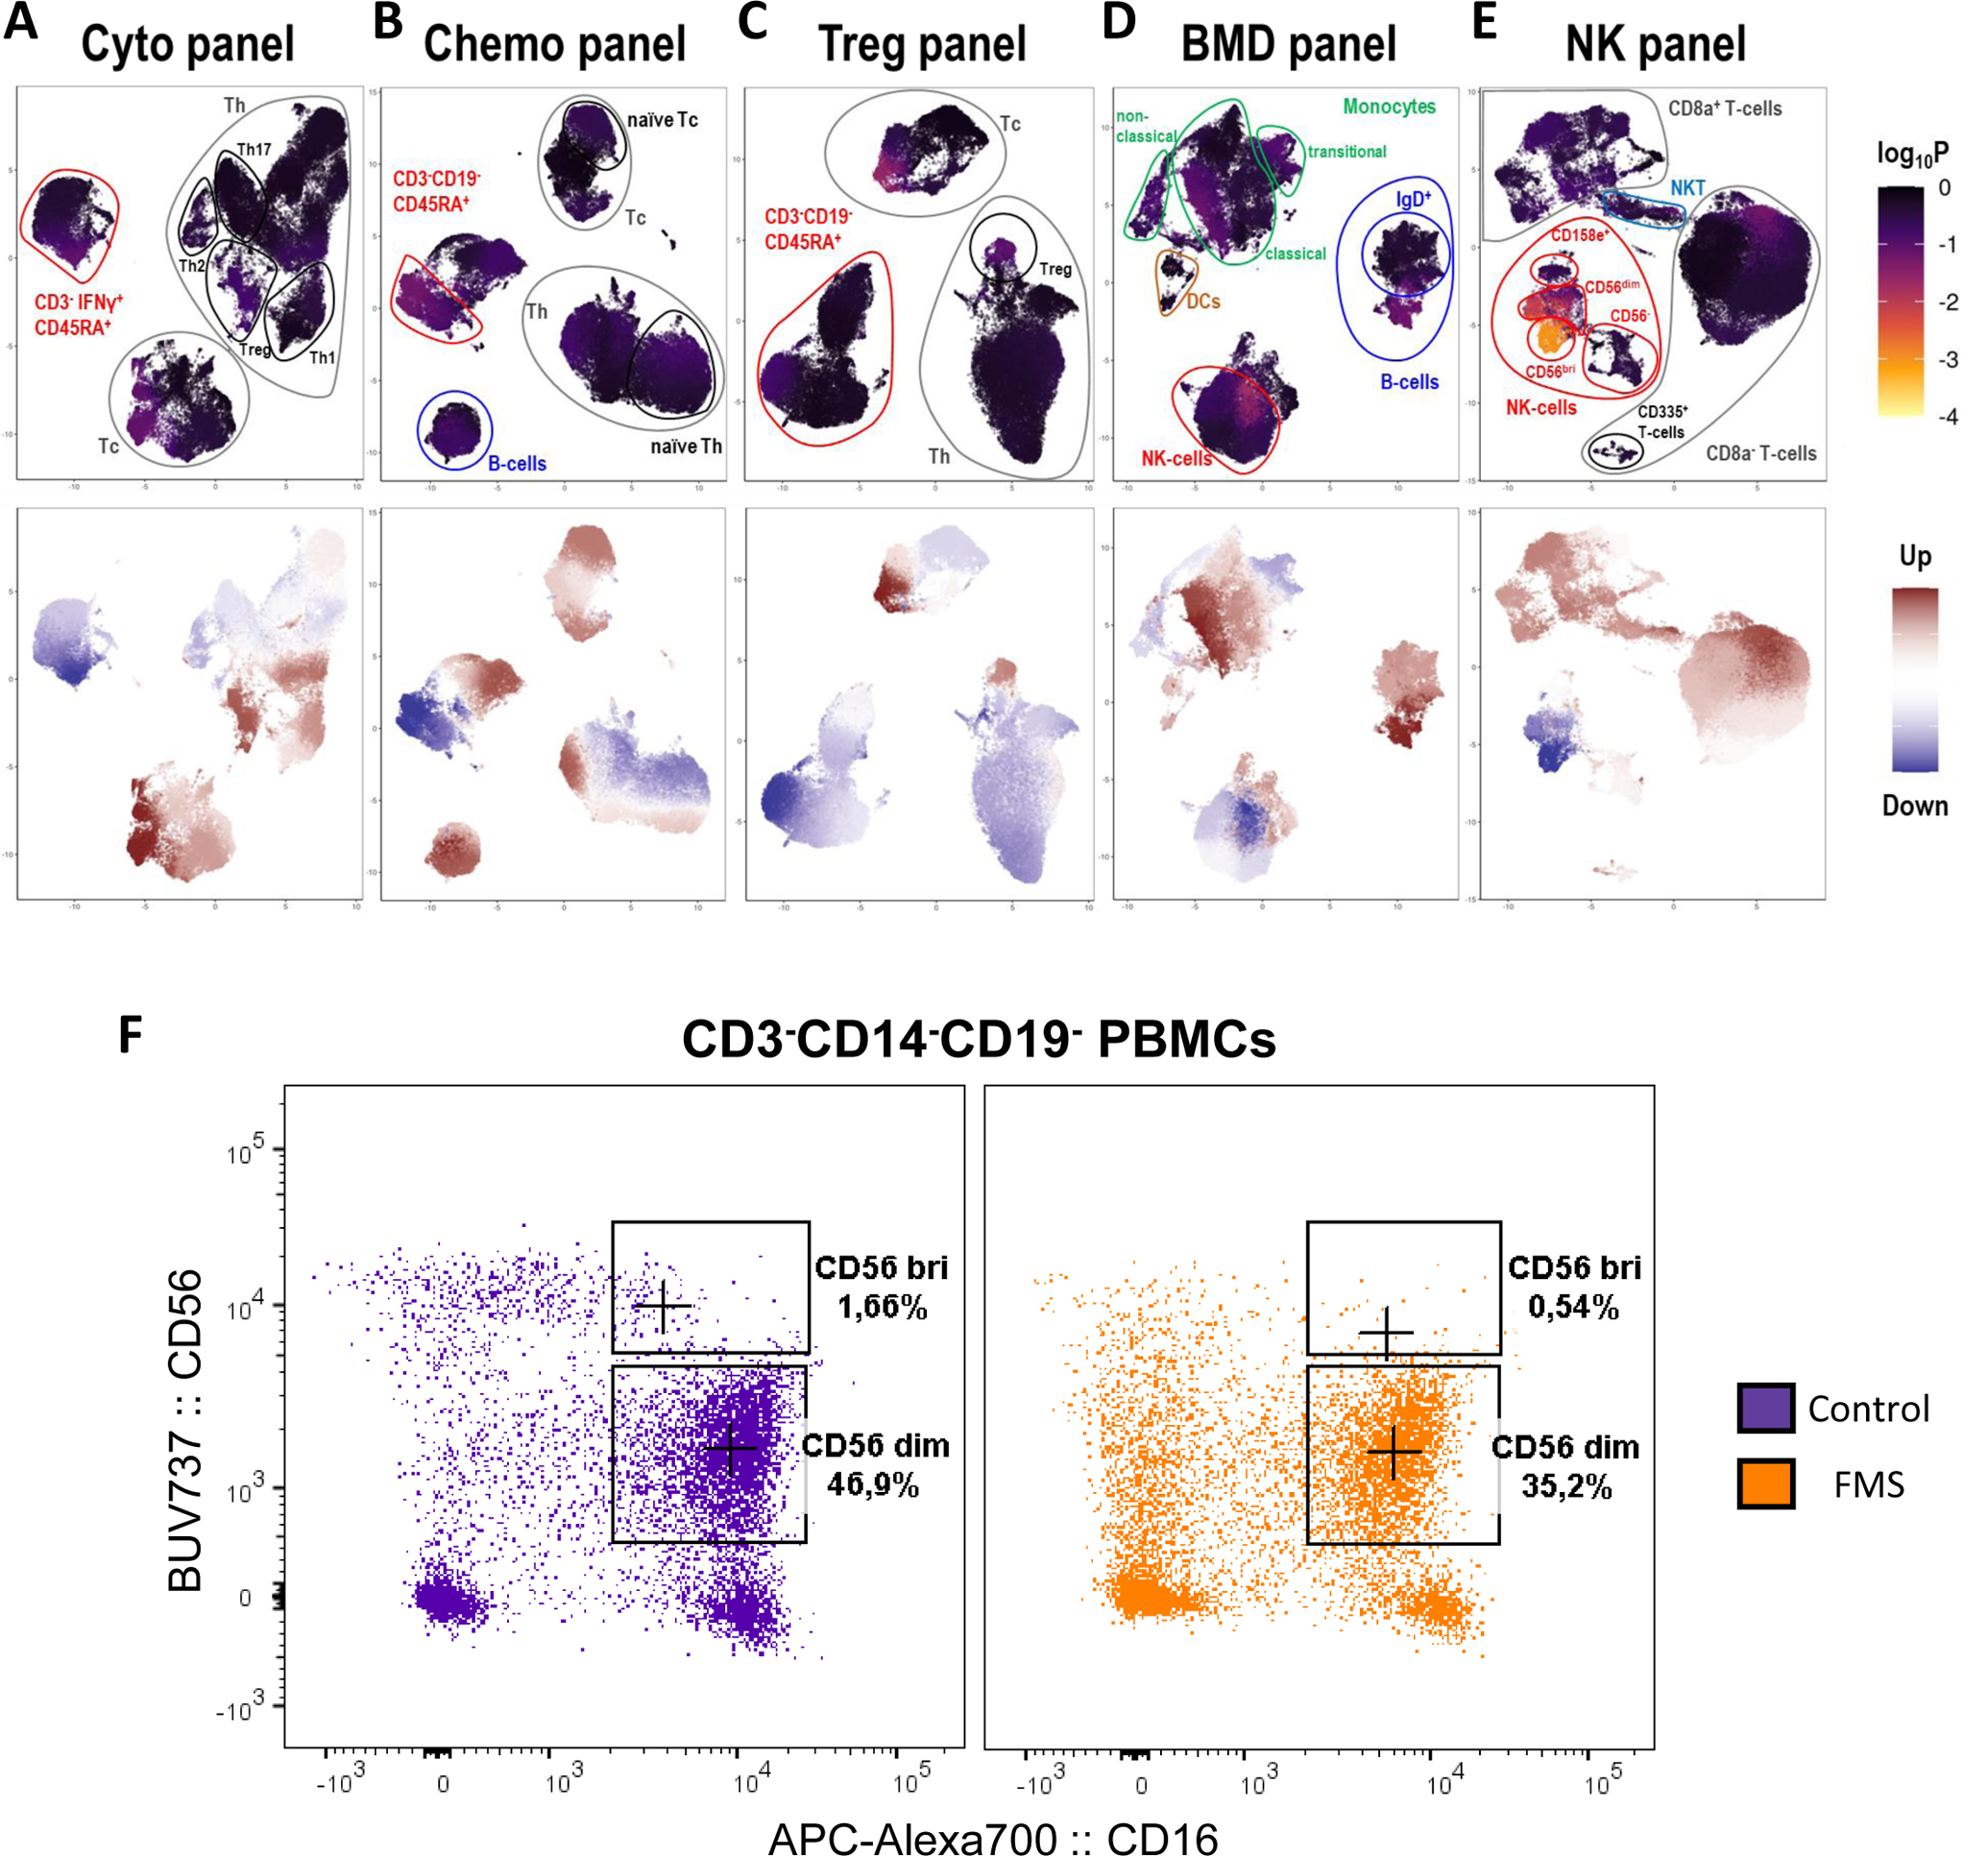
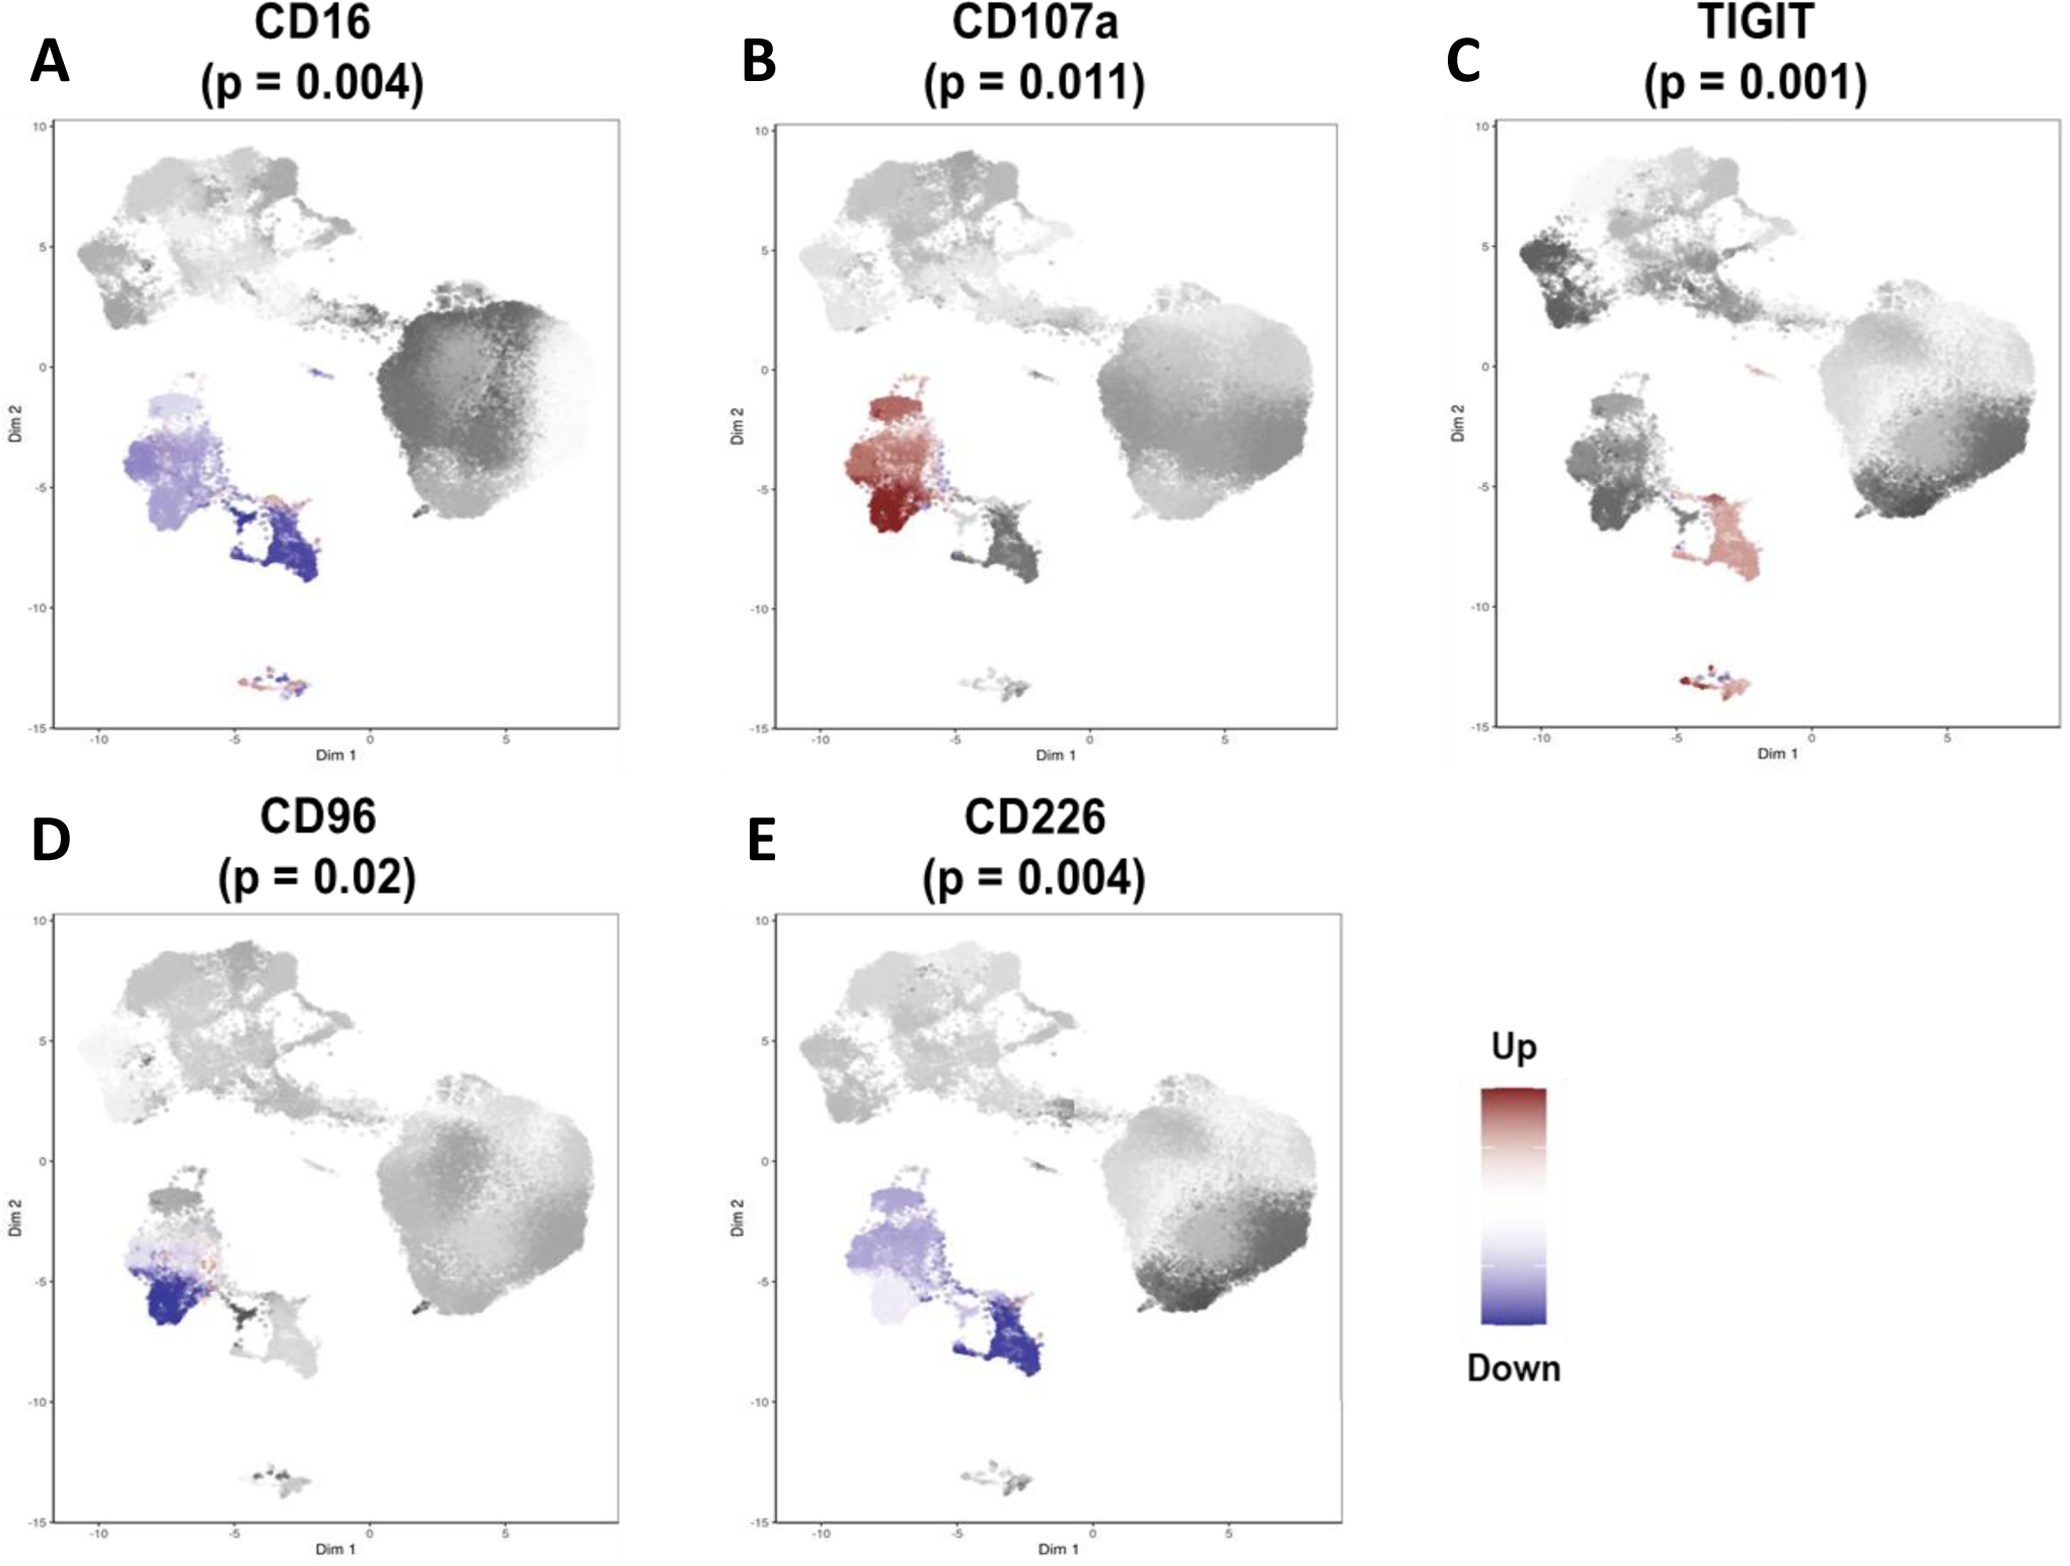
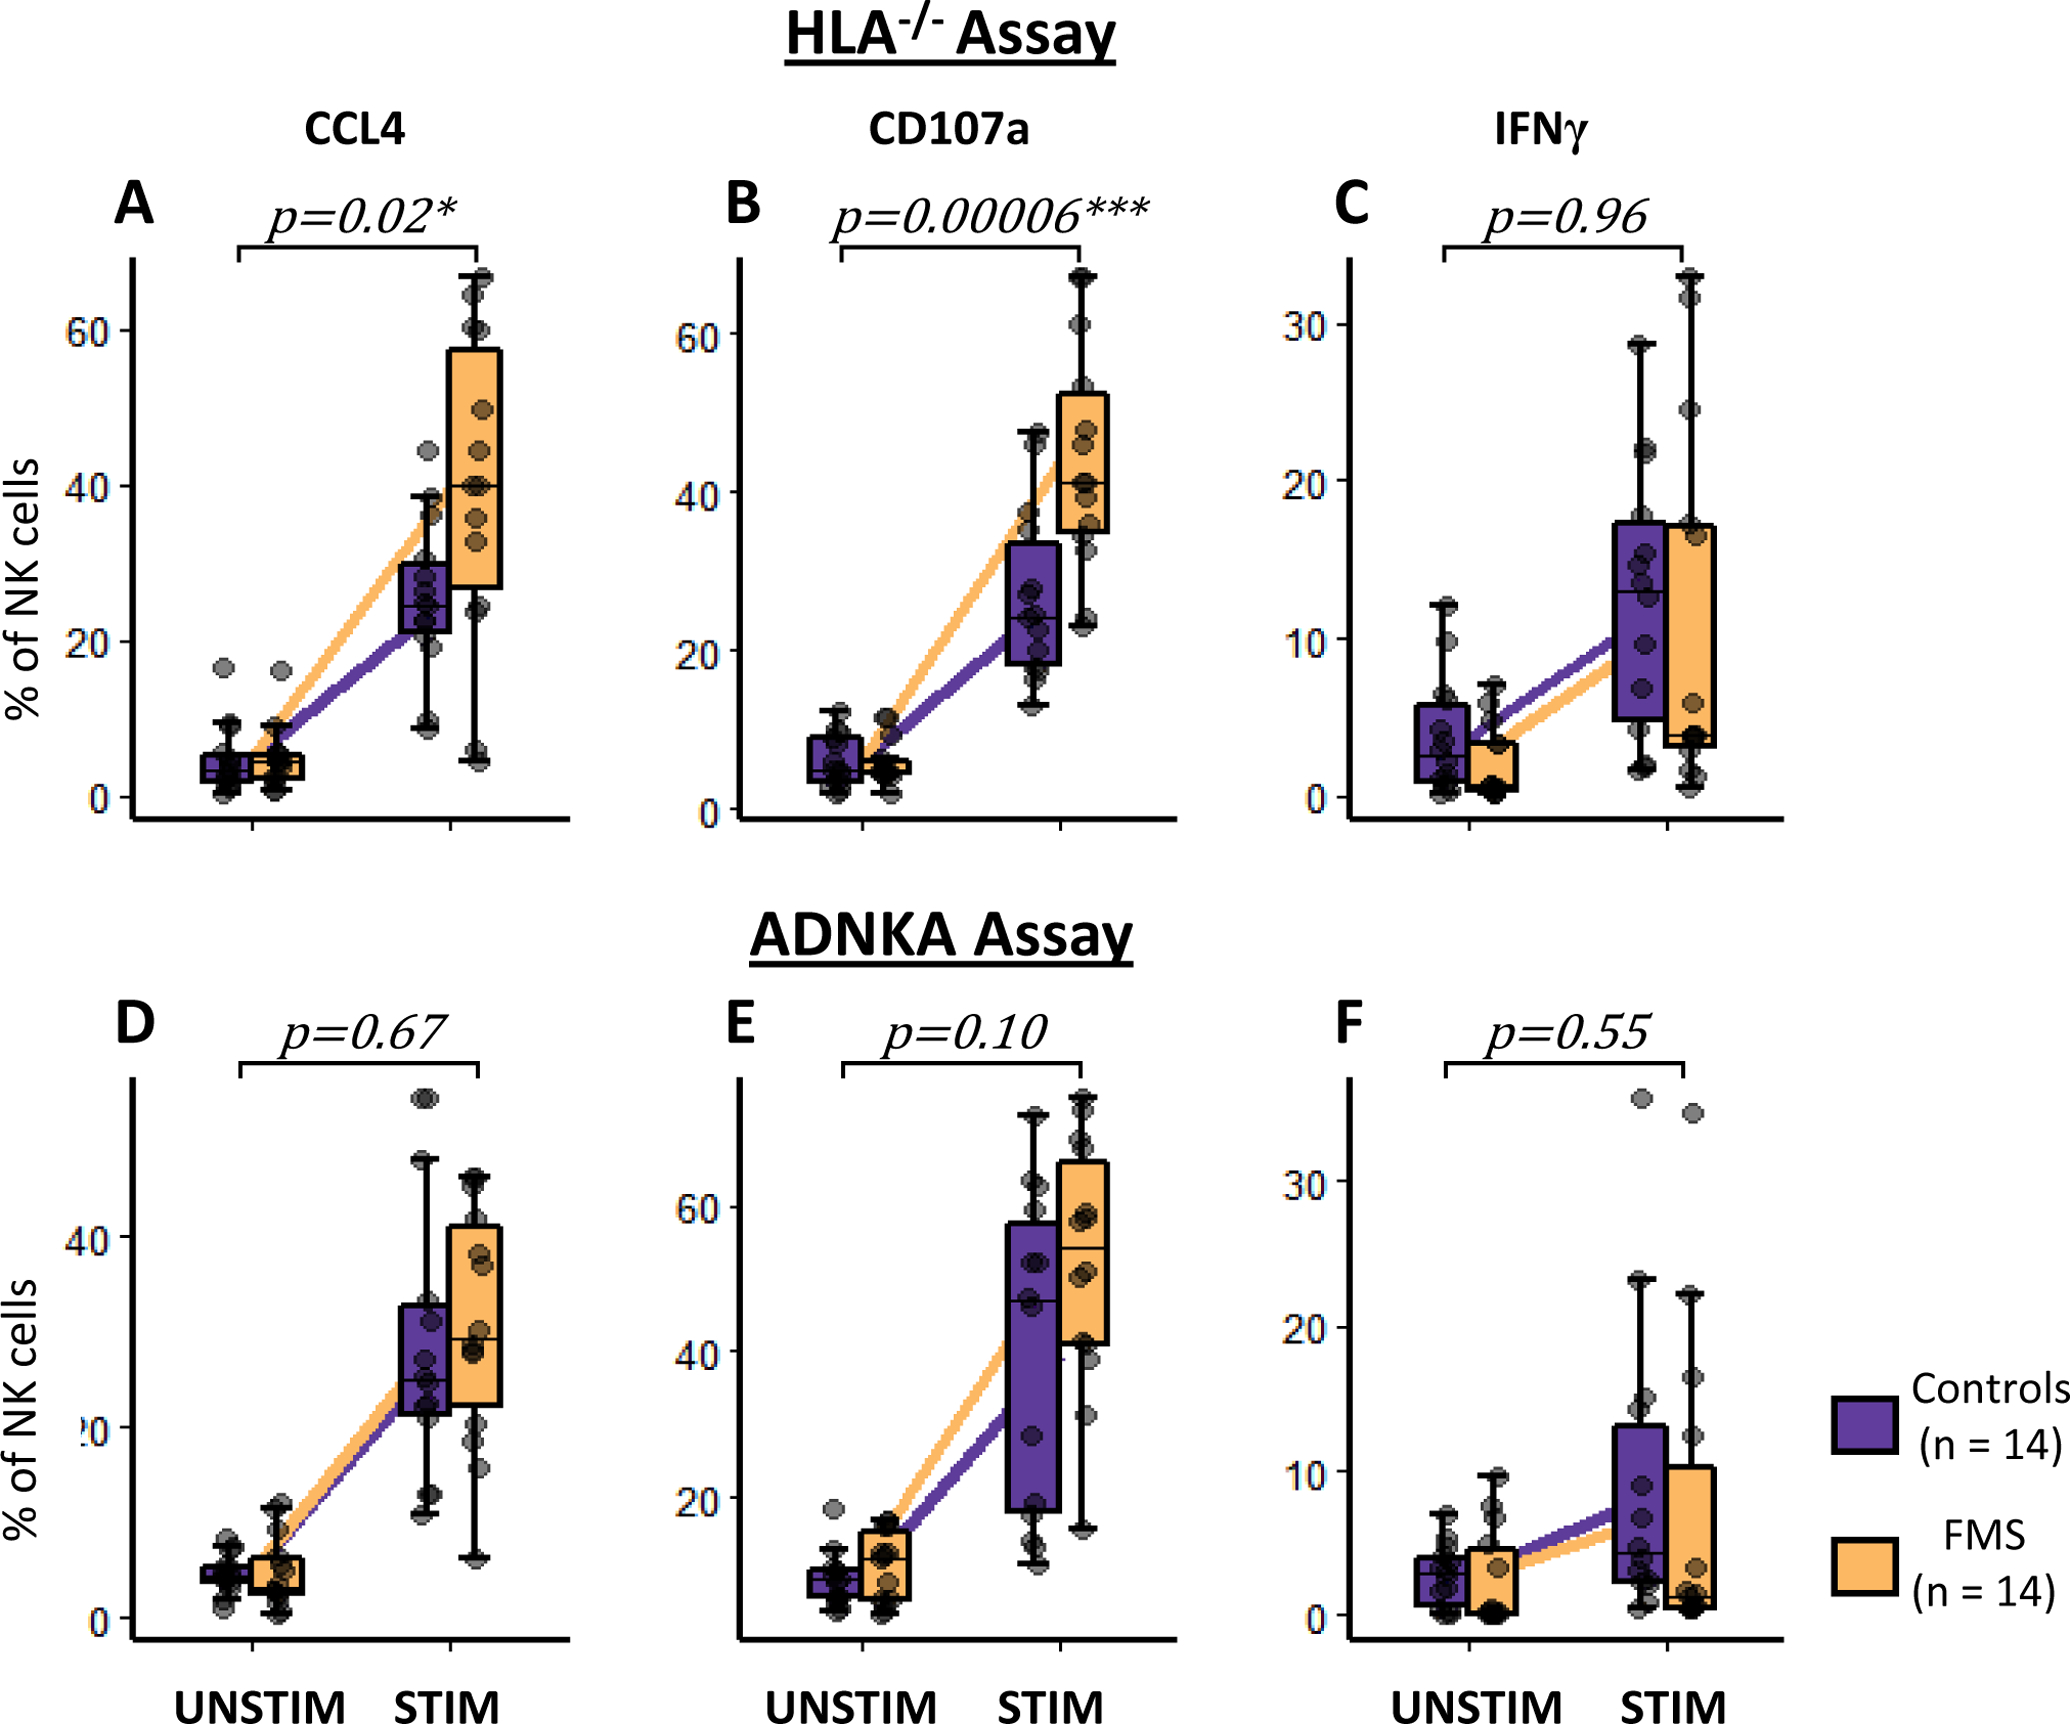
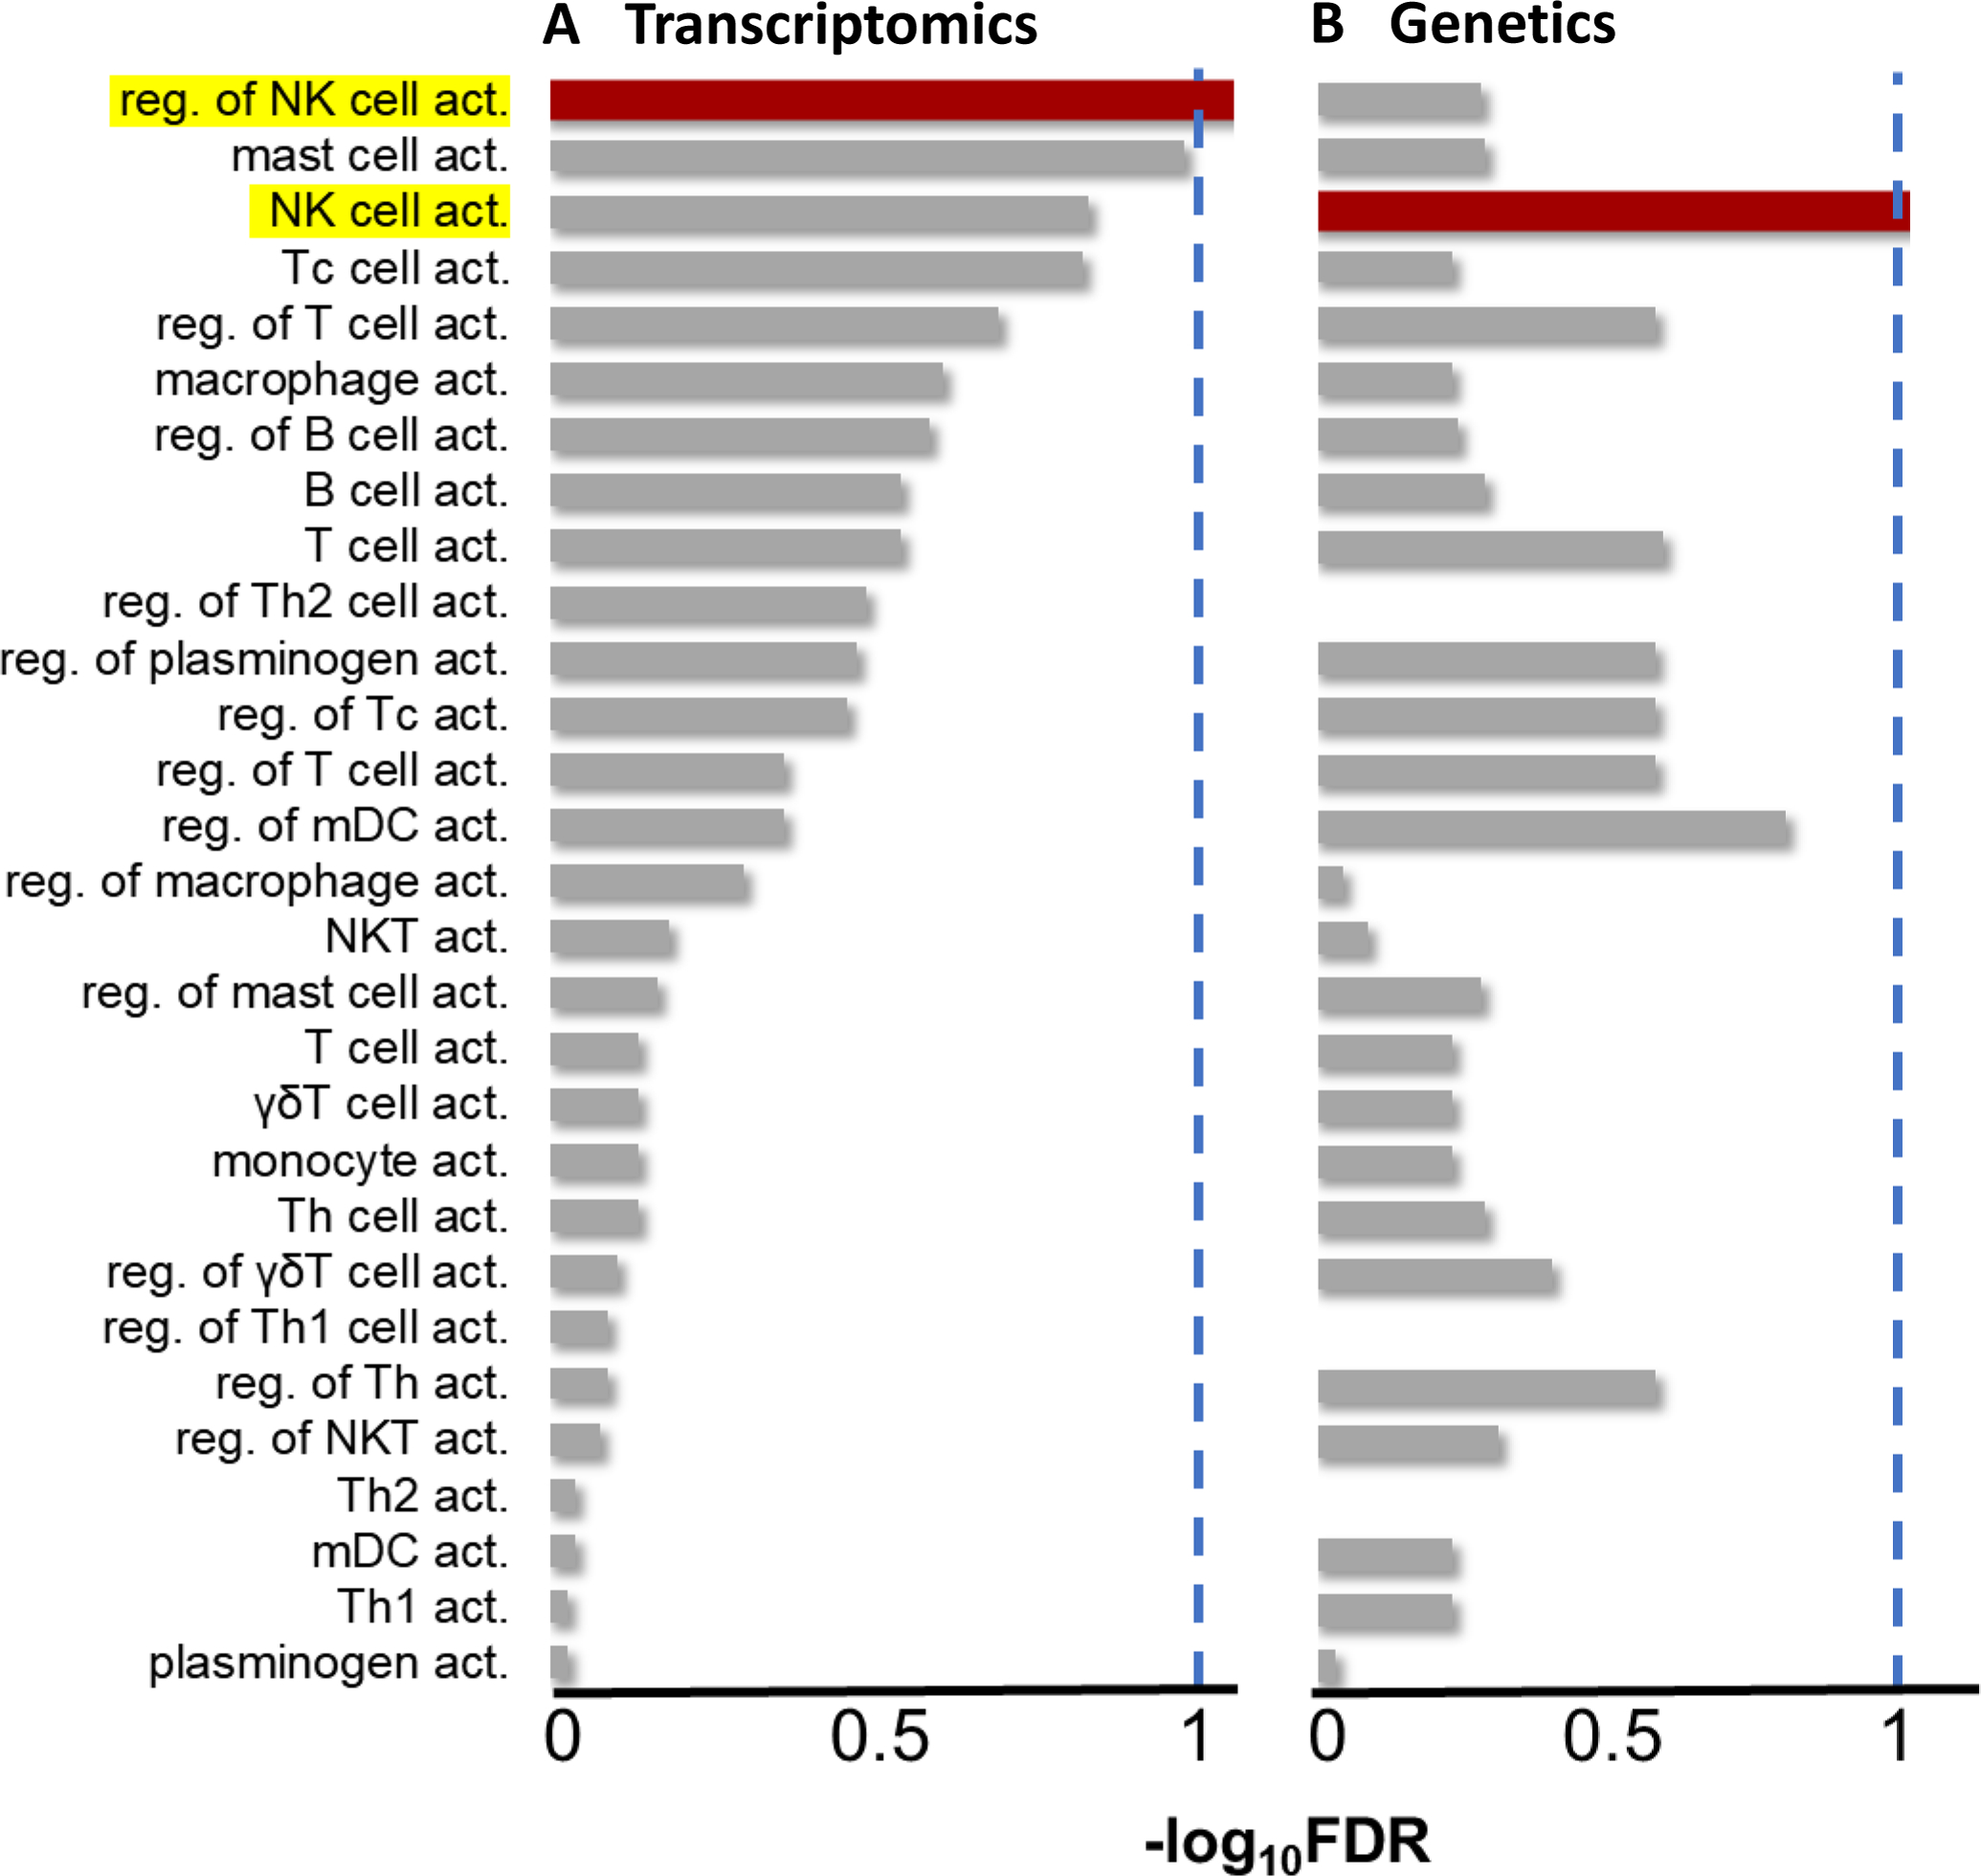
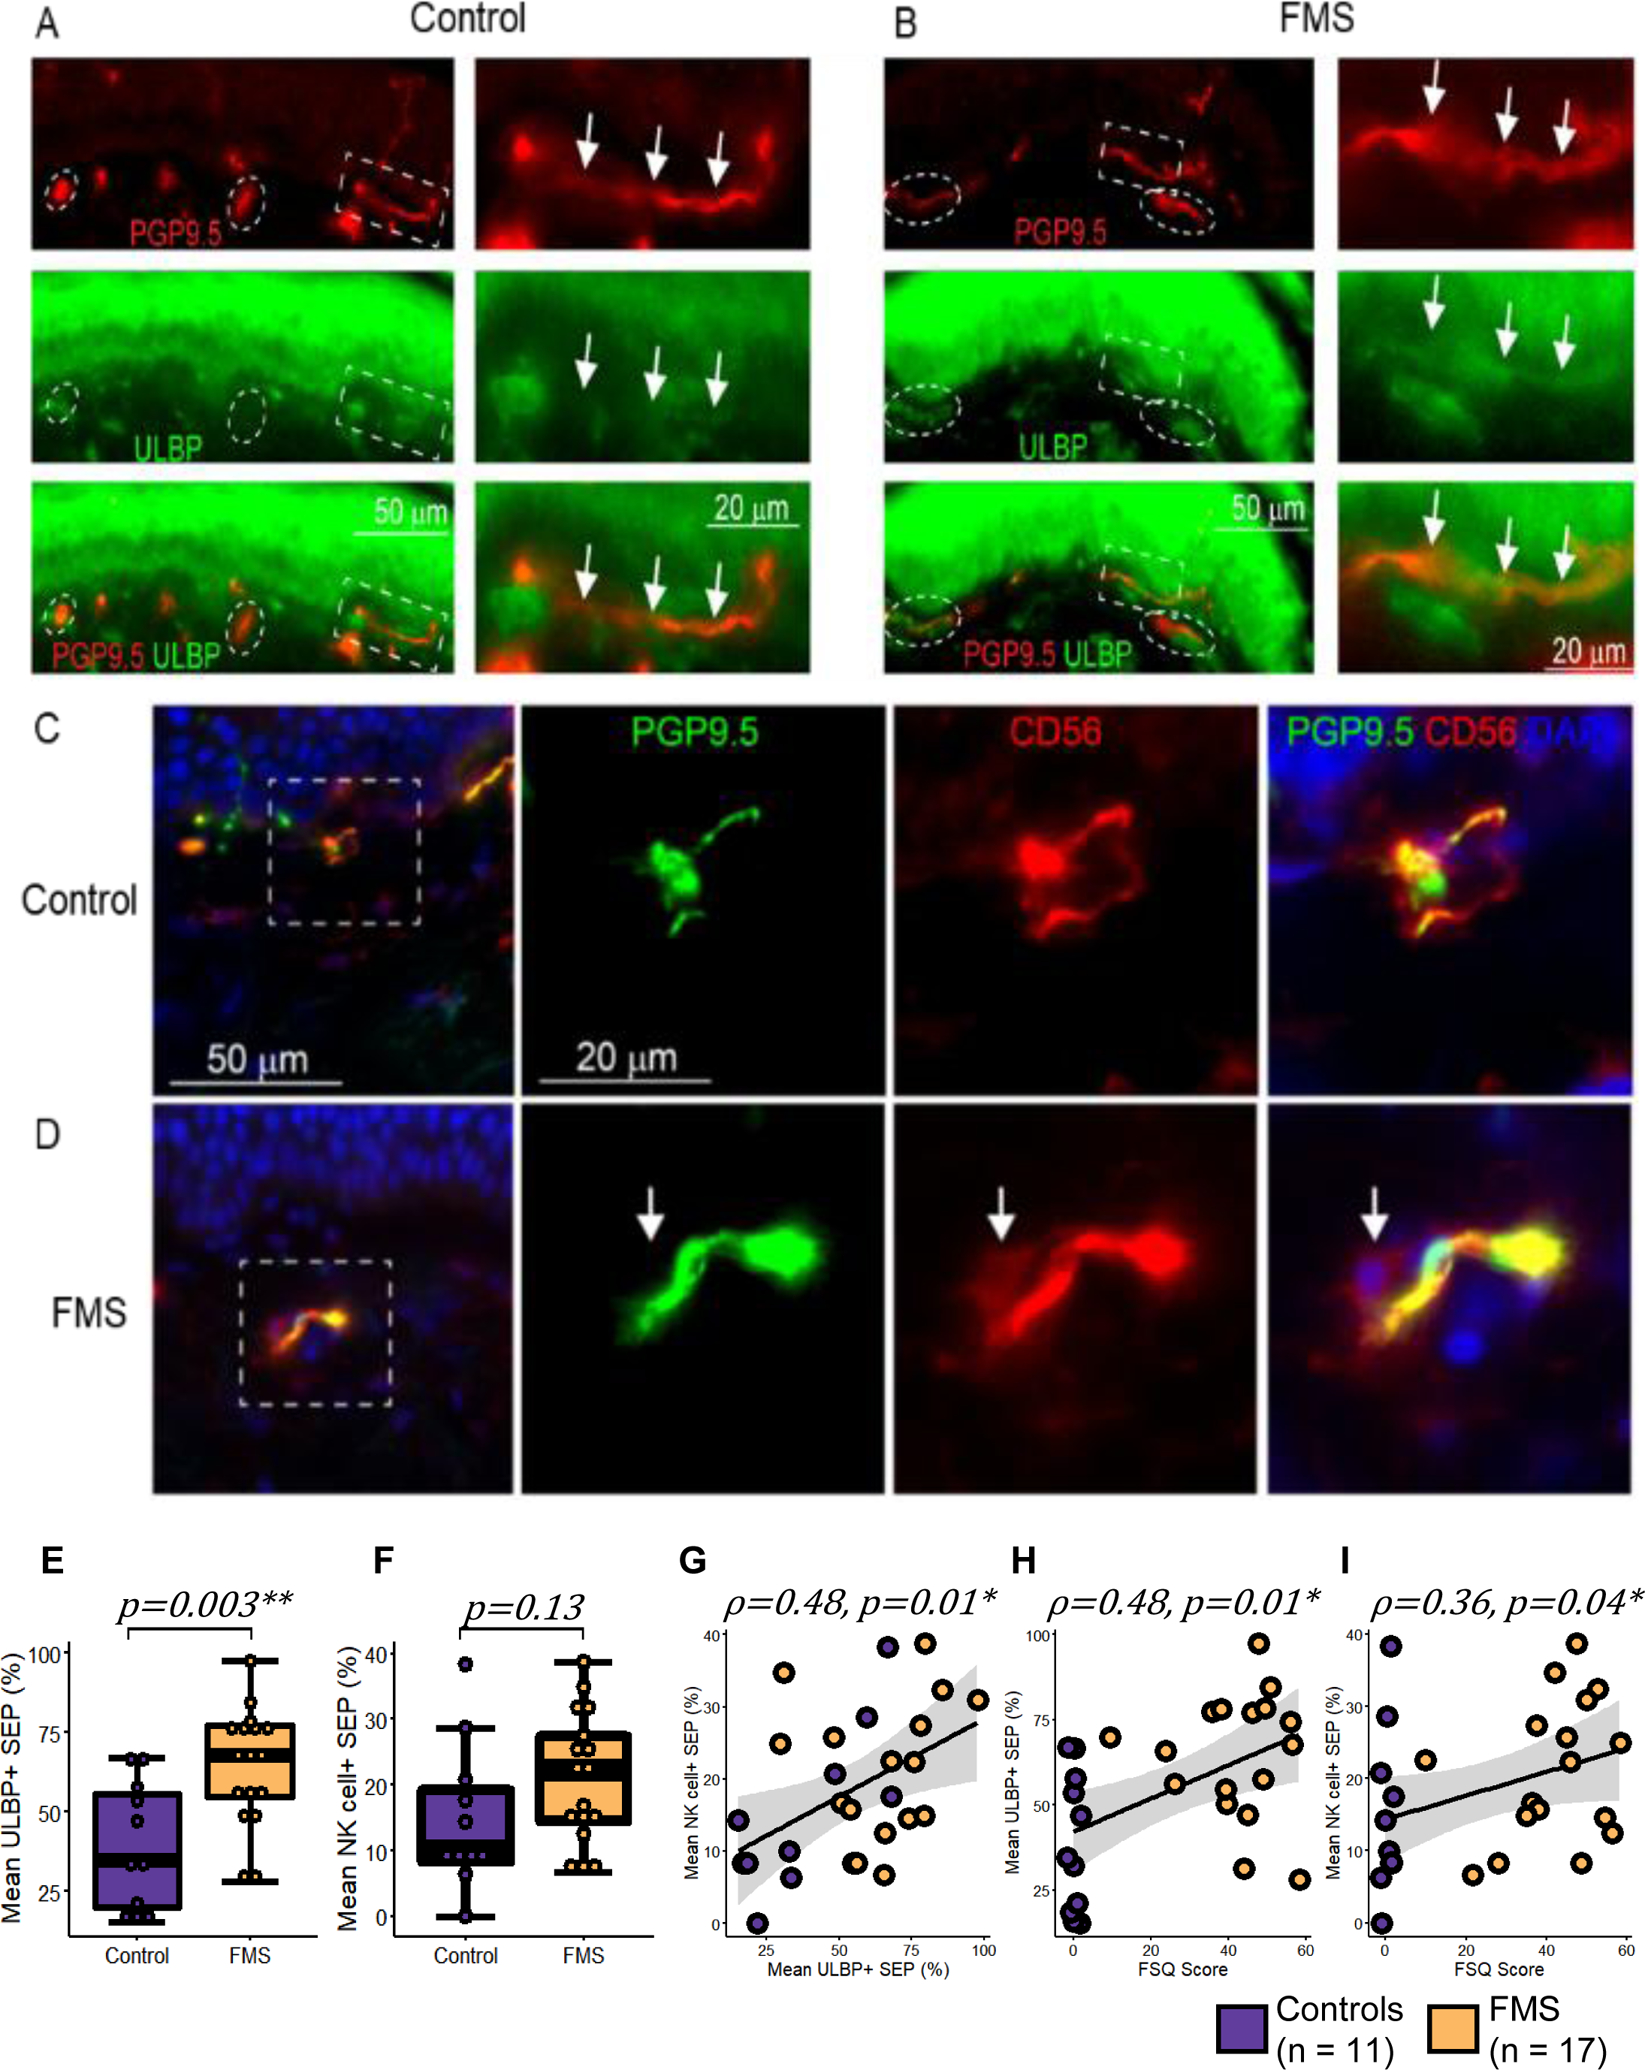
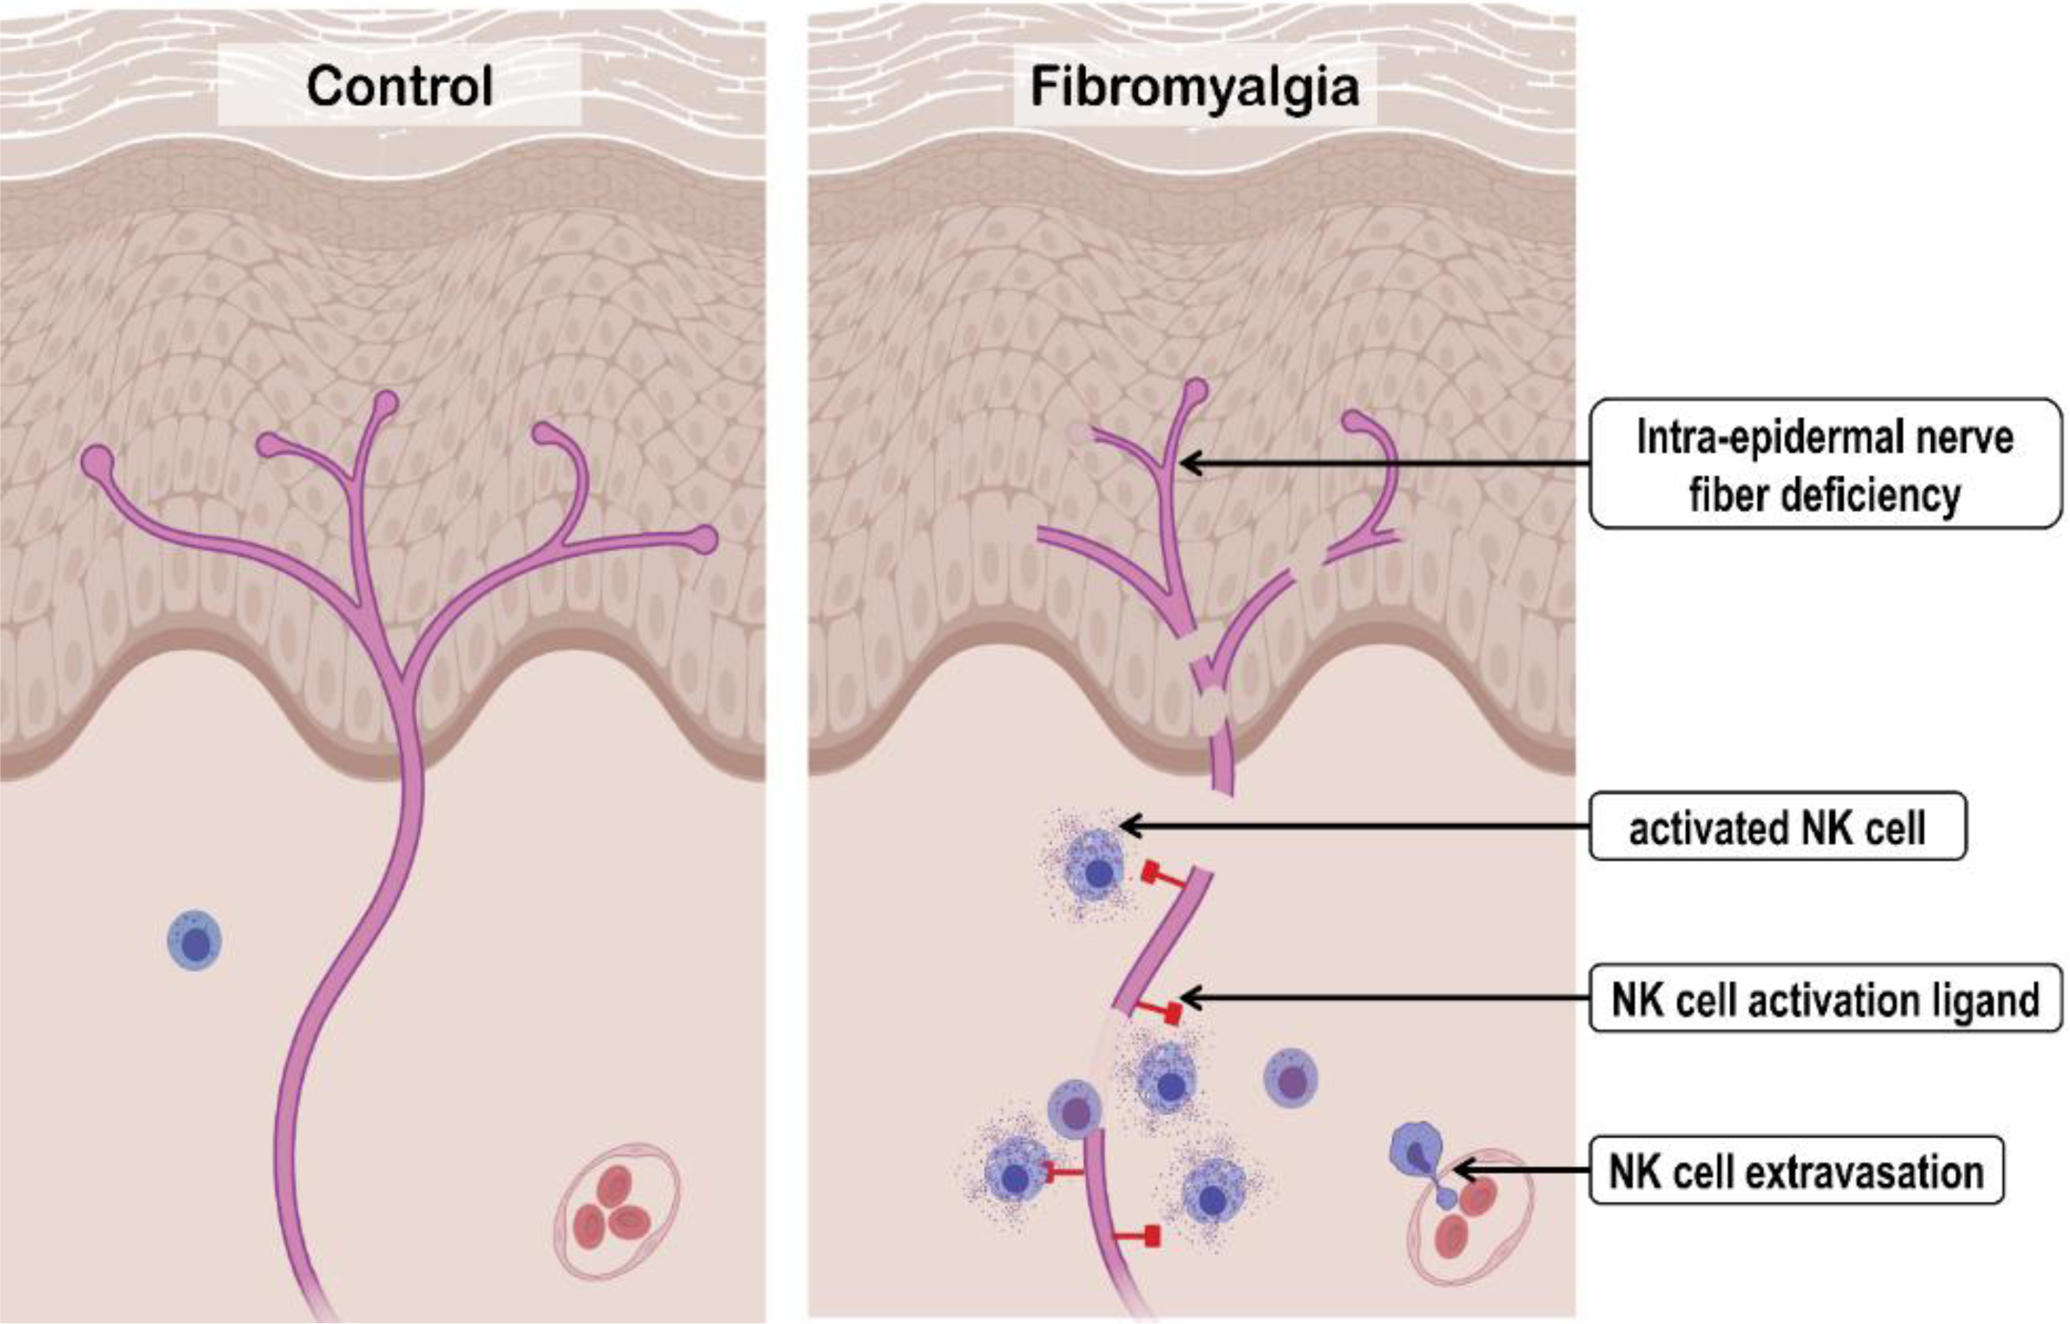
The pathophysiology of fibromyalgia syndrome (FMS) remains elusive, leading to a lack of objective diagnostic criteria and targeted treatment. We globally evaluated immune system changes in FMS by conducting multiparametric flow cytometry analyses of peripheral blood mononuclear cells and identified a natural killer (NK) cell decrease in patients with FMS. Circulating NK cells in FMS were exhausted yet activated, evidenced by lower surface expression of CD16, CD96, and CD226 and more CD107a and TIGIT. These NK cells were hyperresponsive, with increased CCL4 production and expression of CD107a when co-cultured with human leukocyte antigen null target cells. Genetic and transcriptomic pathway analyses identified significant enrichment of cell activation pathways in FMS driven by NK cells. Skin biopsies showed increased expression of NK activation ligand, unique long 16-binding protein, on subepidermal nerves of patients FMS and the presence of NK cells near peripheral nerves. Collectively, our results suggest that chronic activation and redistribution of circulating NK cells to the peripheral nerves contribute to the immunopathology associated with FMS.


Conflict of interest statement

Conflict of interest statement

The authors have no conflicts of interest to declare.

Figures

Figure 1:
Figure 1:
The experimental design. Whole blood from the Canadian cohort was split for isolating peripheral blood mononuclear cells (PBMCs) and for mRNA sequencing. PBMCs were aliquoted for cryopreservation and used for immunophenotyping using flow cytometry and natural killer (NK) activation assays. mRNA was isolated and sequenced from the whole blood of the same cohort and was used for differential pathways analysis using Gene Ontology (GO) database. GWAS summary results derived from the UK and the HUNT biobanks were also used for pathway analysis. Immunofluorescent staining was performed on the skin biopsies from the German cohort. (Created with BioRender.com.)
Figure 2:
Figure 2:
Differential abundance of immune cells in fibromyalgia syndrome (FMS). Single-cell data from the Cyto (A), Chemo (B), Treg (C), BMD (D), and the NK (E) flow cytometry panel were projected onto two dimensions using t-distributed UMAP. Cells were colored by their computed differentiation score, which depicts the degree of association with FMS, where the lighter the color, the more significant the association. The frequency differences between cases and controls are shown in the lower figure panels where red and blue represent increased and decreased frequencies in the cases, respectively. The p-values (displayed as log10P) were derived using the Wilcoxon Rank Sum test to quantify the extent of frequency differences between control and FMS groups. (F) Representative flow cytometry plots illustrating major NK cell subsets (CD56 bri and CD56 dim) between FMS case (yellow) and control (purple). Percentages represent the proportion of alive single CD3- CD14- CD19- cells
Figure 3:
Figure 3:
Differential states of natural killer (NK) cell subsets in fibromyalgia syndrome (FMS). The direction of differences in expression between case and control samples for CD16 (A), CD107a (B), TIGIT (C), CD96 (D), and CD226 (E). Red and blue represent increased and decreased expression in the cases, respectively. The p-values were derived using the Wilcoxon Rank Sum test to quantify the marker expression differences between control and FMS groups.
Figure 4:
Figure 4:
In-vitro natural killer (NK) cell activation in fibromyalgia syndrome (FMS) and control subjects. The NK cells were co-cultured with either Human Leukocyte Antigen null (HLA−/−) cell line (A, B, and C) or opsonized HIV+ cells (antibody-dependent NK activation, ADNKA assay, D, E, and F). Changes between unstimulated (UNSTIM) and stimulated (STIM) NK cells in the expression of NK activation markers, CCL4 (A and D), CD107a (B and E), and IFNγ (C and F) are shown. Purple and yellow boxplots represent controls and FMS cases, respectively. Whiskers represent the interquartile range and horizontal black lines represent group medians. Purple and yellow lines connect group means of controls and FMS cases, respectively. P-values represent the interaction term: condition x case-status of the mixed model with age, gender, and BMI as fixed effects, and, batch and sample ID as random effects. *p < 0.05 and ***p < 0.0001.
Figure 5:
Figure 5:
Enrichment of immune cell type activation pathways in fibromyalgia syndrome (FMS) patients compared to healthy controls. (A) Enrichment at the transcriptomics level, from RNA-seq data of whole blood from the Canadian cohort. (B) Enrichment at the genetics level, from the meta-analyzed genome-wide association studies in the UKB and the HUNT. Dashed blue lines represent FDR threshold of 10%. NK: natural killer; FDR: false discovery rate; reg.: regulation; act.: activation; Tc: cytotoxic T cells; Th: helper T cells; mDC: myeloid dendritic cells; NKT: NK-like T cells; γδ: gamma-delta; UKB: the UK biobank.
Figure 6:
Figure 6:
ULBP expression and NK cell recruitment at the dermal nerve fibers in fibromyalgia syndrome (FMS). (A, B) Representative immunostaining of the skin from (A) a control and (B) an FMS patient with nerve fibers stained with anti-PGP9.5 (red) and NK activation ligand stained with anti-ULBP (green). A high magnification image of the area in the white dashed box shows co-staining (marked with arrows) of PGP9.5 and ULBP in FMS but not in control. White dashed ovals show SEP. (C, D) Micro-images from a control (C) and an FMS patient (D) stained for PGP9.5 (green), nuclei (DAPI in blue), and CD56 (red). Arrows mark NK cells seen in the proximity of a SEP in FMS but not in controls. Boxplots showing the distribution of (E) ULBP+ SEP and (F) SEP with NK cells, stratified by case status. Whiskers represent the interquartile range and horizontal black lines represent group medians. (G-I) Correlation between (G) ULBP expression on SEP and NK cell recruitment at SEP; (H) ULBP expression on SEP and FSQ scores; (I) NK cell recruitment at SEP and FSQ scores. Purple and yellow depict controls (n=11) and FMS cases (n=17), respectively. Linear regression and its 95% confidence interval are shown as a black line and gray shaded area, respectively. P-values were calculated using Welch’s two-sample t-test and Spearman’s rank correlation. *p < 0.05 and **p < 0.01. FMS: fibromyalgia syndrome; ULBP: UL16 binding protein; SEP: Subepidermal plexus; NK: natural killer; FSQ: fibromyalgia survey questionnaire.
Figure 7:
Figure 7:
Heuristic model of natural killer (NK) cells’ contribution to fibromyalgia syndrome (FMS) pathogenesis. Compared to controls, FMS patients express the natural killer (NK) activation ligand(s) on the peripheral nerves. This promotes extravasation, recruitment, and activation of the circulated NK cells with subsequent chronic degeneration of the peripheral nerve. (Created with BioRender.com.)

References

    1. Adams EH, McElroy HJ, Udall M, Masters ET, Mann RM, Schaefer CP, Cappelleri JC, Clair AG, Hopps M, Daniel SR, Mease P, Silverman SL, Staud R. Progression of fibromyalgia: results from a 2-year observational fibromyalgia and chronic pain study in the US. J Pain Res 2016;9:325–336. - PMC - PubMed
    1. Allen NE, Sudlow C, Peakman T, Collins R, Biobank UK. UK biobank data: come and get it. Sci Transl Med 2014;6(224):224ed224. - PubMed
    1. Andres-Rodriguez L, Borras X, Feliu-Soler A, Perez-Aranda A, Angarita-Osorio N, Moreno-Peral P, Montero-Marin J, Garcia-Campayo J, Carvalho AF, Maes M, Luciano JV. Peripheral immune aberrations in fibromyalgia: A systematic review, meta-analysis and meta-regression. Brain Behav Immun 2020;87:881–889. - PubMed
    1. Arnold LM, Bennett RM, Crofford LJ, Dean LE, Clauw DJ, Goldenberg DL, Fitzcharles MA, Paiva ES, Staud R, Sarzi-Puttini P, Buskila D, Macfarlane GJ. AAPT Diagnostic Criteria for Fibromyalgia. J Pain 2019;20(6):611–628. - PubMed
    1. Banfi G, Diani M, Pigatto PD, Reali E. T Cell Subpopulations in the Physiopathology of Fibromyalgia: Evidence and Perspectives. Int J Mol Sci 2020;21(4). - PMC - PubMed

Publication types

LinkOut - more resources