. 2021 Dec 17;374(6574):1492-1496.
doi: 10.1126/science.abh4272. Epub 2021 Dec 16.

Supramammillary regulation of locomotion and hippocampal activity

Affiliations

Supramammillary regulation of locomotion and hippocampal activity

Jordan S Farrell et al. Science. .

Abstract

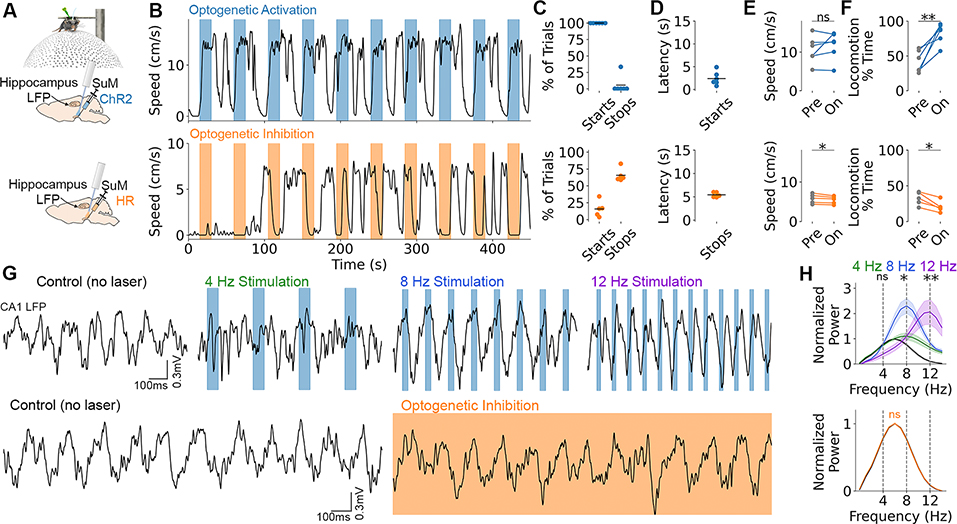
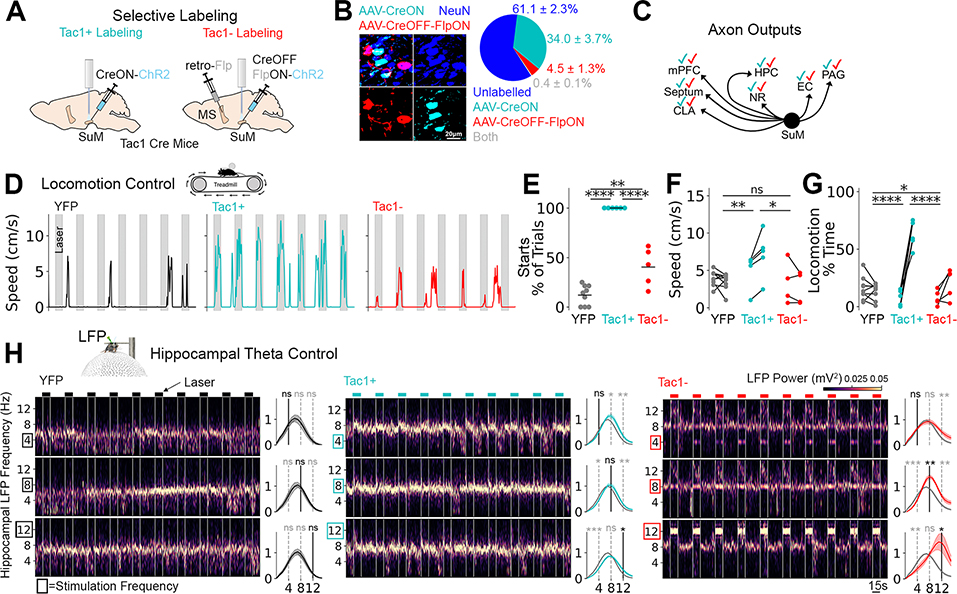
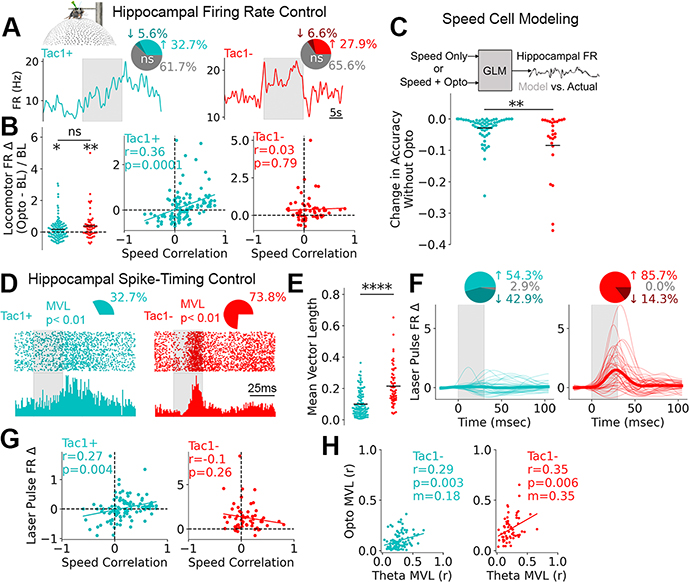
Locomotor speed is a basic input used to calculate one’s position, but where this signal comes from is unclear. We identified neurons in the supramammillary nucleus (SuM) of the rodent hypothalamus that were highly correlated with future locomotor speed and reliably drove locomotion when activated. Robust locomotion control was specifically identified in Tac1 (substance P)–expressing (SuMTac1+) neurons, the activation of which selectively controlled the activity of speed-modulated hippocampal neurons. By contrast, Tac1-deficient (SuMTac1−) cells weakly regulated locomotion but potently controlled the spike timing of hippocampal neurons and were sufficient to entrain local network oscillations. These findings emphasize that the SuM not only regulates basic locomotor activity but also selectively shapes hippocampal neural activity in a manner that may support spatial navigation.


Conflict of interest statement

Competing interests: M.J.S. is a scientific co-founder of Inscopix. GRIN lenses used in this studied were purchased from Inscopix

Figures

Fig. 1.
Fig. 1.. SuM representation of speed and hippocampal theta
A, Recording paradigm; data from using unrestrained rats (26), reanalyzed here for speed- and theta-related investigations. B, Example SuM unit (recorded by tetrodes) that positively correlates to speed (i.e. a speed cell). Inset represents these data as a scatter plot. C, Distribution of speed vs. firing rate Pearson r values. Pie chart shows percentage of units for positive (r=0.36±0.023, mean±sem), negative (r=−0.24±0.024), and non-significant cells (r=0.018±0.012). D, Distribution of temporal offsets for positive speed cells. sem=0.19. E, Two example SuM unit spiking activities. Orange cell shows phase-locked firing with respect to hippocampal theta whereas the grey cell does not. F, Quantification of theta-related firing for two example units from E. The top panel shows spike-field coherence and the bottom shows theta-rhythmic spiking. G, Units were clustered into theta cells based on quantification from F. H, Distribution of speed scores among clustered “theta cells” from G.
Fig. 2.
Fig. 2.. Optogenetic SuM modulation controls locomotion and hippocampal LFP
A, Pan-neuronal SuM activation with ChR2 (blue) or inhibition with HR (orange) in head-fixed mice on a floating ball. B, Bidirectional locomotor effect with SuM activation (top) and inhibition (bottom). Colored bars denote laser on. C, Percent of trials where locomotion was initiated or halted for ChR2 (top) and HR (bottom). D, Latency of start vs. stop response. E, Speed during locomotor epochs before (pre) and during (on) light delivery. ChR2, t5=−1.14, p=0.31; HR, t4=3.07, p=0.037. F, Percent of time spent locomoting before (pre) and during (on) light delivery. ChR2, t5=−4.84, p=0.0047; HR, t4=4.60, p=0.010. G, Top: optogenetic activation at 4, 8, or 12Hz compared to no laser control. Blue bars denote laser on. Bottom: optogenetic inhibition (orange shading) vs. no laser control. Scalebar applies across rows. H, Quantification of power spectrum changes normalized to no laser. Top (ChR2): 4Hz power at 4Hz stimulation, t5=0.86, p=0.43; 8Hz power at 8Hz stimulation, t5=5.18, p=0.0035; 12Hz power at 12Hz stimulation, t5=3.99, p=0.010. Bottom (HR): t4=0.043, p=0.97. Data are mean±sem.
Fig. 3
Fig. 3. Cell-type-dependence of locomotion initiation and LFP entrainment
A, Labeling strategy to target mutually exclusive populations based on Tac1. B, Investigation of labelling specificity. Left: Image showing AAV-labelled Tac1+ (CreON) and Tac1− cells (CreOFF-FlpON) among other NeuN+ cells in the SuM. Right: quantification. C, Schematic showing checkmarks of each color (cyan: SuMTac1+, red: SuMTac1−) if axons were found in SuM target regions (see fig. S9). D, Representative locomotor activity during optogenetic activation at 8Hz. E, Percent of trials with locomotion initiation. ANOVA F2,17=103.6, p<0.0001, Tukey post-test. F, Locomotor speed before (left) vs. laser on (right). ANOVA was performed to determine group differences on changes in speed (pre vs. on). F2,15=7.2, p=0.0064, Tukey post-test. G, Percent of time locomoting before (left) vs. laser on (right). Differences in response change was assessed by ANOVA F2,17=57.8, p<0.0001, Tukey post-test. H, Optogenetic stimulation while head-fixed on floating ball at 4, 8, or 12 Hz. Spectrogram (left) and power spectral density changes (right, off vs. on) for each condition (columns) at each frequency (rows). Paired t-tests performed on light off vs. light on. *p<0.05, **p<0.01, ***p<0.001, ****p<0.0001.
Fig. 4
Fig. 4. Hippocampal populations are differentially regulated by SuM cell-types
A, Data were obtained from head-fixed mice on floating ball. Mean firing rate changes from two example hippocampal cells during SuMTac1+ or SuMTac1− optogenetic activation (grey bar). Pie charts display proportion of units with significantly altered locomotor firing rates. B, Locomotor firing rate change for light on vs. off (one-sample t-test, SuMTac1+ t105=2.56, p=0.012; SuMTac1− t57=3.28, p=0.0017; between sample t-test, t163=1.69, p=0.09) and as a function of speed correlation (calculated while laser is off). Y-label applies to all panels. C, Generalized linear model of hippocampal speed cell FR, with two sets of input (speed only vs. speed + opto). Change in modelling accuracy when optogenetic information was withheld (t89=3.28, p=0.0015). D, Hippocampal spike raster plots with histogram aligned to laser pulses (grey bar) during 8Hz stimulation. Pie charts show the proportion of units with significantly laser-modulated spike distributions. E, Quantification of non-uniform spike distributions from D. t-test t167=7.39, p=6.8×10¹². F, Smoothed spike histograms of significantly laser-modulated cells. Thin lines are individual cells. Thick line is mean. Pie chart shows the directionality of modulation. G, Laser pulse-triggered firing rate change plotted against cells’ speed correlations (calculated while laser is off). H, Firing rate modulation by spontaneous theta vs. optogenetic laser pulses. Lines in B, G and H represent linear fits.

References

    1. O’Keefe J, Nadel L, The hippocampus as a cognitive map (Oxford: Clarendon Press, 1978).
    1. Vanderwolf CH, Electroencephalogr. Clin. Neurophysiol. 26, 407–418 (1969). - PubMed
    1. Foster TC, Castro CA, McNaughton BL, Science 244, 1580–1582 (1989). - PubMed
    1. Fuhrmann F, et al. Neuron, 86, 1253–1264 (2015). - PubMed
    1. Colgin LL, Mechanisms and functions of theta rhythms. Annu. Rev. Neurosci. 36, 295–312 (2013). - PubMed

Publication types