. 2021 Dec 17;374(6574):abg8871.
doi: 10.1126/science.abg8871. Epub 2021 Dec 17.

Pangenomics enables genotyping of known structural variants in 5202 diverse genomes

Affiliations

Pangenomics enables genotyping of known structural variants in 5202 diverse genomes

Jouni Sirén et al. Science. .

Abstract

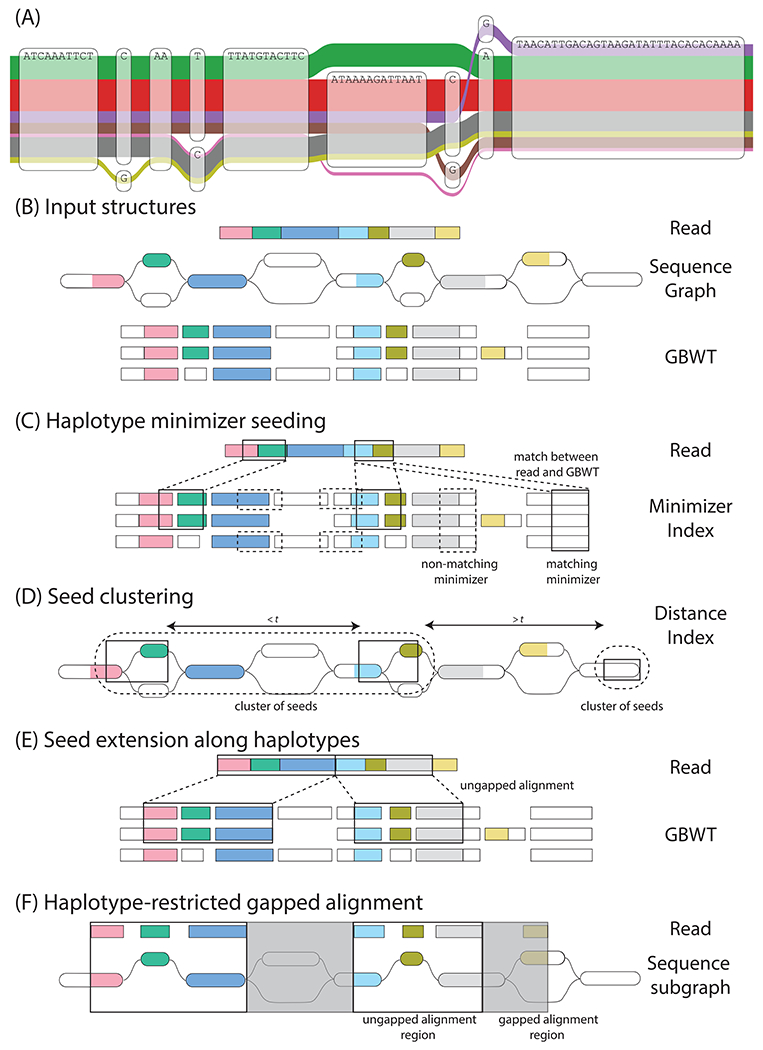
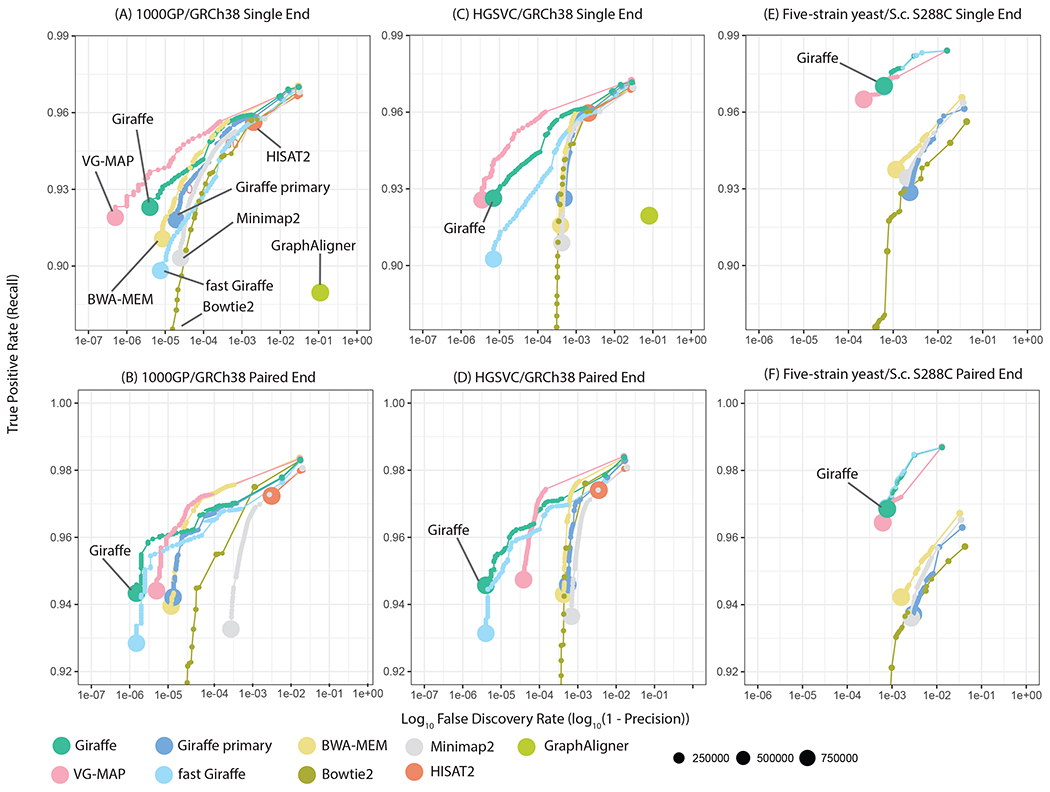
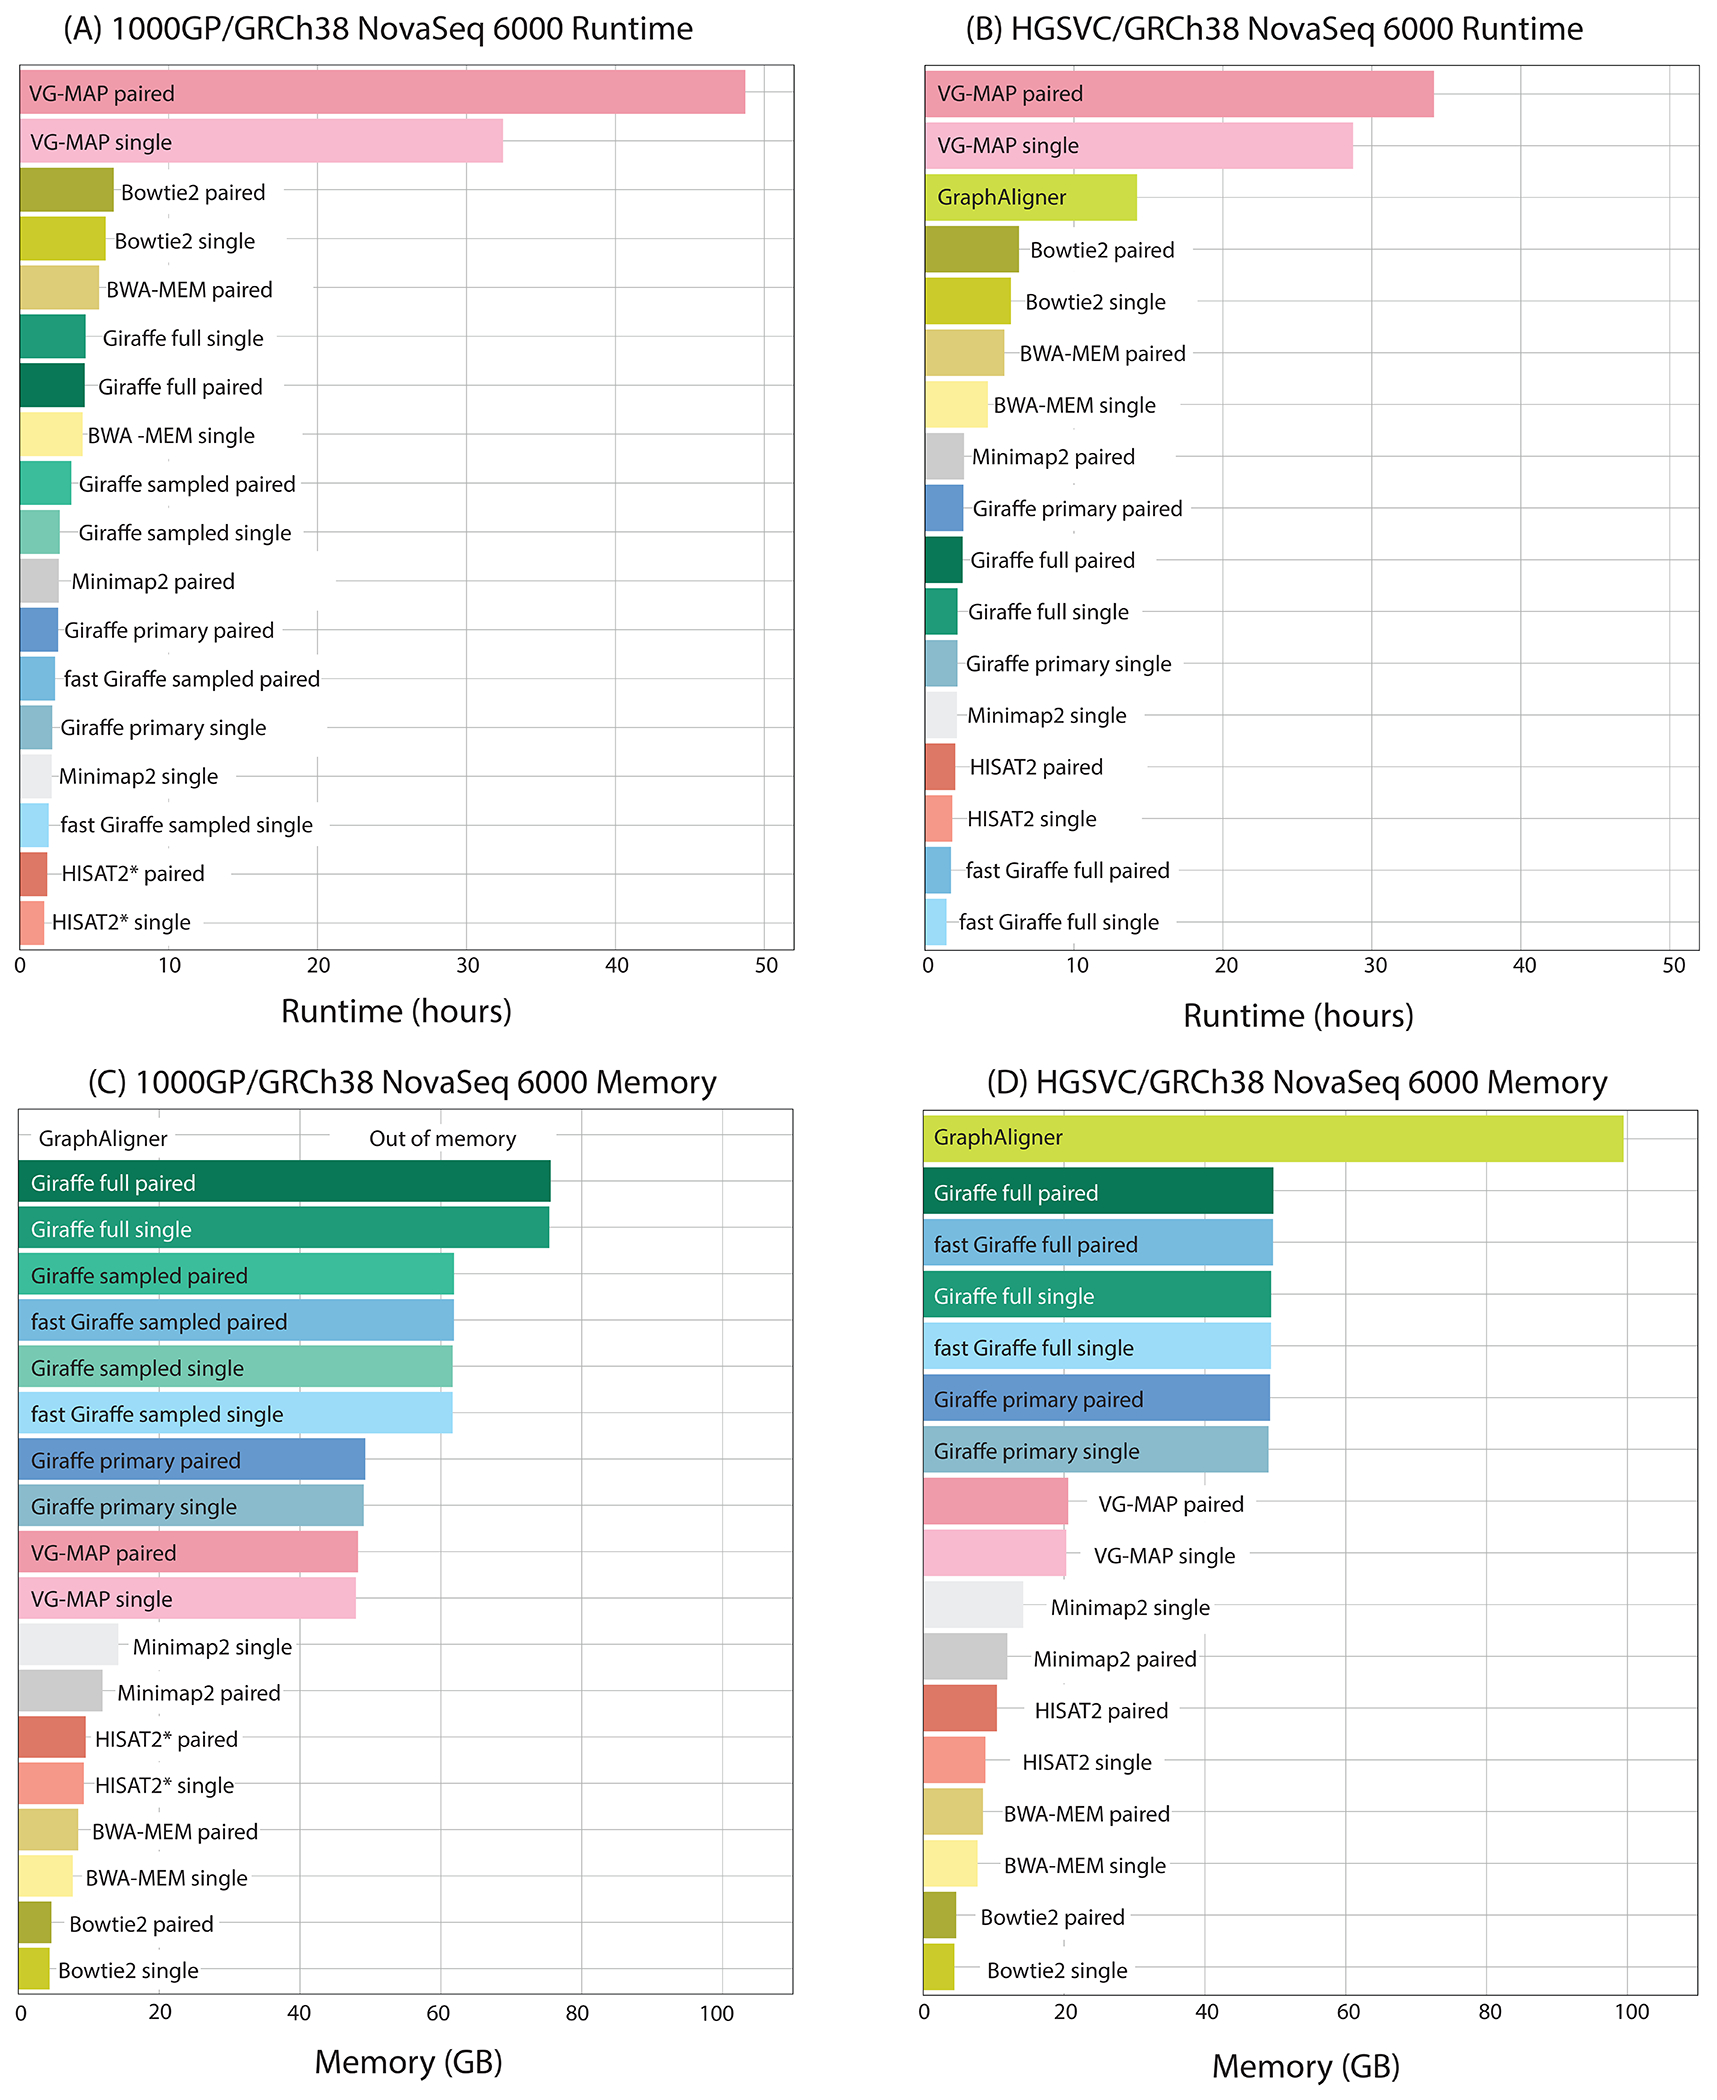
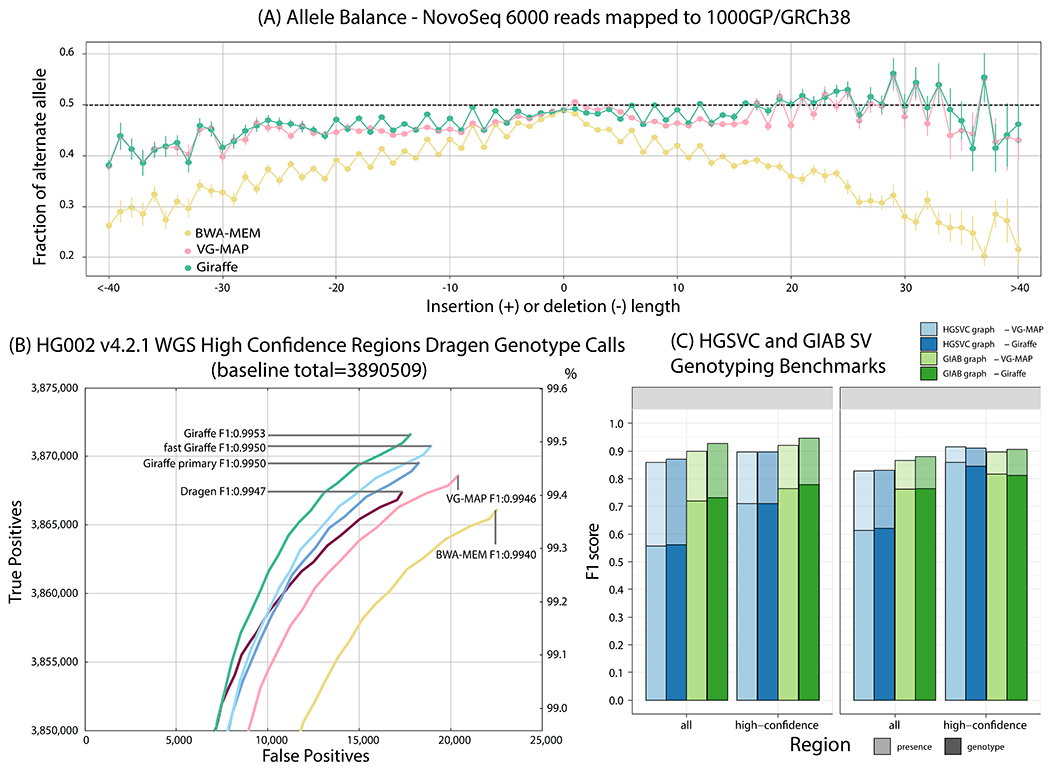
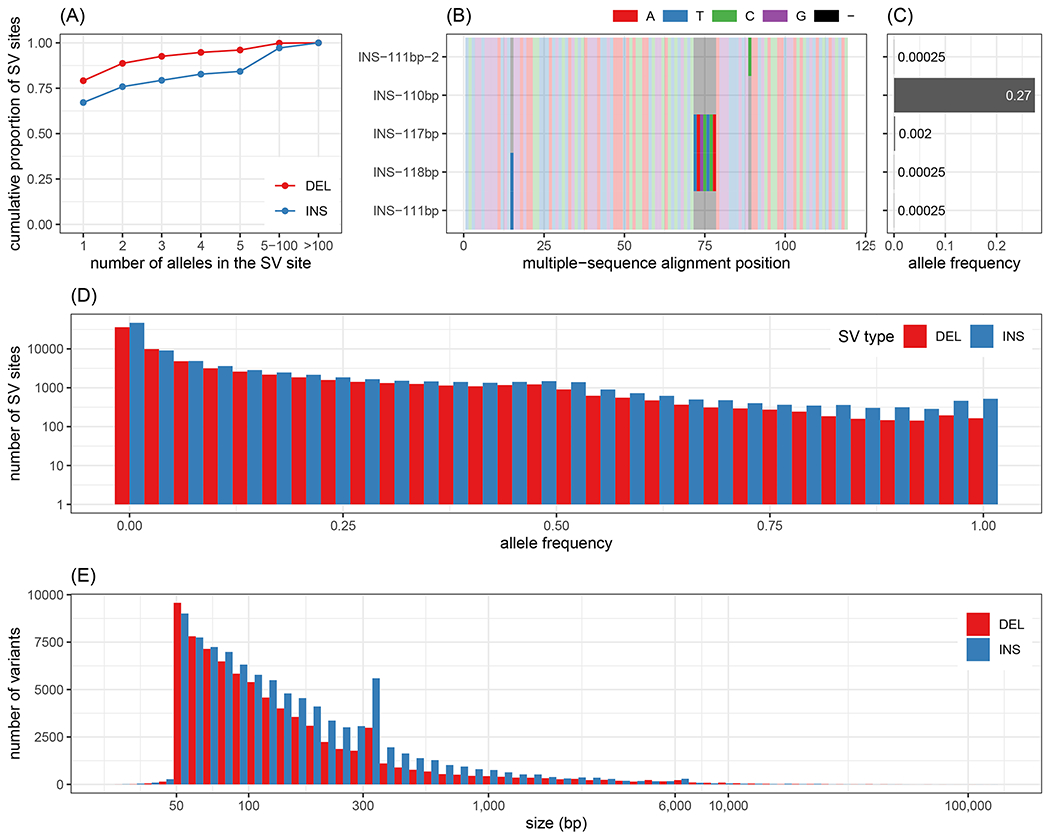
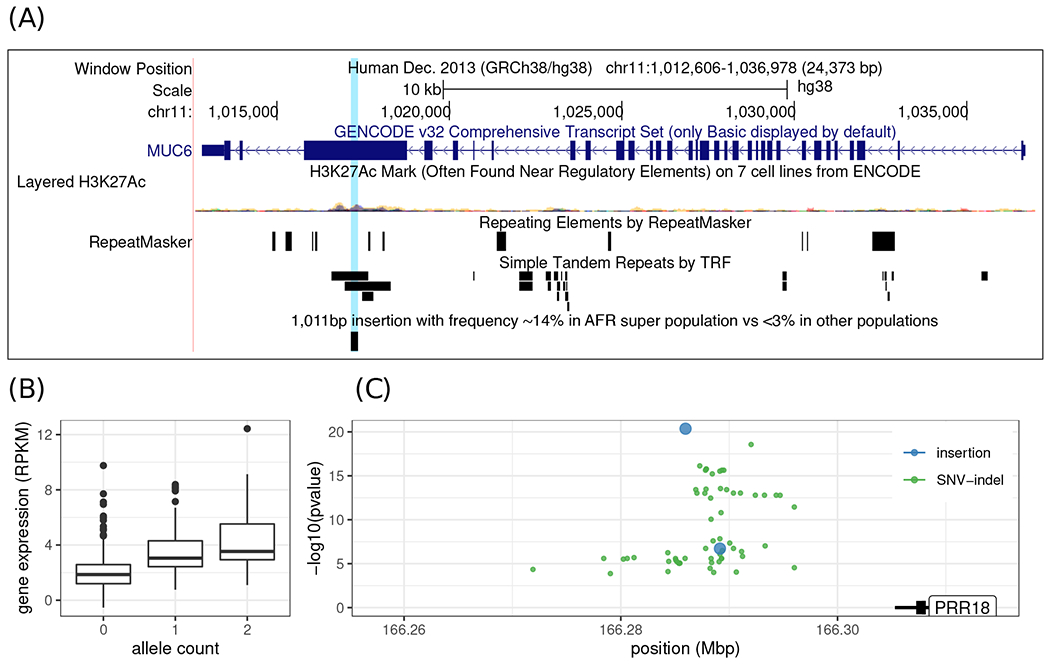
We introduce Giraffe, a pangenome short-read mapper that can efficiently map to a collection of haplotypes threaded through a sequence graph. Giraffe maps sequencing reads to thousands of human genomes at a speed comparable to that of standard methods mapping to a single reference genome. The increased mapping accuracy enables downstream improvements in genome-wide genotyping pipelines for both small variants and larger structural variants. We used Giraffe to genotype 167,000 structural variants, discovered in long-read studies, in 5202 diverse human genomes that were sequenced using short reads. We conclude that pangenomics facilitates a more comprehensive characterization of variation and, as a result, has the potential to improve many genomic analyses.


Conflict of interest statement

Competing interests

P.C. and A.C. are employees of Google and own Alphabet stock as part of the standard compensation package. The remaining authors declare no competing interests.

Figures

Figure 1.
Figure 1.
Haplotype mapping. (A) A region of the CASP12 gene in the 1000GP graph (17), illustrating complex local variation. The observed haplotypes (the colored ribbons of width log-proportional to population frequency) represent only a subset of the possible paths through the graph. (B-F) An overview of Giraffe. (B) Input structures: Giraffe takes as input each read to map, the sequence graph reference to map against, and the GBWT of known haplotypes to restrict to. The input read is represented as a series of colored rectangles. The haplotype sequences in the GBWT are similarly represented as series of rectangles, split according to the nodes they correspond to in the sequence graph. Nodes in the sequence graph and haplotypes in the GBWT are colored according to homology with the read. (C) Haplotype minimizer seeding: Seeds are identified using an index of minimizers (subsets of sequences of specified length k) (53) over the sequences of all the GBWT haplotypes. A matching minimizer between the read and the GBWT haplotypes constitutes a seed. The minimizers (black boxes) in the read are enumerated and the matching minimizers in the haplotypes are identified using the minimizer index. (D) Seed clustering: Minimizer instances in the graph are clustered by the minimum graph distance (t, measured in nucleotides) between them (54). (E) Seed extension along haplotypes: Minimizers in high scoring clusters are extended linearly to form maximal gapless local alignments. (F) Haplotype-restricted gapped alignment: Giraffe is designed on the assumption that, for most reads, it will be possible to gaplessly extend seed alignments all the way to the ends of the read, allowing the algorithm to stop at the previous step. However, any remaining gaps in the alignment between read and graph are resolved by gapped alignment in this final step.
Figure 2.
Figure 2.
Simulated read mapping. Each panel shows recall vs. FDR (false discovery rate, or 1 minus precision) for a simulated read mapping experiment, comparing Giraffe to linear genome mappers (BWA-MEM, Bowtie2, Minimap2) and other genome graph mappers (VG-MAP, GraphAligner, HISAT2). Reads were simulated to match ~ 150 bp Illumina NovaSeq (for human) or HiSeq 2500 (for yeast) reads, either as single-ended reads (A-C) or as paired-end reads (D-F) (17). Results for each mapper are shown stratified by reported read mapping quality; the size of each point represents the log-scaled number of reads with the corresponding mapping quality. Three different mapping scenarios are assessed: (A,D) Comparing mapping to a graph derived from the 1000GP data to mapping to the linear reference genome assembly upon which it is based (GRCh38). (B,E) Comparing mapping to a graph containing larger structural variants from the HGSVC project to mapping to the GRCh38 assembly upon which it is based. (C,F) Comparing mapping to a multiple sequence alignment based yeast graph to mapping to the single S.c. S288C linear reference, for reads from the DBVPG6044 strain. For mapping with Giraffe, we used the full GBWT containing 6 haplotypes to map to the HGSVC graph and the 64-haplotype sampled GBWT to map to the 1000GP graph. “Giraffe primary” represents mapping with Giraffe to the linear reference.
Figure 3.
Figure 3.
Runtime and memory usage. Total runtime (A,B) and peak memory use (C,D) for mapping ~600 million NovaSeq 6000 reads using 16 threads. Reads were mapped (A,C) to the 1000GP derived graph or (for linear mappers) the GRCH38 assembly, and (B, D) to the HGSVC graph or GRCh38 reference, respectively. HISAT2*: results are shown for the subset 1000GP graph (22). Giraffe full refers to mapping using the full GBWT of all haplotypes. Giraffe sampled refers to mapping using the 64-haplotype sampled GBWT.
Figure 4.
Figure 4.
Evaluating Giraffe for genotyping. (A) The fraction of alternate alleles in reads detected for heterozygous variants in NA19239. Reads were mapped to the 1000GP graph with Giraffe and VG-MAP and to GRCh38 with BWA-MEM, and the fraction of reads supporting reference or alternate alleles was found for each indel length. (B) Assessing true positive and false positive genotypes made using the Dragen genotyper with mappings from Giraffe and other mappers. The line labeled Dragen represents the mapper included with the Dragen system itself. (C) Comparing Giraffe to VG-MAP for typing large insertions and deletions. “Presence” (lighter bars) evaluates the detection of SVs without regard to genotype; “genotype” (darker bars) requires the SV to be detected and its genotype to agree with the truth genotype. The y-axis shows the F1 score. For the HGSVC benchmark, we define high-confidence regions as regions not overlapping simple-repeats and segmental duplications. For the Genome in a Bottle consortium (GIAB) benchmark, we use the set high-confidence regions provided by GIAB.
Figure 5.
Figure 5.
Structural variants in the Multi-Ethnic Study of Atherosclerosis (MESA) cohort. (A) Cumulative proportion of SV sites depending on the maximum number of alleles (x-axis) in the site. (B-C) illustrates an insertion site with 5 alleles. The alleles differ by 3 nested indels as shown by the multiple sequence alignment of the inserted sequences represented in (B). Only one allele is frequent in the population (AF=0.27) as highlighted by (C). (D) Allele frequency distribution of the major allele for each SV site. The y-axis, showing the number of SVs, is log-scaled. (E) Size distribution of the major allele for each SV site.
Figure 6.
Figure 6.
Population-specific structural variant and SV-eQTL in the 1000 Genomes Project dataset. (A) Example of an insertion at appreciable frequency (~ 14%) in the AFR super population while rare (< 3%) in the other super populations. The variant is a 1,011 bp expansion of a VNTR in the coding sequence of the MUC6 gene. (B-C) Association between a 10,083 bp insertion overlapping a predicted enhancer and the gene expression of the PRR18 gene. (B) Each allele is associated with an increase in gene expression. (C) shows the position of significant eQTLs (SNV/indels in green, insertions in blue). All the eQTLs are in the intergenic region downstream of the PRR18 gene. The y-axis represents the significance of the association, with the top eQTL being the highest point. Of note, the lead eQTL (the 10,083 bp insertion) overlaps a region predicted to be an enhancer by ENCODE.

References

    1. Zook JM, et al., Nature Biotechnology 38, 1347 (2020). - PMC - PubMed
    1. Mahmoud M, et al., Genome Biology 20, 1 (2019). - PMC - PubMed
    1. Ebler J, Schönhuth A, Marschall T, Bioinformatics 33, 4015 (2017). - PubMed
    1. Church DM, et al., PLOS Biology 9, e1001091 (2011). - PMC - PubMed
    1. The Computational Pan-Genomics Consortium, Briefings in Bioinformatics 19, 118 (2016). - PMC - PubMed

Publication types

Supplementary concepts

Grants and funding