. 2021 Dec 16;19(12):e3001480.
doi: 10.1371/journal.pbio.3001480. eCollection 2021 Dec.

Mutations in LRRK2 linked to Parkinson disease sequester Rab8a to damaged lysosomes and regulate transferrin-mediated iron uptake in microglia

Affiliations

Mutations in LRRK2 linked to Parkinson disease sequester Rab8a to damaged lysosomes and regulate transferrin-mediated iron uptake in microglia

Adamantios Mamais et al. PLoS Biol. .

Erratum in

Abstract

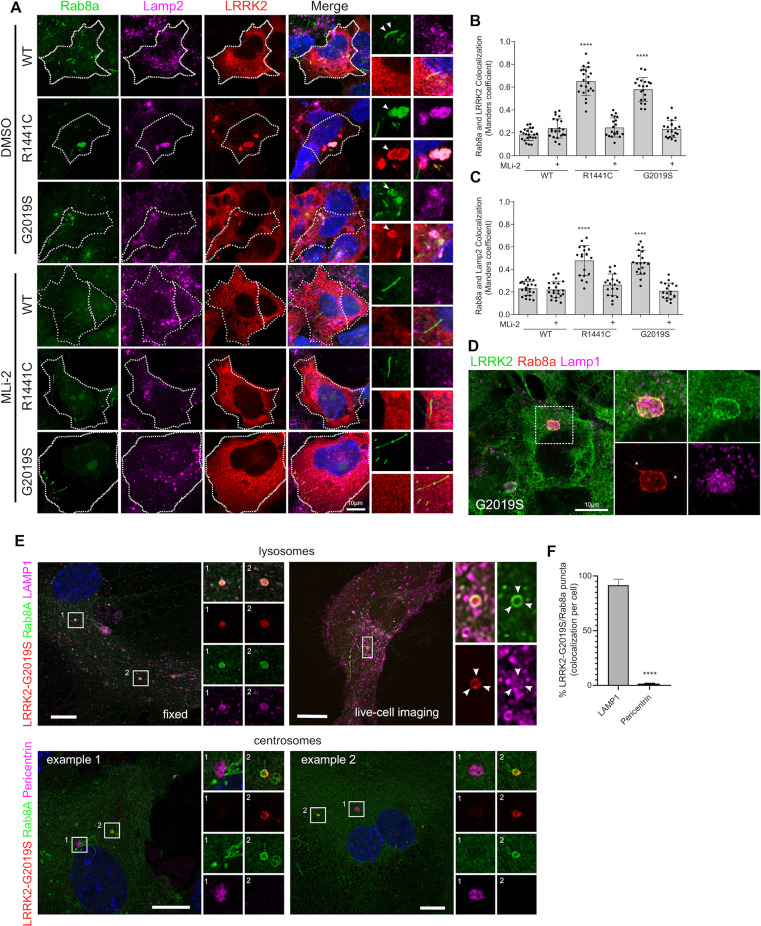
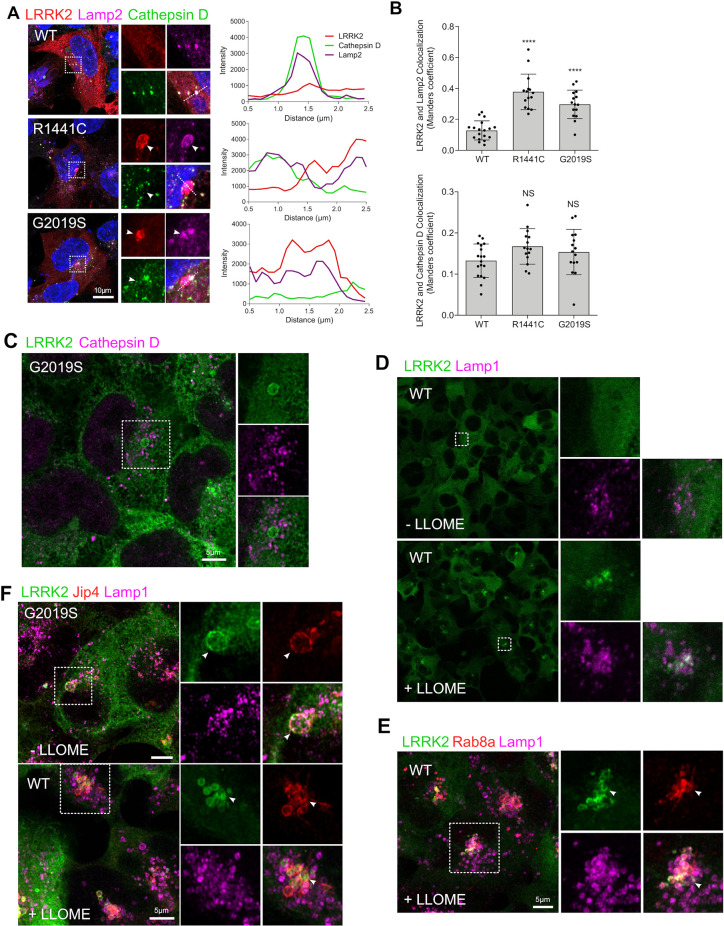
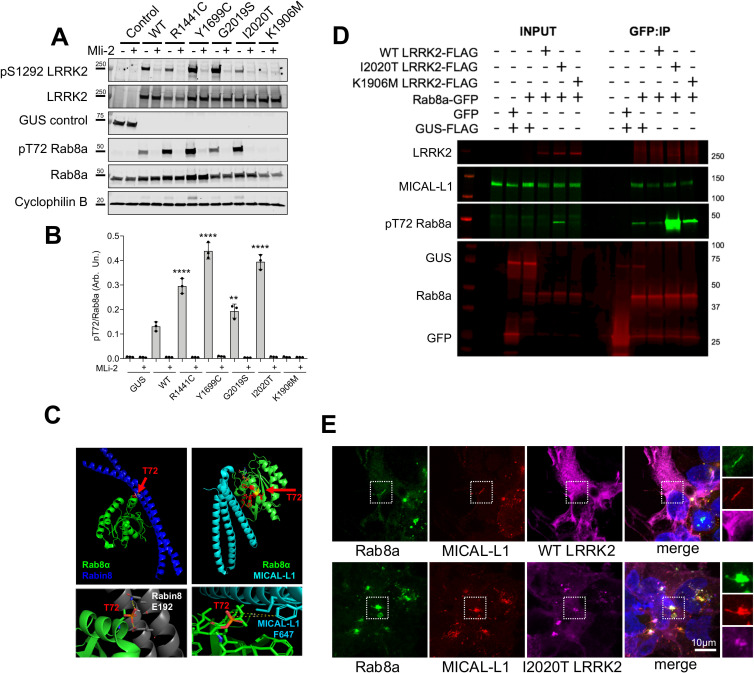
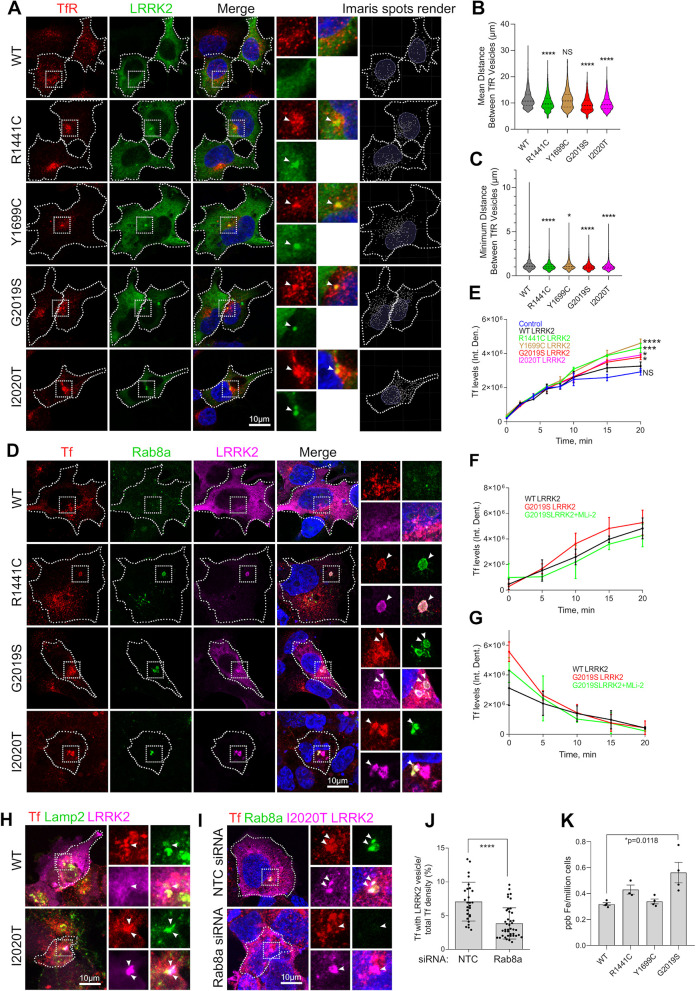
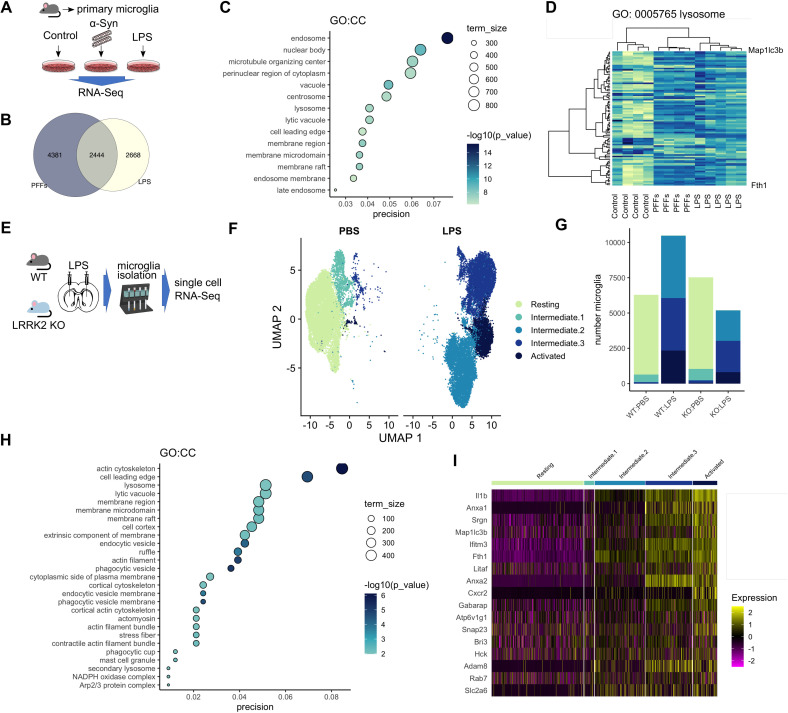
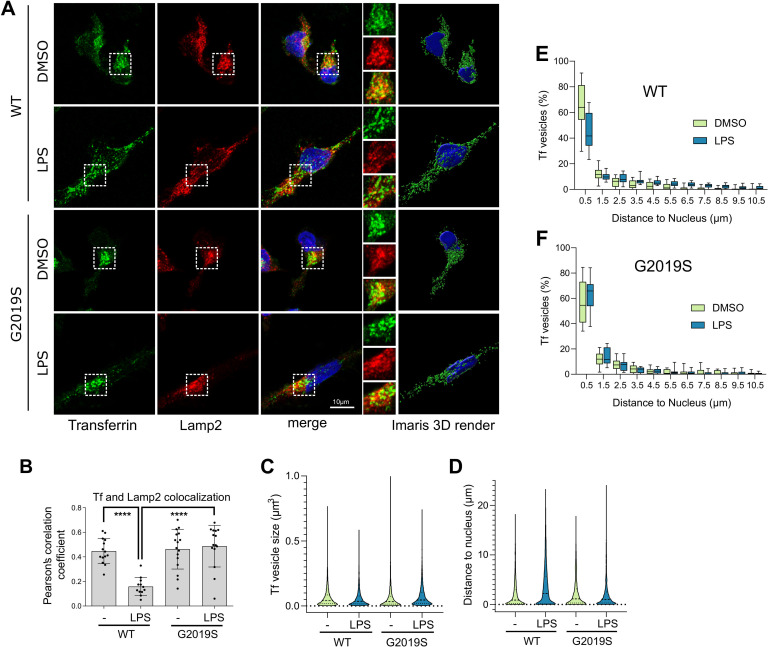
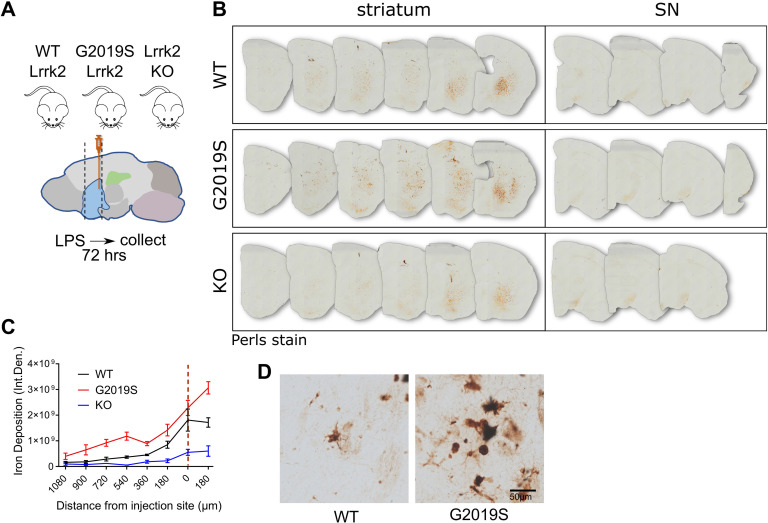
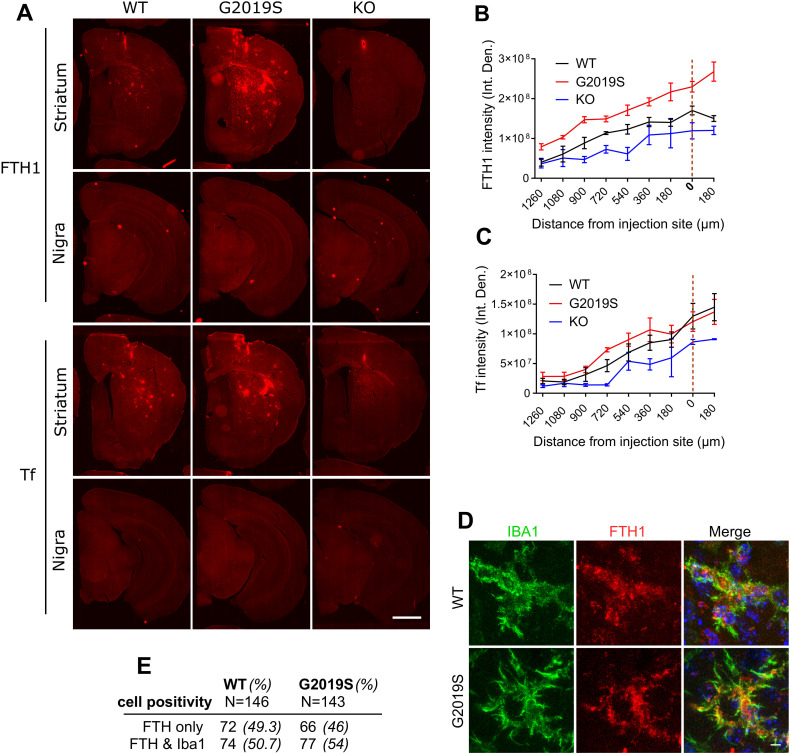
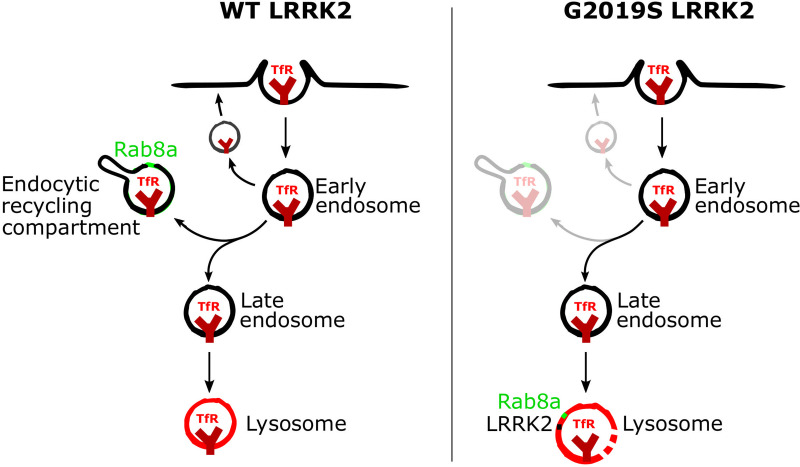
Mutations in leucine-rich repeat kinase 2 (LRRK2) cause autosomal dominant Parkinson disease (PD), while polymorphic LRRK2 variants are associated with sporadic PD. PD-linked mutations increase LRRK2 kinase activity and induce neurotoxicity in vitro and in vivo. The small GTPase Rab8a is a LRRK2 kinase substrate and is involved in receptor-mediated recycling and endocytic trafficking of transferrin, but the effect of PD-linked LRRK2 mutations on the function of Rab8a is poorly understood. Here, we show that gain-of-function mutations in LRRK2 induce sequestration of endogenous Rab8a to lysosomes in overexpression cell models, while pharmacological inhibition of LRRK2 kinase activity reverses this phenotype. Furthermore, we show that LRRK2 mutations drive association of endocytosed transferrin with Rab8a-positive lysosomes. LRRK2 has been nominated as an integral part of cellular responses downstream of proinflammatory signals and is activated in microglia in postmortem PD tissue. Here, we show that iPSC-derived microglia from patients carrying the most common LRRK2 mutation, G2019S, mistraffic transferrin to lysosomes proximal to the nucleus in proinflammatory conditions. Furthermore, G2019S knock-in mice show a significant increase in iron deposition in microglia following intrastriatal LPS injection compared to wild-type mice, accompanied by striatal accumulation of ferritin. Our data support a role of LRRK2 in modulating iron uptake and storage in response to proinflammatory stimuli in microglia.


Conflict of interest statement

The authors have declared that no competing interests exist.

Figures

Fig 1
Fig 1. Pathogenic mutations of LRRK2 sequester endogenous Rab8a to lysosomes in a kinase-dependent manner.
(A) Representative confocal images of HEK293T cells transiently expressing FLAG-tagged WT, R1441C, or G2019S LRRK2 constructs, stained for FLAG LRRK2, endogenous Rab8a, and endogenous Lamp2. Cells were treated with 1 μM MLi-2 for 1 hour or DMSO prior to staining, 24 hours posttransfection. (B, C) Quantification of Manders colocalization coefficient between Rab8a, LRRK2, and Lamp2 (B, C: N > 20 cells for each group across 2 independent experiments, ****P < 0.0001, one-way ANOVA with Tukey post hoc test; B: F (5, 120) = 108.9; C: F (5, 120) = 35.85). (D) Superresolution confocal image of endogenous Rab8a and overexpressed G2019S LRRK2 localizing at the lysosomal membrane. (E) Mouse primary astrocytes were transfected with HaloTag-LRRK2(G2019S), GFP-Rab8a, and LAMP1-RFP (top panels). Cells were incubated with JFX650 (100 nM) for 1 hour, washed, and imaged using a Nikon SoRa spinning disk microscope utilizing 3D Landweber deconvolution, 48 hours later. To analyze Rab8a localization to centrosomes, fixed cells were stained for pericentrin, following transient expression of G2019S LRRK2 and GFP-Rab8a. Images were taken with Airyscan (bottom panels). (F) Quantitation of the percentage of LRRK2/Rab8a puncta per cell that colocalizes with either LAMP1 or Pericentrin (N > 19 cells for each condition from 2 independent experiments; unpaired t test; P < 0.0001). The underlying data can be found in S1 Data. LRRK2, leucine-rich repeat kinase 2; WT, wild-type.
Fig 2
Fig 2. LRRK2 and Rab8a are recruited to the membrane of damaged lysosomes.
(A) HEK293T cells transiently expressing FLAG-tagged WT, R1441C, or G2019S LRRK2 for 24 hours were stained for FLAG LRRK2, Lamp2, and Cathepsin D and analyzed by confocal microscopy. Staining intensity profiles were generated on sections indicated by the dotted lines. (B, C) Manders colocalization coefficient of LRRK2 versus Lamp2 or Cathepsin D staining (N > 20 cells per group across 2 independent experiments, ****P < 0.0001, one-way ANOVA with Tukey post hoc; Lamp2: F (5, 57) = 41.73; Cathepsin D: NS). (C) Superresolution image of HEK293T cells stably expressing GFP G2019S LRRK2 costained for Cathepsin D. HEK293T cells stably expressing GFP WT LRRK2 were treated with 1 mM LLOMe for 4 hours and stained for endogenous Lamp1 (D) and Rab8a (E). (F) GFP WT and G2019S expressing cells were treated with LLOMe as in (E) and stained for Jip4 and Lamp1 prior to imaging by superresolution microscopy. The underlying data can be found in S1 Data. LRRK2, leucine-rich repeat kinase 2; WT, wild-type.
Fig 3
Fig 3. Rab8a phosphorylation retains interaction with MICAL-L1 that is corecruited in mutant LRRK2 expressing cells.
(A) HEK293T cells expressing control (GUS), FLAG WT, or mutant LRRK2 variants were treated with MLi-2 prior to lysis and analysis by western blotting for pS1292 and total LRRK2, as well as pT72 and total Rab8a. (B) Quantification of pT72 Rab8a levels normalized to total Rab8a (B, two-way ANOVA; N = 3 independent experiments; treatment: P < 0.0001, F (1, 28) = 1473, genotype: P < 0.0001, F (6, 28) = 157.1). (C) Structural modeling of T72 phosphorylation on Rab8a in association with Rabin8 or MICAL-L1. T72 is between 2.8–9.9 Å from the closest glutamate on Rabin8 and 6.7–8.4 Å from the closest phenylalanine on MICAL-L1. (D) HEK293T cells expressing FLAG WT, I2020T, or K1906M LRRK2 along with GFP Rab8a, GFP control, or FLAG-GUS control were lysed and proteins immunoprecipitated using GFP beads. Co-immunoprecipitated proteins were analyzed by western blotting probed for MICAL-L1 as well as pT72 and total Rab8a. (E) Cells expressing FLAG WT or I2020T LRRK2 were stained for endogenous Rab8a and MICAL-L1 and analyzed by confocal microscopy. The underlying data can be found in S1 Data. LRRK2, leucine-rich repeat kinase 2; WT, wild-type.
Fig 4
Fig 4. Mutant LRRK2 sequesters TfR and dysregulates transferrin recycling.
(A) HEK293T cells exogenously expressing WT and mutant LRRK2 constructs were stained for TfR and visualized by superresolution microscopy. TfR vesicles were analyzed using the Imaris Spot Detection module, and the mean and minimum distances between spots were plotted (B, C). (N > 2,000 vesicles were counted in at least 20 cells per construct from 2 independent experiments, *P < 0.05, ****P < 0.0001, one-way ANOVA with Tukey post hoc, B: F(4, 13334) = 46.14, C: F (4, 13336) = 194.1). (D) HEK293FT cells expressing LRRK2 genetic variants were incubated with Alexa Fluor 568–conjugated transferrin, fixed at 20 minutes of incubation and stained for endogenous Rab8a and FLAG LRRK2 (D). (E) Uptake of Alexa Fluor 568–conjugated transferrin was monitored by high-content imaging, and transferrin levels per cell were plotted at different time points (E: T = 20 minutes, N = 3 technical replicates per construct (>800 cells/well) one-way ANOVA, Tukey post hoc, *P < 0.05, ***P = 0.0005, ****P = < 0.0001). (F) HEK293T cells exogenously expressing FLAG WT or G2019S LRRK2 constructs were incubated in DMEM supplemented with 1 μM MLi-2 or DMSO for 45 minutes prior to addition of Alexa Fluor 568–conjugated transferrin in the same media, and high-content imaging was used to monitor Tf uptake at different time points (F: N = 3 technical replicates per construct (>800 cells/well), two-way ANOVA, genotype: P < 0.05, F (2,30) = 3.575; Time: P < 0.0001, F (4, 30) = 44.96). (G) Cells were treated with MLi-2 as in (F), and incubated with Alexa Fluor–conjugated transferrin for 30 minutes, prior to changing to fresh media containing MLi-2 and monitoring transferrin release by high-content imaging (G; at T10: N = 3 technical replicates per construct (>800 cells/well), one-way ANOVA, Tukey post hoc, P < 0.05, F (2, 30) = 3.575). (H) HEK293T cells transiently expressing WT or I2020T LRRK2 were stained for Tf, Lamp2, and LRRK2 (FLAG) and analyzed by confocal microscopy. (I, J) Cells were transfected with Rab8a siRNA or scrambled sequence constructs (control) and 24 hours later were transfected with I2020T LRRK2 that was expressed overnight, before fixation and staining for Tf, Rab8a, and LRRK2 (FLAG). (N = 27 cells for NTC siRNA, N = 41 cells for Rab8a siRNA imaged across 2 independent experiments, two-tailed Mann–Whitney U test, ****P < 0.0001). Intracellular iron levels were analyzed by ICP-MS in cells stably expressing GFP WT or mutant LRRK2 constructs (K) (N = 4 confluent plates of cells per construct, two-way ANOVA with Tukey post hoc, *P = 0.018, F (3, 11) = 6.225). [SD bars are shown]. The underlying data can be found in S1 Data. ICP-MS, inductively coupled plasma mass spectrometry; LRRK2, leucine-rich repeat kinase 2; siRNA, small interfering RNA; TfR, transferrin receptor; WT, wild-type.
Fig 5
Fig 5. Neuroinflammation remodels endolysosomal gene expression in microglia, in vitro and in vivo.
(A) Outline of RNA-Seq experiment: Primary mouse microglia cultures were incubated with LPS or α-synuclein fibrils, and transcriptomic profiles were analyzed by RNA-Seq. (B) Common and distinct hits were detected between the LPS and PFF-treated groups. (C) Bubble plot showing GO:CC term enrichment in the shared hits from LPS and PFF-treated primary microglia highlights enrichment for endolysosomal processes. (D) Unsupervised hierarchical clustering shows that the treated groups cluster together suggesting common transcriptomic profiles. (E) Schematic of the in vivo experiment where LPS striatal injections were administered to WT and LRRK2 KO mice, followed by microglia isolation and single-cell RNA-Seq. (F) UMAP plot showing separation of the retrieved microglia in distinct groups of activation states. (G) Microglia from LPS-injected animals spanned the activation states, while PBS-injected animals gave predominantly resting microglia. (H) Lysosomal and endocytic mechanisms as well as cytoskeletal pathways are enriched in the cumulative data. (I) Heatmap showing clustering of microglia in distinct activation states highlighting increase in lysosomal and iron-related gene expression by inflammation. The underlying data have been deposited in NCBI’s GEO [75] and are accessible through GEO accession numbers GSE186483 and GSE186559. GEO, Gene Expression Omnibus; KO, knockout; LRRK2, leucine-rich repeat kinase 2; LPS, lipopolysaccharide; PFF, preformed fibril; scRNA-Seq, single-cell RNA-Seq; WT, wild-type.
Fig 6
Fig 6. G2019S LRRK2 modulates Tf recycling in iPSC-derived human microglia.
(A) iPSC-derived human microglia from WT or G2019S LRRK2 carriers were treated with LPS, and the localization of endogenous Tf and Lamp2 was analyzed by superresolution microscopy and the Imaris Surface render module (A). Partial colocalization between Tf and Lamp2 was observed in control that was significantly decreased with LPS treatment in WT cells but not in G2019S LRRK2 cells that retained lysosomal association of Tf (B) (N > 12 cells per group from 2 differentiations, one-way ANOVA Tukey post hoc, ****P < 0.0001, F(3,53) = 16.16). G2019S LRRK2 iPSC microglia exhibited larger Tf vesicles compared to WT while LPS treatment induced a decrease in average vesicle size in both cohorts (C) (minimum 3,000 vesicles were counted from 16 cells per group from 2 differentiations, two-way ANOVA, genotype: P < 0.0001, F(1,17753) = 16.38, treatment: P < 0.0001, F(1,17753) = 20.57). LPS treatment induced an increase in the average distance of Tf vesicles from the nucleus in WT cells but that was not significant in G2019S LRRK2 cells (D) (minimum 3,000 vesicles were counted from 16 cells per group from 2 differentiations, two-way ANOVA, genotype: P < 0.0001, F(1,14735) = 104.9, treatment: P < 0.0001, F (1, 14735) = 105.0). The frequency distributions of Tf vesicle proximity to the nucleus were plotted in E and F. The percentage of Tf vesicles proximal to the nucleus was significantly decreased with LPS treatment in WT but not in G2019S LRRK2 cells (E, F) (E: bin at 0.5 μm, two-tailed Student t test; Mann–Whitney U post hoc; **P = 0.0022; F: bin at 0.5 μm, two-tailed Student t test; Mann–Whitney U post hoc; NS). The underlying data can be found in S1 Data. iPSC, induced pluripotent stem cell; LPS, lipopolysaccharide; LRRK2, leucine-rich repeat kinase 2; Tf, transferrin; WT, wild-type.
Fig 7
Fig 7. G2019S LRRK2 induces iron accumulation in inflammatory microglia in vivo.
(A) Schematic of experimental design: WT, G2019S knock-in, and Lrrk2 KO mice were administered intrastriatal injections of LPS, and 72 hours later, brains were collected and stained by Perls stain. (B, C) G2019S LRRK2 knock-in mice exhibited significantly higher iron deposition in the striatum proximal to the injection site compared to WT and Lrrk2 KO, while minimal signal was detected in the SN in all groups (N = 4 WT mice, 4 G2019S and 2 Lrrk2 KO; two-way ANOVA, Tukey post hoc, Genotype: ***P = 0.0007, F (2, 7) = 24.70, Distance from injection site: ****P < 0.0001, F (7, 49) = 32.28). High-magnification images revealed iron deposition in inflammatory microglia (D). [SEM bars are shown]. The underlying data can be found in S1 Data. KO, knockout; LPS, lipopolysaccharide; LRRK2, leucine-rich repeat kinase 2; SN, substantia nigra; WT, wild-type.
Fig 8
Fig 8. Inflammation induces ferritin accumulation in microglia in G2019S LRRK2 knock-in mice.
FTH and Tf were stained and visualized in collected brains, 72 hours after post-intrastriatal injections of LPS. G2019S LRRK2 mice exhibited higher levels of FTH across the striatum compared to WT and Lrrk2 KO mice while Tf was not altered significantly in the knock-in (A, B, C) (N = 4 WT mice, 4 G2019S and 2 Lrrk2 KO; B: two-way ANOVA, Tukey post hoc, Genotype: **P = 0.0017, F (2, 7) = 18.27, Distance from injection site: ****P < 0.0001, F (8, 56) = 50.25; C: two-way ANOVA, Tukey post hoc, Genotype: P = 0.1040, F (2, 7) = 3.182, Distance from injection site: ****P < 0.0001, F (8, 56) = 29.17). Microglia are positive for FTH in both WT and G2019S LRRK2 cohorts (D). Similar percentages of FTH-positive microglia were observed between the WT and G2019S LRRK2 groups (E). [SEM bars are shown]. The underlying data can be found in S1 Data. FTH, ferritin heavy chain; KO, knockout; LPS, lipopolysaccharide; LRRK2, leucine-rich repeat kinase 2; Tf, transferrin; WT, wild-type.
Fig 9
Fig 9. A model of the recruitment of Rab8a to lysosomes and dysregulation of transferrin recycling by mutant LRRK2.
Following clathrin-mediated endocytosis, TfR can undergo (a) rapid recycling close to the membrane; (b) slower recycling via the ERC; or (c) targeting to lysosomes. Rab8a mediates recycling of TfR via the ERC, and hyperphosphorylation of Rab8a by mutant LRRK2 induces sequestration to damaged lysosomes and dysregulation of Rab8a-mediated trafficking. ERC, endocytic recycling compartment; LRRK2, leucine-rich repeat kinase 2; TfR, transferrin receptor; WT, wild-type.

References

    1. Barrett JC, Hansoul S, Nicolae DL, Cho JH, Duerr RH, Rioux JD, et al.. Genome-wide association defines more than 30 distinct susceptibility loci for Crohn’s disease. Nat Genet. 2008. Aug;40(8):955–62. doi: 10.1038/ng.175 - DOI - PMC - PubMed
    1. Paisán-Ruíz C, Jain S, Evans EW, Gilks WP, Simón J, van der Brug M, et al.. Cloning of the gene containing mutations that cause PARK8-linked Parkinson’s disease. Neuron. 2004. Nov 18;44(4):595–600. doi: 10.1016/j.neuron.2004.10.023 - DOI - PubMed
    1. Zimprich A, Biskup S, Leitner P, Lichtner P, Farrer M, Lincoln S, et al.. Mutations in LRRK2 Cause Autosomal-Dominant Parkinsonism with Pleomorphic Pathology. Neuron. 2004. Nov 18;44(4):601–7. doi: 10.1016/j.neuron.2004.11.005 - DOI - PubMed
    1. Kluss JH, Mamais A, Cookson MR. LRRK2 links genetic and sporadic Parkinson’s disease. Biochem Soc Trans. 2019. Apr 30;47(2):651–61. doi: 10.1042/BST20180462 - DOI - PMC - PubMed
    1. Cook DA, Kannarkat GT, Cintron AF, Butkovich LM, Fraser KB, Chang J, et al.. LRRK2 levels in immune cells are increased in Parkinson’s disease. NPJ Parkinsons Dis. 2017. Mar 28;3(1):1–12. doi: 10.1038/s41531-017-0010-8 - DOI - PMC - PubMed

Publication types

MeSH terms