. 2021 Dec 16;16(12):e0260120.
doi: 10.1371/journal.pone.0260120. eCollection 2021.

Automation improves repeatability of retinal oximetry measurements

Affiliations

Automation improves repeatability of retinal oximetry measurements

Robert Arnar Karlsson et al. PLoS One. .

Abstract

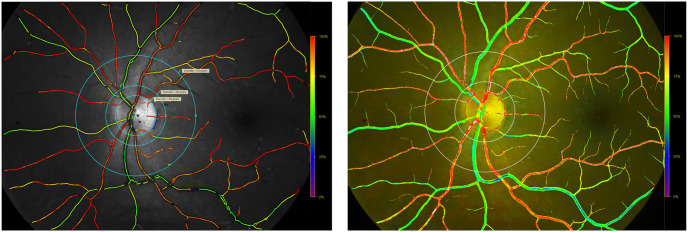
Purpose: Retinal oximetry is a technique based on spectrophotometry where images are analyzed with software capable of calculating vessel oxygen saturation and vessel diameter. In this study, the effect of automation of measurements of retinal vessel oxygen saturation and vessel diameter is explored.

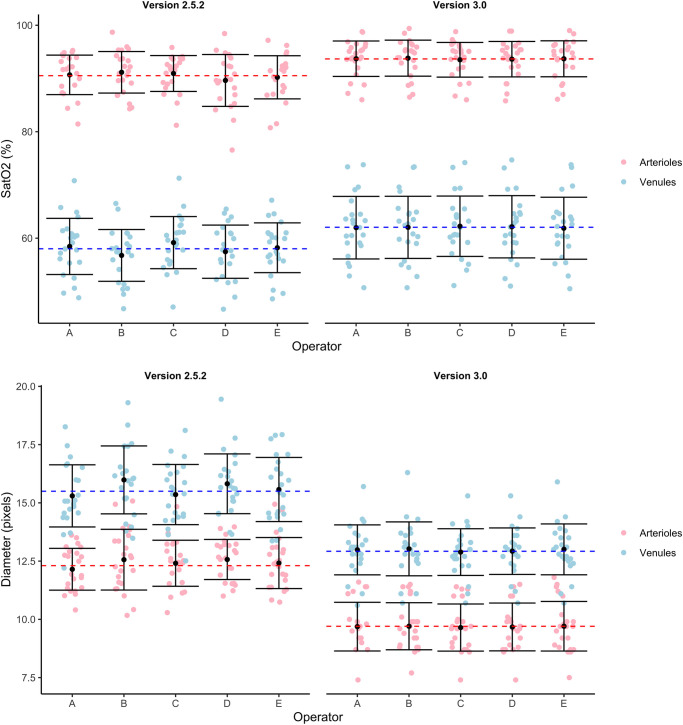
Methods: Until now, operators have had to choose each vessel segment to be measured explicitly. A new, automatic version of the software automatically selects the vessels once the operator defines a measurement area. Five operators analyzed image pairs from the right eye of 23 healthy subjects with semiautomated retinal oximetry analysis software, Oxymap Analyzer (v2.5.1), and an automated version (v3.0). Inter- and intra-operator variability was investigated using the intraclass correlation coefficient (ICC) between oxygen saturation measurements of vessel segments in the same area of the retina.

Results: For semiautomated saturation measurements, the inter-rater ICC was 0.80 for arterioles and venules. For automated saturation measurements, the inter-rater ICC was 0.97 for arterioles and 0.96 for venules. For semiautomated diameter measurements, the inter-rater ICC was 0.71 for arterioles and venules. For automated diameter measurements the inter-rater ICC was 0.97 for arterioles and 0.95 for venules. The inter-rater ICCs were different (p < 0.01) between the semiautomated and automated version in all instances.

Conclusion: Automated measurements of retinal oximetry values are more repeatable compared to measurements where vessels are selected manually.


Conflict of interest statement

Robert Arnar Karlsson, Sveinn Hakon Hardarson and Einar Stefánsson have commercial interest in the company Oxymap ehf. They have stock in the company, are on its board and are listed on two patents related to retinal oximetry (Automatic registration of images US 7774036 B2, Temporal oximeter WO 2010143208 A3). This does not alter our adherence to PLOS ONE policies on sharing data and materials.

Figures

Fig 1
Fig 1. Screenshots of the same image analyzed with version 2.5 (left) and version 3.0 (right).
Pseudocolor maps are generated automatically. Colors indicate the retinal vessel oxygen saturation. In healthy individuals arterioles are normally colored orange to red (approximately 90%—100% saturation). Venules are colored green to yellow-green (approximately 50%—60% saturation). Color scale is shown to the right of each image. Both software versions detect the retinal vessels automatically and select measurement points inside and outside of the vessels for automatic calculation of the retinal vessel oxygen saturation.
Fig 2
Fig 2. Measured vessel saturation (top) and diameter (bottom) values from the first image for the two versions and all operators.
Light red and blue points show the mean value from one image, dashed red and blue lines show the global mean values for arterioles and venules, respectively. Black dots show the mean, and error bars show the standard deviation around the mean for each operator and vessel type.
Fig 3
Fig 3. Analysis of repeatability of retinal vessel oximetry (top) and diameter (bottom).
The same area in two images acquired within a short time interval is measured using the two software versions for arterioles and venules. The vertical axis shows the difference between two saturation and diameter measurements in the same area (first image minus second image), and the horizontal axis shows their mean. The solid line in the middle shows the mean difference, and the other two broken lines show Limits of Agreement (LoA) or the two standard deviations of the difference. Results are colored red for arterioles and blue for venules. Grey shaded areas show the 95% confidence interval around the bias and LoA.

References

    1. Wilkinson CP, Ferris FL, Klein RE, Lee PP, Agardh CD, Davis M, et al.. Proposed international clinical diabetic retinopathy and diabetic macular edema disease severity scales. Ophthalmology. 2003;110(9):1677–1682. doi: 10.1016/S0161-6420(03)00475-5 - DOI - PubMed
    1. Chan KKW, Tang F, Tham CCY, Young AL, Cheung CY. Retinal vasculature in glaucoma: A review. BMJ Open Ophthalmology. 2017;1(1):1–14. doi: 10.1136/bmjophth-2016-000032 - DOI - PMC - PubMed
    1. Brown JM, Campbell JP, Beers A, Chang K, Ostmo S, Chan RVP, et al.. Automated diagnosis of plus disease in retinopathy of prematurity using deep convolutional neural networks. JAMA Ophthalmology. 2018;136(7):803–810. doi: 10.1001/jamaophthalmol.2018.1934 - DOI - PMC - PubMed
    1. Hayreh SS, Zimmerman MB. Fundus changes in central retinal vein occlusion. Retina. 2015;35(1):29–42. doi: 10.1097/IAE.0000000000000256 - DOI - PMC - PubMed
    1. Pournaras CJ, Rungger-Brandle E, Riva CE, Hardarson SH, Stefansson E. Regulation of retinal blood flow in health and disease. Prog Retin Eye Res. 2008;27(3):284–330. doi: 10.1016/j.preteyeres.2008.02.002 - DOI - PubMed

Publication types