. 2022 Feb 7;219(2):e20211381.
doi: 10.1084/jem.20211381. Epub 2021 Dec 16.

TIM3+ TRBV11-2 T cells and IFNγ signature in patrolling monocytes and CD16+ NK cells delineate MIS-C

Collaborators, Affiliations

TIM3+ TRBV11-2 T cells and IFNγ signature in patrolling monocytes and CD16+ NK cells delineate MIS-C

Levi Hoste et al. J Exp Med. .

Abstract

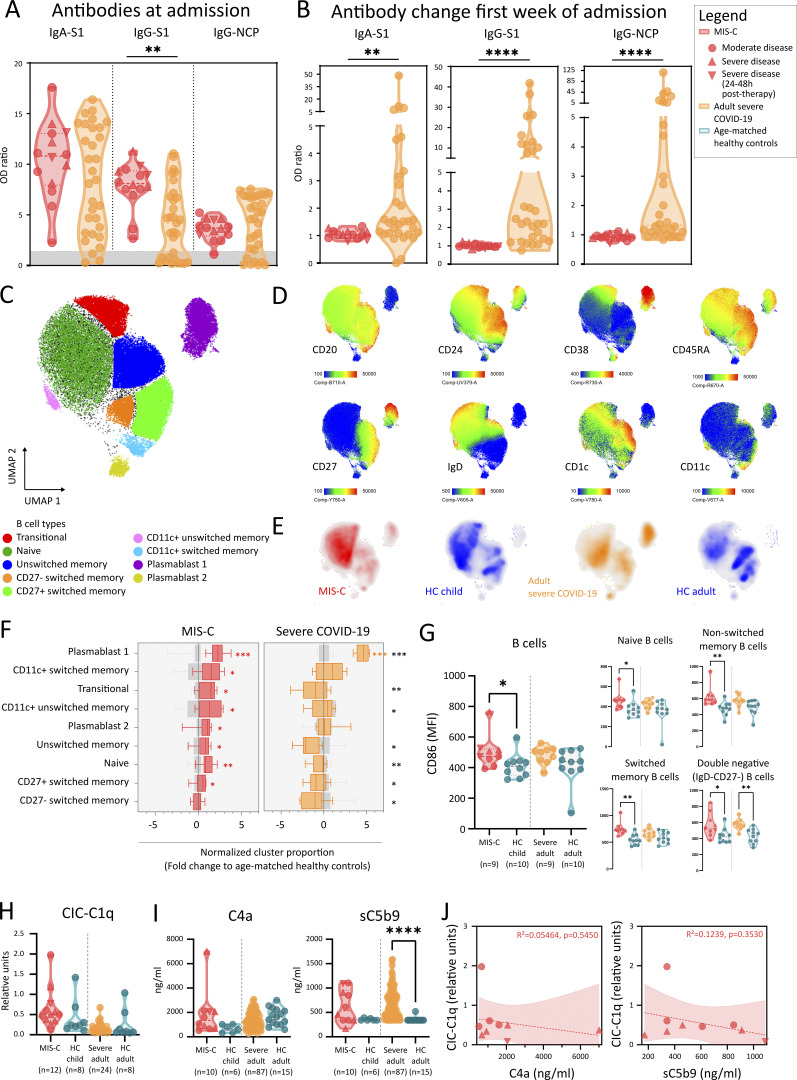
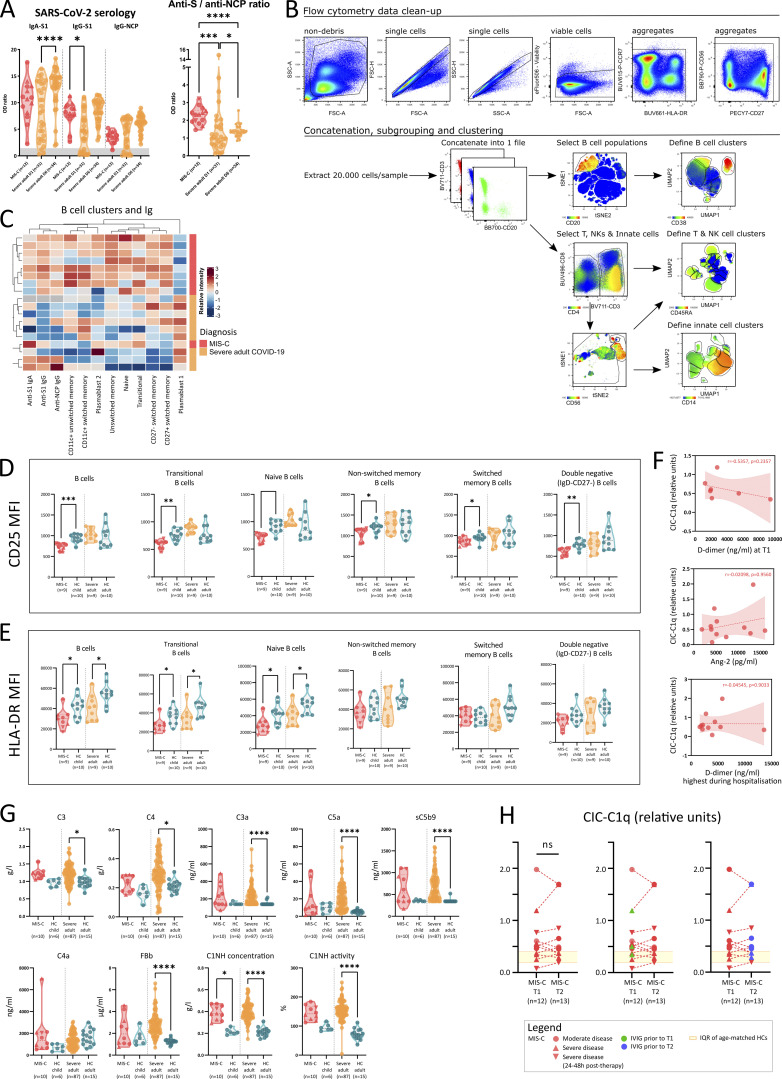
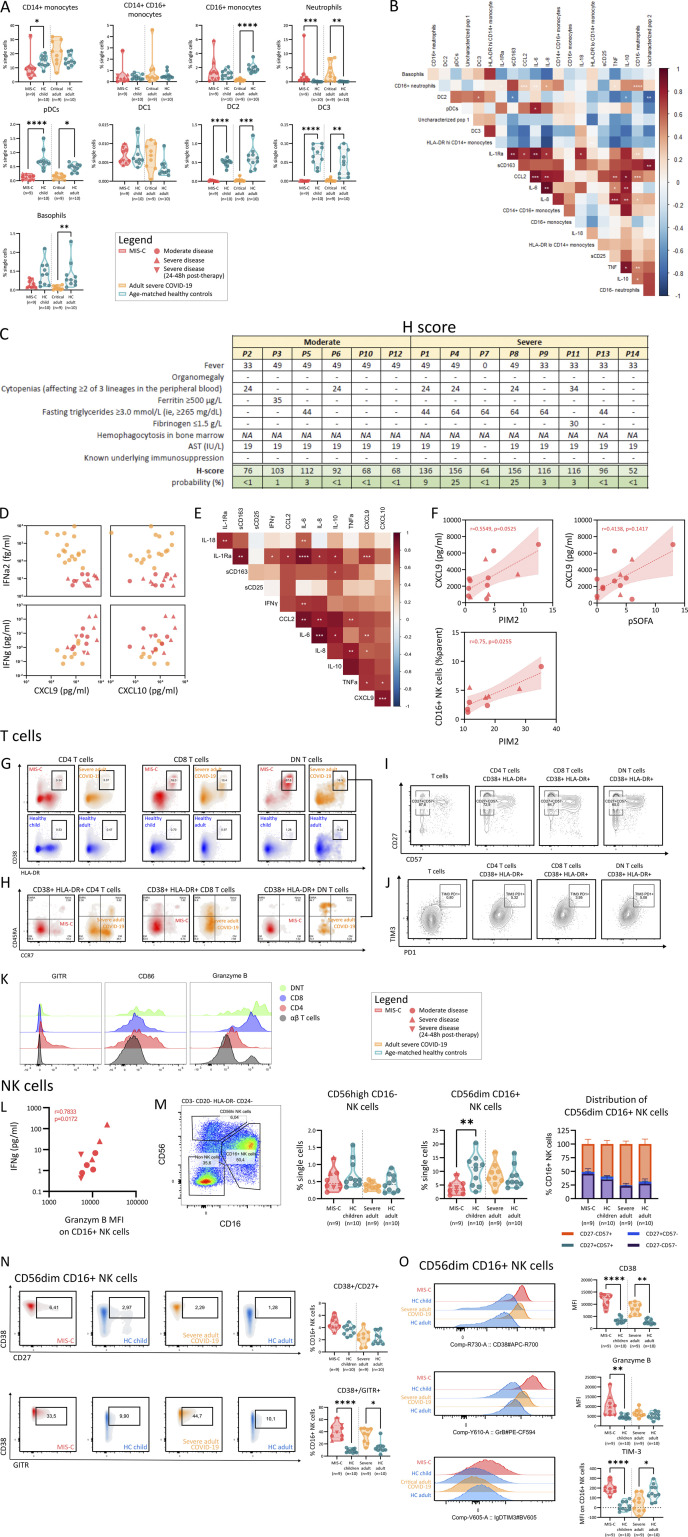
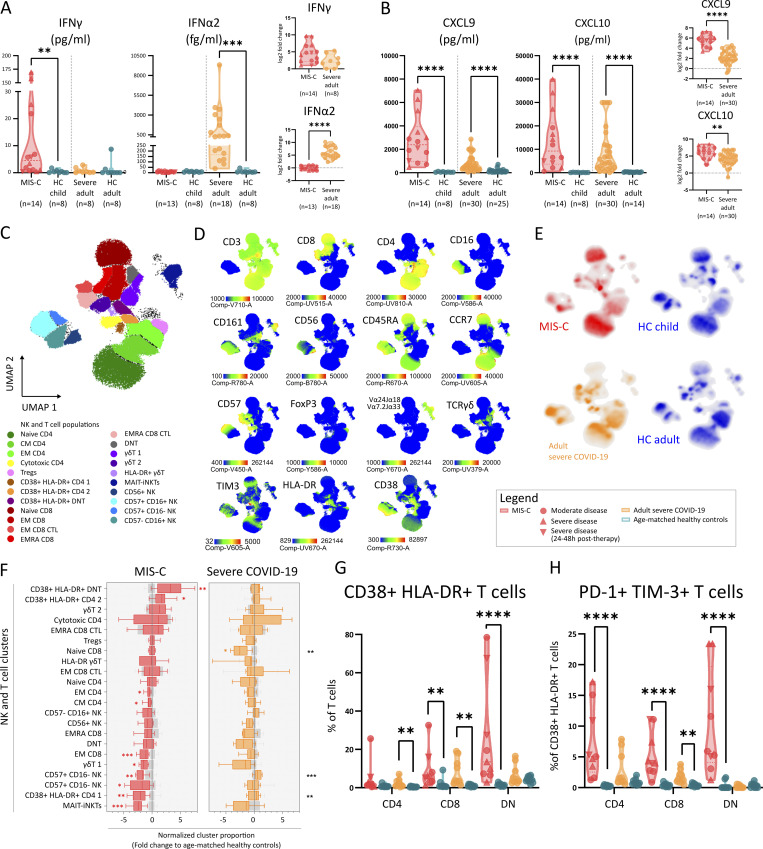
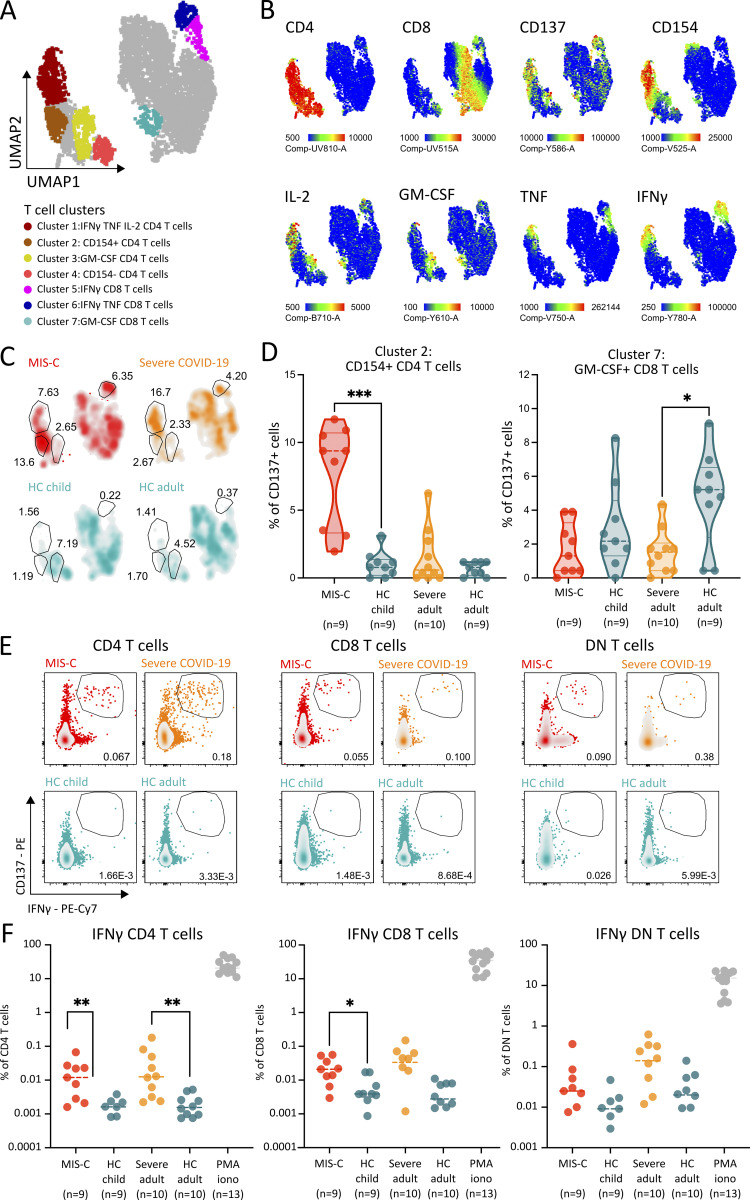
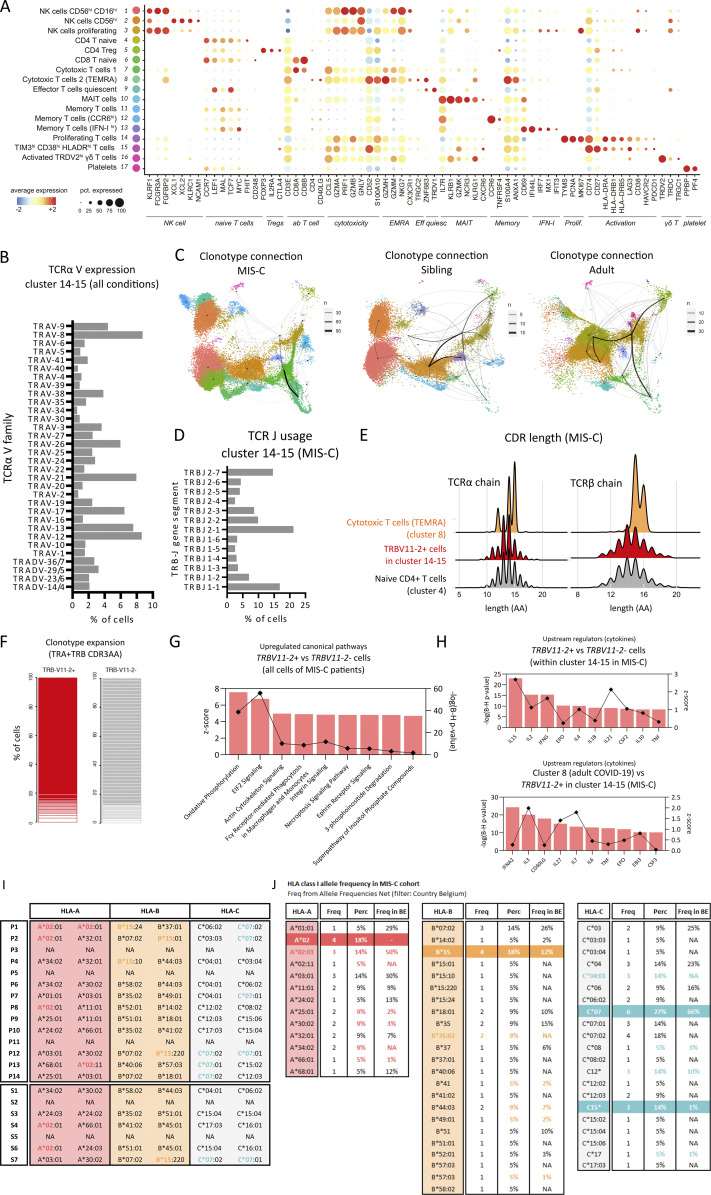
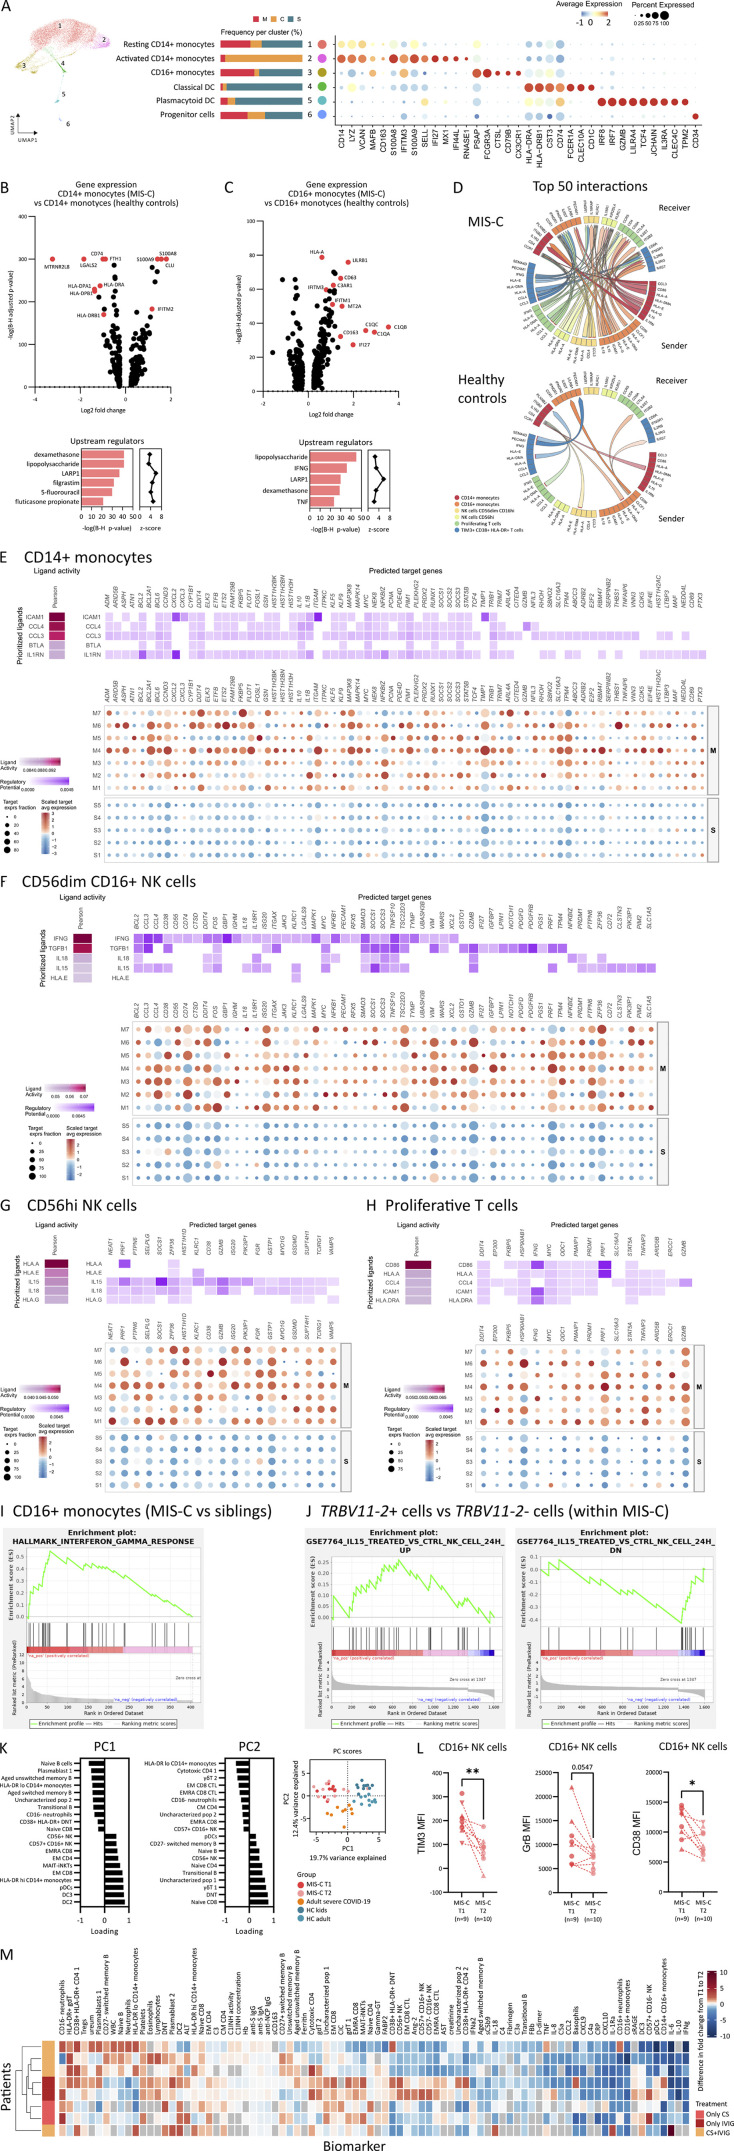
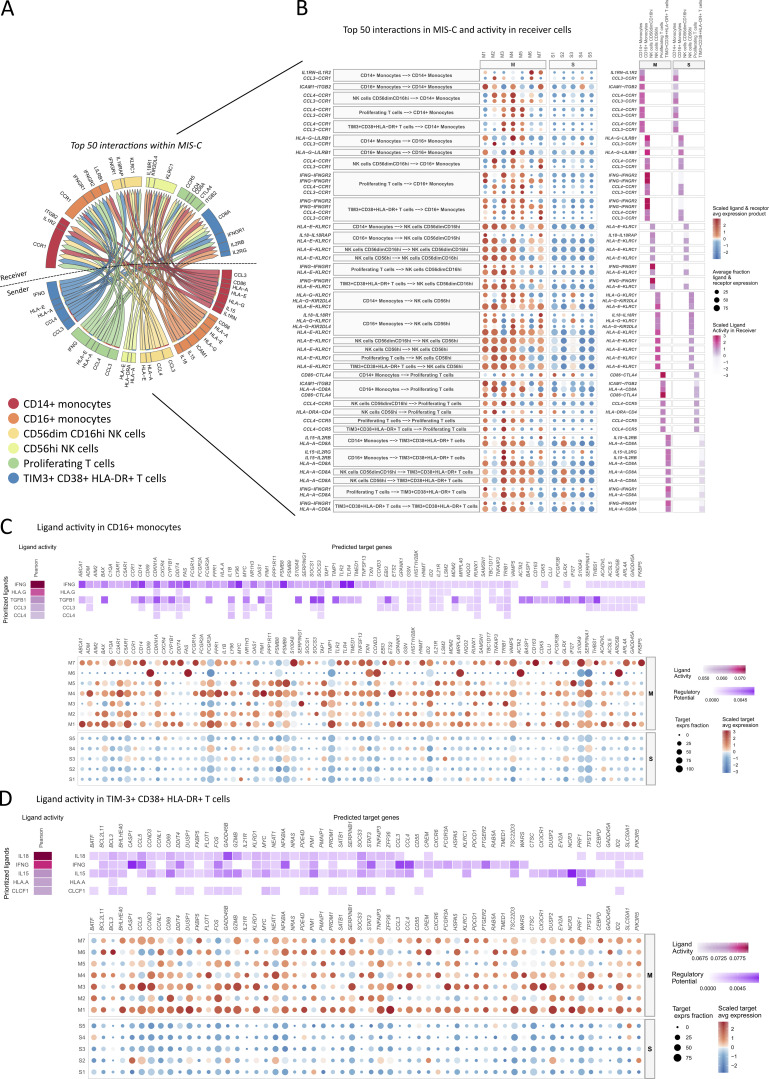
In rare instances, pediatric SARS-CoV-2 infection results in a novel immunodysregulation syndrome termed multisystem inflammatory syndrome in children (MIS-C). We compared MIS-C immunopathology with severe COVID-19 in adults. MIS-C does not result in pneumocyte damage but is associated with vascular endotheliitis and gastrointestinal epithelial injury. In MIS-C, the cytokine release syndrome is characterized by IFNγ and not type I interferon. Persistence of patrolling monocytes differentiates MIS-C from severe COVID-19, which is dominated by HLA-DRlo classical monocytes. IFNγ levels correlate with granzyme B production in CD16+ NK cells and TIM3 expression on CD38+/HLA-DR+ T cells. Single-cell TCR profiling reveals a skewed TCRβ repertoire enriched for TRBV11-2 and a superantigenic signature in TIM3+/CD38+/HLA-DR+ T cells. Using NicheNet, we confirm IFNγ as a central cytokine in the communication between TIM3+/CD38+/HLA-DR+ T cells, CD16+ NK cells, and patrolling monocytes. Normalization of IFNγ, loss of TIM3, quiescence of CD16+ NK cells, and contraction of patrolling monocytes upon clinical resolution highlight their potential role in MIS-C immunopathogenesis.


Conflict of interest statement

Disclosures: No disclosures were reported.

Figures

None
Graphical abstract
Figure S1.
Figure S1.
Clinical data from patients with MIS-C and adults with severe COVID-19. (A) Timeline of symptoms, medical interventions, and time points of sampling for each of the 14 MIS-C patients included in the study. Treatment and dosages are denoted according to the legend. If tapering of corticosteroids was performed, partial circles are displayed according to the relative dose reductions that were applied. (B) Principal component (PC) analysis of routine laboratory data (top). Routine variables with missing data for individual patients (e.g., troponin, N-terminal pro-brain natriuretic peptide) were excluded from the analysis. Included variables are denoted in the vectors in the loadings plot (bottom). (C) Violin plots showing endotoxin levels in the plasma of MIS-C patients as compared with HCs. Dotted lines show median and quartiles. (D) Correlation plot of clinical variables of adult patients with severe COVID-19 and their routine laboratory parameters and biomarkers of endothelial and epithelial injury. Significance determined by Spearman’s rank correlation coefficients, indicated by *, P < 0.05; **, P < 0.01; and ***, P < 0.001. BMI, body mass index; PICU, pediatric intensive care unit; NIV, noninvasive ventilation; EU, endotoxin units; neutro, neutrophil; lympho, lymphocyte; eosino, eosinophil.
Figure 1.
Figure 1.
Signature of vascular damage and gastrointestinal barrier disruption but no signs of lung involvement in MIS-C. (A–D) Violin plots depicting serum concentrations of Ang-2, sRAGE, and FABP2 revealing distinct patterns for patients with MIS-C (red), severe adult COVID-19 (orange), and age-matched HCs (blue), which is confirmed in D after normalizing for age (Log2 fold change of individual values versus the median of age-matched HCs). Dashed lines show median and quartiles. Significance determined by Mann–Whitney U tests (and Dunn’s test for multiple testing), indicated by *, P < 0.05; **, P < 0.01; ***, P < 0.001; and ****, P < 0.0001. (E) Correlation plot of clinical variables, routine laboratory parameters, and biomarkers of endothelial and epithelial injury, measured in patients with MIS-C at first sampling time point. Significance determined by Spearman’s rank correlation coefficients, indicated by *, P < 0.05; **, P < 0.01; and ***, P < 0.001. (F) Dot plots displaying concentrations of Ang-2, FABP2, and ferritin in relation to each other in both patients with MIS-C and severe COVID-19. Dashed lines represent simple linear regression with 95% CIs. R2 displays goodness-of-fit, and statistical analysis to test if slope differs from 0 (P < 0.05) is shown. Distinct symbols depict patients with severe MIS-C with (inverted triangle) or without treatment (triangle) and moderate disease (circle). BMI, body mass index; FS%, fractional shortening; ICU, intensive care unit.
Figure 2.
Figure 2.
Widespread B cell activation and convalescent antibody repertoire but absence of immune complex mediated complement activation. (A) Violin plots of anti–SARS-CoV-2–specific serological assays, quantified as relative OD versus the calibrator for anti-spike 1 (S1) IgA and IgG, and anti-nucleocapsid (NCP) IgG for MIS-C (red) and adults with severe COVID-19 (orange). Area in gray depicts insufficient serological response. Dashed lines show median and quartiles. (B) Fold increase of serology during hospitalization, calculated as ratio of OD values of second and first time point of sampling of patients with MIS-C and severe COVID-19. Significance determined by Mann–Whitney U tests (and Dunn’s test for multiple testing), indicated by *, P < 0.05; **, P < 0.01; ***, P < 0.001; and ****, P < 0.0001. (C) UMAP representation of B lymphocytes (within PBMCs) of 9 MIS-C patients, 9 adults with severe COVID-19, and 20 age-matched HCs. (D) Signature marker expression characterizing B lymphocyte clusters. Legend depicting fluorescence intensity. (E) Density plot of UMAP panels stratified by condition or HC group. (F) Boxplots representing median and ranges of normalized B lymphocyte cluster proportions versus the median of corresponding HCs (Log2 fold change). Significance determined by multiple Mann–Whitney U tests and corrected for multiple testing (FDR of 5%) both within disease and age-matched HCs (in red and orange for MIS-C and severe COVID-19, respectively) or between MIS-C and severe COVID-19 (in black, right), indicated as *, q < 0.05; **, q < 0.01; ***, q < 0.001; and ****, q < 0.0001. (G) MFI of CD86 on B lymphocytes (CD3CD20+; left) and specific B cell subsets (right): naive (IgD+CD27), unswitched memory (IgD+CD27+), switched memory (IgDCD27+), and DN (IgDCD27) B cells. (H and I) Violin plots representing values of CICs bound by C1q (H) and (I) concentrations of cleaved complement factor 4 (C4a) and soluble membrane attack complex (sC5b9) in plasma. Dashed lines show median and quartiles. Significance determined by Mann–Whitney U tests (and Dunn’s test for multiple testing), indicated by ****, P < 0.0001. (J) Dot plots displaying concentrations of C4a and sC5b9 in relation to CIC-C1q in patients with MIS-C. Dashed lines represent simple linear regression with 95% CIs. R2 displays goodness-of-fit, and statistical analysis to test if slope differs from 0 (P < 0.05) is shown. Values for individual patients are displayed with MIS-C (red), severe adult COVID-19 (orange), and age-matched HCs (blue). Distinct symbols depict patients with severe MIS-C with (inverted triangle) or without treatment (triangle) and moderate disease (circle).
Figure S2.
Figure S2.
Humoral response, complement pathway activation and CICs in MIS-C and severe COVID-19. (A) Violin plots of anti–SARS-CoV-2–specific serological assays, quantified as relative OD versus the calibrator for anti-spike 1 (S1) IgA and IgG, and anti-nucleocapsid (NCP) IgG for MIS-C at inclusion (red) and adults with severe COVID-19 measured on day 1 and day 6 (orange). The zone below the calibrator is denoted in gray. Dotted lines depict median and quartiles. (B) Gating strategy and cluster analysis of FCM data obtained from PBMCs of 9 MIS-C patients, 9 adults with severe COVID-19, and 20 age-matched HCs for further analysis by UMAP. (C) Heatmap of normalized B cell clusters identified by UMAP and anti–SARS-CoV-2 serology of individual MIS-C and severe COVID-19 patients. Rows and columns are ordered by hierarchical clustering methods. (D and E) Violin plots representing MFI of CD25 (D) and (E) HLA-DR as activation markers on multiple stages of B cell development. Dotted lines depict median and quartiles. (F) Dot plots displaying absence of correlation between CICs as measured by C1q quantification at T1, and D-dimer (on T1 or highest during admission) or Ang-2 levels (measured on T1). Dashed line represents simple linear regression with r and P value of Spearman testing. (G) Violin plots of plasma complement factors associated with classical (C4a), alternative (FBb), and terminal complement pathway activation (C3a, C5a, and sC5b9). Dotted lines depict median and quartiles. (H) Paired dot plot graph displaying the evolution of CIC from T1 to T2 for patients with MIS-C (left), having received IVIG therapy before T1 (in green, middle) or between T1 and T2 (blue, right). Significances are determined by Mann–Whitney U tests, corrected for multiple testing by Dunn’s test, between MIS-C or severe COVID-19 with their respective age-matched HCs, indicated by *, P < 0.05; **, P < 0.01; ***, P < 0.001; and ****, P < 0.0001. Values for individual patients are displayed with MIS-C (red), severe adult COVID-19 (orange), and age-matched HCs (blue). Distinct symbols depict patients with severe MIS-C with (inverted triangle) or without treatment (triangle) and moderate disease (circle).
Figure 3.
Figure 3.
CRS with marked increase of TNFα, IL-10, sCD25, and sCD163 and profound changes of innate leukocytes. (A–D) Violin plots depicting serum concentrations of IL-1RA, IL-18, IL-6, IL-8, IL-10, TNF, sCD25, and sCD163 comparing MIS-C (red), severe COVID-19 (orange), and respective HCs (blue). (B and D) Normalized values for age (Log2 fold change of individual values versus the median of age-matched HCs). Dashed lines show median and quartiles. Significance determined by Mann–Whitney U tests (and Dunn’s test for multiple testing), indicated by *, P < 0.05; **, P < 0.01; ***, P < 0.001; and ****, P < 0.0001. (E) UMAP representation of innate leukocytes (within PBMCs) of 9 MIS-C patients, 9 adults with severe COVID-19, and 20 age-matched HCs. (F) Signature marker expression characterizing innate leukocyte clusters. Legend depicting fluorescence intensity. (G) Density plot of UMAP panels stratified by condition or HC group. (H) Boxplots representing median and ranges of normalized B lymphocyte cluster proportions versus the median of corresponding HCs (Log2 fold change). Significance determined by multiple Mann–Whitney U tests and corrected for multiple testing (FDR of 5%) both within disease and age-matched HCs (in red and orange for MIS-C and severe COVID-19, respectively) or between MIS-C and severe COVID-19 (in black, right), indicated as *, q < 0.05; **, q < 0.01; ***, q < 0.001; and ****, q < 0.0001. (I) Violin plots depicting percentage of CD16+ monocytes among viable PBMCs. Dashed lines show median and quartiles. Significance determined by Mann–Whitney U tests (and Dunn’s test for multiple testing), indicated by ****, P < 0.0001. Values for individual patients are displayed with MIS-C (red), severe adult COVID-19 (orange), and age-matched HCs (blue). Distinct symbols depict patients with severe MIS-C with (inverted triangle) or without treatment (triangle) and moderate disease (circle).
Figure S3.
Figure S3.
H-score, type II IFN signature, innate leukocyte subsets, and T and NK cell activation in MIS-C. (A) Violin plots of monocytes, neutrophils, DCs, and basophils. Dotted lines show median and quartiles. Significances are determined by Mann–Whitney U tests, corrected for multiple testing by Dunn’s test, indicated by *, P < 0.05; **, P < 0.01; ***, P < 0.001; and ****, P < 0.0001. (B) Correlation plot of innate leukocytes subsets as identified by UMAP analysis and serum cytokines, measured in the MIS-C patients. Significance determined by Spearman’s rank correlation coefficients, indicated by *, P < 0.05; **, P < 0.01; and ***, P < 0.001. (C) H-score (as described previously; Fardet et al., 2014), calculated for the MIS-C patients, including the corresponding probability of having hemophagocytic syndrome. (D) Correlation plot of IFNα2 and IFNγ with their downstream chemokines CXCL9 and CXCL10. (E) Correlation matrix of IFNγ, CXCL9, CXCL10, and innate cytokines, measured in the MIS-C patients. Significance determined by Spearman’s rank correlation coefficients, indicated by *, P < 0.05; **, P < 0.01; and ***, P < 0.001. (F) Correlation plots of clinical severity scores and CXCL9 or CD16+ NK cells. Dashed line represents simple linear regression with r and P value of Spearman testing. (G) Density plots of HLA-DR and CD38 among CD4+, CD8+, and DN T cell populations. One representative plot for each group (MIS-C, severe COVID-19, or matched HCs) is displayed. Percentage of positive cells (from parent) is denoted. (H) Density plots of CCR7 and CD45RA on CD38+/HLA-DR+ T cells. One representative plot for each patient group (MIS-C and severe COVID-19) is displayed. Percentage of parent is denoted per quadrant. (I and J) Contour plots showing expression of CD57 and CD27 (I) or (J) PD-1 and TIM3 among all T cells and on CD38+/HLA-DR+ T cell populations (CD4+, CD8+, DN). One graph representative for MIS-C is displayed. (K) Histograms showing GITR, CD86 and granzyme B (GrB) fluorescence intensities of CD4, CD8, DN, and all αβ T cells of MIS-C patients. One representative plot is displayed. (L) Correlation plots of GrB MFI on CD16+ NK cells and serum IFNγ measured in MIS-C patients. r and P value of two-sided Spearman’s rank testing are shown. (M) Violin plots showing percentage of CD56+ and CD16+ NK cell populations in MIS-C, severe COVID-19, and age-matched HCs. Dotted lines show median and quartiles. Significances are determined by Mann–Whitney U tests, corrected for multiple testing by Dunn’s test, indicated by **, P < 0.01. (N) Density plots showing CD38 and CD27 or CD38 and CD27 fluorescence in CD16+ NK cells in MIS-C, severe COVID-19, and age-matched HCs. One representative plot for each group is displayed. Percentage of positive cells (from parent) is denoted. Violin plots showing percentage of CD38+/CD27+ or CD38+/GITR+ populations among CD16+ NK cells. Dotted lines show median and quartiles. Significances are determined by Mann–Whitney U tests, corrected for multiple testing by Dunn’s test, indicated by *, P < 0.05; and ****, P < 0.0001. (O) Histograms showing CD38, GrB, or TIM3 fluorescence in MIS-C, severe COVID-19, and age-matched HCs. One representative plot for each group is displayed. Violin plots showing MFI of CD38, GrB, and TIM3 in CD16+ NK cells of each group. Dotted lines show median and quartiles. Significances for violin plots are determined by Mann–Whitney U tests, corrected for multiple testing by Dunn’s test, between MIS-C or severe COVID-19 with age-matched HCs, indicated by *, P < 0.05; **, P < 0.01; ***, P < 0.001; and ****, P < 0.0001. Values for individual patients are displayed with MIS-C (red), severe COVID-19 (orange), and age-matched HCs (blue). Distinct symbols depict patients with severe MIS-C with (inverted triangle) or without treatment (triangle) and moderate disease (circle).
Figure 4.
Figure 4.
Type II IFN signature in absence of type I IFN and TIM3+ PD1+ activated T cells characterize MIS-C. (A and B) Violin plots depicting serum concentrations of IFNγ and IFNα2, C-X-C motif ligand 9 (CXCL9), and CXCL10 in MIS-C, adults with severe COVID-19, and their respective HCs. Normalized values for age (Log2 fold change of individual values versus the median of age-matched HCs). Dashed lines show median and quartiles. Significance determined by Mann–Whitney U tests (and Dunn’s test for multiple testing), indicated by *, P < 0.05; **, P < 0.01; ***, P < 0.001; and ****, P < 0.0001. (C) UMAP representation of T lymphocytes, NK cells, and iNKT/MAIT cells (within PBMCs) of 9 MIS-C patients, 9 adults with severe COVID-19, and 20 age-matched HCs. (D) Signature marker expression characterizing T lymphocytes and NK cell clusters. Legend depicting fluorescence intensity. (E) Density plot of UMAP panels stratified by condition or HC group. (F) Boxplots representing median and ranges of normalized T/NK lymphocyte cluster proportions versus the median of HCs (Log2 fold change). Significance determined by multiple Mann–Whitney U tests and corrected for multiple testing (FDR of 5%) both within disease and age-matched HCs (in red and orange for MIS-C and severe COVID-19, respectively) or between MIS-C and severe COVID-19 (in black, right), indicated as *, q < 0.05; **, q < 0.01; ***, q < 0.001; and ****, q < 0.0001. (G) Violin plots showing percentage of CD38+/HLA-DR+ double positive CD4+, CD8+, or DN cells (percentage of T cells). (H) Violin plots showing the percentage of PD-1+/TIM3+ double positive CD4+, CD8+, or DN cells (percentage of CD38++/HLA-DR+ T cells). Dashed lines show median and quartiles. Significance determined by Mann–Whitney U tests (and Dunn’s test for multiple testing), indicated by *, P < 0.05; **, P < 0.01; ***, P < 0.001; and ****, P < 0.0001. Values for individual patients are displayed with MIS-C (red), severe adult COVID-19 (orange), and age-matched HCs (blue). Distinct symbols depict patients with severe MIS-C with (inverted triangle) or without treatment (triangle) and moderate disease (circle).
Figure 5.
Figure 5.
SARS-CoV-2 peptide pool restimulation reveals distinct clusters of antigen specific T cells in MIS-C. (A) UMAP analysis of CD137+ T cells of 9 MIS-C patients, 9 adults with severe COVID-19, and 19 age-matched HCs after overnight restimulation with peptide pools. (B) Signature marker expression characterizing antigen responsive T lymphocytes (CD137+). Legend depicting fluorescence intensity. (C) Density plot of UMAP panels stratified by condition or HC group (percentage of cells are denoted for clusters of interest). (D) Violin plots depicting proportions of activated, cytokine negative T cells (cluster 2) and GM-CSF expressing CD4 cells (cluster 7) in patients with MIS-C, adults with severe COVID-19, and their respective HCs. Dashed lines show median and quartiles. Significance determined by Mann–Whitney U tests (and Dunn’s test for multiple testing), indicated by *, P < 0.05; and ***, P < 0.001. (E) Representative FCM panels for both conditions and HCs, showing CD137+/IFNγ+ double positive T cells after peptide pool restimulation of PBMCs (percentage of cells within the gate is shown). (F) Dot plots showing percentage of CD137+/IFNγ+ double positive T cells after peptide pool restimulation. PBMCs stimulated with PMA and ionomycin (iono) as control are shown. Dotted line depicts median. Significance determined by Mann–Whitney U tests (and Dunn’s test for multiple testing), indicated by *, P < 0.05; **, P < 0.01; and ***, P < 0.001. Values for individual patients are displayed with MIS-C (red), severe adult COVID-19 (orange), and age-matched HCs (blue).
Figure 6.
Figure 6.
MIS-C is characterized by an activated and proliferative TRBV11-2 expressing T cell population with a skewed TCR repertoire. (A) UMAP plot depicting cluster annotation and numbering on a Seurat object of cells enriched for CD3E transcripts of MIS-C patients (n = 7), adults with severe COVID-19 (n = 4), and HCs (n = 5). The relative proportion of patient or control samples (M = MIS-C, S = healthy sibling, A = adult COVID-19) that contributes to each cluster is visualized in the bar graphs. (B) UMAP plot visualizing expression of signature genes CD38, HLA-DRA, PDCD1, HAVCR2, CCR6 and KI-67. (C) TRB-V expansion plot, highlighting TRB-V counts from all patient conditions on the UMAP shown in A. (D) Bar graphs showing TRBV11 usage within clusters 14 and 15 grouped per condition (M = MIS-C, S = healthy sibling, A = adult COVID-19) and presented as a percentage of all T/NK cells of each group. (E) Doughnut plots showing TRBV11-2 allele usage within clusters 14 and 15 of MIS-C patients. (F) Stacked bar plot presenting the relative frequency of individual patients or HCs that contribute to clusters 14 and 15. (G) Bar plots depicting TRBV11-2 usage for each patient or control within clusters 14 and 15. (H) Circos plots depicting TRA-V–TRB-V pairing within clusters 14 and 15 of MIS-C patients. (I) Stacked bar graphs showing clonotype frequencies within cluster 8 (TEMRA), 14 (proliferating T cells), and 15 (TIM3+ HLAD-DR+ CD38+ T cells) from all patient conditions. Clonotype frequencies of naive T cells (cluster 4) are shown as a reference of unexpanded clones. Clonotypes were defined as the combination of TRA + TRB CDR3AA. (J) Violin plots showing expression of DEGs in TRBV11-2+ versus TRBV11-2 cells of MIS-C patients. (K) Volcano plots showing differentially expressed (DE) genes of TRBV11-2+ positive cells versus TRBV11-2 cells within clusters 14 and 15 and only for MIS-C patients. Genes were selected on a Log2 fold change of ±0.25 and a Benjamini–Hochberg adj P value of 0.05. (L) Analogous volcano plot as in K for DE genes between cells in cluster 8 of adult COVID-19 patients compared with TRBV11-2+ cells in clusters 14 and 15 of MIS-C patients. Treg, regulatory T cell.
Figure S4.
Figure S4.
Single-cell TCR profiling reveals an activated and proliferating population with skewed TCR repertoire, suggestive of superantigenic stimulation of TRBV11-2+ cells. (A) Dot plot depicting signature genes defining the UMAP clusters shown in Fig. 5, A and B. (B) TRA-V gene family usage within clusters 14 and 15 among all conditions. (C) Clonotype connection plots linking UMAP clusters with shared clonotypes. Line widths depict number of overlapping clones. UMAPs are split based on patient condition. Clonotypes are defined by TRB + TRA CDR3AA sequences. (D) Barplot depicting TRBJ gene segment usage within clusters 14 and 15 of the MIS-C condition. (E) Ridgeplot depicting CDR3 length (number of amino acids) within TRBV11-2+ cells of clusters 14 and 15 of the MIS-C condition (red) versus cytotoxic T cells (TEMRA) of cluster 8 (orange). The CDR3 length of cluster 4 (naive CD4 T cells) is presented as a reference (gray). (F) Stacked bar graphs showing clonotype expansion within TRBV11-2+ and TRBV11-2 cells of clusters 14 and 15 of the MIS-C condition. Clonotypes are defined by TRB + TRA CDR3AA sequences. (G) Up-regulated canonical pathways as identified by IPA on DEGs of TRBV11-2+ cells as compared with TRBV11-2 cells for MIS-C patients within cluster 14 and 15. Pathways were ordered on their Benjamini–Hochberg-corrected P value (bars) and filtered on pathways with a positive z-score (squares). (H) Upstream regulators with a filter on cytokines as identified by IPA on DEGs of TRBV11-2+ cells as compared with TRBV11-2 cells for MIS-C patients within clusters 14 and 15 (top) and on cells of adult patients with severe COVID-19 within cluster 8 as compared with TRBV11-2+ cells of MIS-C within clusters 14 and 15 (bottom). Cytokines were ordered on their Benjamini–Hochberg-corrected P value (bars) and filtered on cytokines with a positive z-score (squares). (I) HLA clonotypes for MIS-C patients and siblings (J) compared with local reference frequencies. Eff quiesc, quiescent effector; Freq, frequency; NA, nonavailable; pct., percent; Prolif, proliferating; Perc, percent; Tregs, regulatory T cells.
Figure S5.
Figure S5.
scRNA-seq of innate leukocytes, NicheNet analysis, and immune profile of MIS-C patients upon clinical recovery. (A) UMAP plot depicting cluster annotation and numbering on a Seurat object of innate leukocyte cell types. The relative proportion of patient or control samples (M = MIS-C, S = healthy sibling, A = adult COVID-19) that contributes to each cluster is visualized in the bar graphs in the middle panel. Right: Dotplot analysis depicts the signature genes of each the clusters. (B) Volcano plot (top) showing differentially expressed (DE) genes of CD14+ monocytes of MIS-C patients as compared with CD14+ monocytes of HCs. Genes were selected on a Log2 fold change of ±0.25 and a Benjamini–Hochberg adj P value of 0.05. Upstream regulators (bottom) as identified by IPA on DEGs of CD14+ monocytes of MIS-C as compared with HCs. Regulators were sorted on their Benjamini–Hochberg-corrected P value (bars) and filtered on regulators with a positive z-score (squares). (C) Analogous volcano plot (top) and upstream regulators (bottom) as in B for DE genes between CD16+ monocytes of MIS-C as compared with CD16+ monocytes of HCs. (D) Circos plot of the top 50 interactions between clusters of T cells, NK cells, and monocytes identified by NicheNet, connecting sending and receiving cell types of interest by their differential ligand–receptor communication, split for MIS-C and HCs. (E–H) Heatmap and dim plots visualizing NicheNet analysis of (E) CD14+ monocytes, (F) CD56dim CD16+ NK cells, (G) CD56+ NK cells, and (H) proliferative T cells as receiving cells, displaying their respective differential ligand activity and downstream regulation of target genes for all analyzed samples (top) and for MIS-C patients (M) and healthy siblings (S) separately. (I and J) GSEA of IFNγ response in the DEGs between CD16+ monocytes of MIS-C compared with siblings (I) and (J) IL15 up- and down-regulation in TRBV11-2+ cells of MIS-C versus TRBV11-2 cells of MIS-C patients. (K) Loadings of the principal component analysis of UMAP clusters of patients and HC groups. (L) Pairwise analysis of the MFIs of TIM3, granzyme B (GrB), and CD38 on CD16+ NK cells of MIS-C patients on T1 and T2. Significances between T2 and T1 were calculated by Wilcoxon matched-pairs signed-rank test, indicated by *, P < 0.05; **, P < 0.01. Patients with severe MIS-C (T1 sampling after treatment initiation, inverted triangle; T1 before treatment initiation, triangle) and moderate disease (circle) are displayed separately. (M) Heatmap displaying absolute differences between normalized biomarkers on the two time points of sampling in MIS-C (T2 minus T1). Gray boxes denote if a variable was not available for an individual patient. Patients were hierarchically clustered on their variables (corticosteroids [CS], IVIG, or a combination of both).
Figure 7.
Figure 7.
NicheNet reveals T cell-monocyte-NK cell communication through IFNγ, IL-15 and IL-18 signaling in MIS-C. (A) Circos plot of the top 50 interactions between clusters of T cells, NK cells, and monocytes in MIS-C identified by NicheNet, connecting sending and receiving cell types of interest by their differential ligand–receptor communication. (B) Visualization of differential interactions found by NicheNet for individual MIS-C patients (M1–M7) and healthy siblings (S1–S5) with a prediction of ligand activity in receiving cells (C and D) Heatmap and dim plots visualizing NicheNet analysis of (C) CD16+ monocytes and (D) TIM3+ CD38+ HLA-DR+ T cells as receiving cells, displaying their respective differential ligand activity and downstream regulation of target genes for all analyzed samples (top) and for MIS-C patients (M) and healthy siblings (S) separately (bottom). avg, average; exprs, expressing.
Figure 8.
Figure 8.
Clinical resolution is associated with recovery of type II IFN signature and contraction of CD16+ monocytes and TIM3+ T cells. (A) Bar chart depicting ratios of routine laboratory values, serum proteins, and UMAP cell populations measured at sampling time points T2 and T1. Ratios were calculated from normalized values (fold changes to the median of HCs). Bars are ordered on the median and represent the top 25 most negative (blue) and top 10 most positive (red) differences, with whiskers denoting the range. Significant differences between T2 and T1 were calculated by Wilcoxon matched-pairs signed-rank test, indicated by *, P < 0.05; **, P < 0.01; ***, P < 0.001; and ****, P < 0.0001. (B) Heatmap separated by condition (T1 and T2) displaying hierarchical clustered normalized biomarkers (cytokines and tissue marker fold change relative to median of HCs) for individual MIS-C patients. CS, corticosteroids. (C) Dot plot showing type I and type II IFN and downstream chemokines (CXCL9 and CXCL10) concentrations from patients collected at sampling time points T2 and T1. (D) Principal component (PC) analysis of all UMAP clusters (B, T/NK, innate cells), identified by flow cytometry. (E) UMAP representation of innate leukocytes (within PBMCs) with density plots stratified per time point of sampling in MIS-C (n = 9 on T1 and n = 10 on T2). Numbers show percentage of clusters of interest. (F) Evolution of the proportions of innate UMAP clusters by pairing samples from identical patients on both time points. (G) UMAP representation of T lymphocytes, NK cells, and iNKT/MAIT cells (within PBMCs) and density plots for both time points of sampling in MIS-C, similar to E. (H and I) Evolution of the proportions of T lymphocytes as determined by manual gating of FCM data, pairing samples from identical patients on both time points. Significances between T2 and T1 were calculated by Wilcoxon matched-pairs signed-rank test, indicated by *, P < 0.05; **, P < 0.01; and ***, P < 0.001. Values for individual patients are displayed with MIS-C (red), severe adult COVID-19 (orange), and age-matched HCs (blue). Distinct symbols depict patients with severe MIS-C with (inverted triangle) or without treatment (triangle) and moderate disease (circle).

References

    1. Abrams, J.Y., Godfred-Cato S.E., Oster M.E., Chow E.J., Koumans E.H., Bryant B., Leung J.W., and Belay E.D.. 2020. Multisystem Inflammatory Syndrome in Children (MIS-C) Associated with SARS-CoV-2: A Systematic Review. J. Pediatr. 10.1016/j.jpeds.2020.08.003 - DOI - PMC - PubMed
    1. Abrams, J.Y., Oster M.E., Godfred-Cato S.E., Bryant B., Datta S.D., Campbell A.P., Leung J.W., Tsang C.A., Pierce T.J., Kennedy J.L., et al. 2021. Factors linked to severe outcomes in multisystem inflammatory syndrome in children (MIS-C) in the USA: a retrospective surveillance study. Lancet Child Adolesc. Health. 5:323–331. 10.1016/S2352-4642(21)00050-X - DOI - PMC - PubMed
    1. Ahmed, M., Advani S., Moreira A., Zoretic S., Martinez J., Chorath K., Acosta S., Naqvi R., Burmeister-Morton F., Burmeister F., et al. 2020. Multisystem inflammatory syndrome in children: A systematic review. EClinicalMedicine. 26:100527. 10.1016/j.eclinm.2020.100527 - DOI - PMC - PubMed
    1. Bastard, P., Rosen L.B., Zhang Q., Michailidis E., Hoffmann H.H., Zhang Y., Dorgham K., Philippot Q., Rosain J., Béziat V., et al. COVID Human Genetic Effort . 2020. Autoantibodies against type I IFNs in patients with life-threatening COVID-19. Science. 370:eabd4585. 10.1126/science.abd4585 - DOI - PMC - PubMed
    1. Beckmann, N.D., Comella P.H., Cheng E., Lepow L., Beckmann A.G., Mouskas K., Simons N.W., Hoffman G.E., Francoeur N.J., Del Valle D.M., et al. 2020. Cytotoxic lymphocytes are dysregulated in multisystem inflammatory syndrome in children. medRxiv. 10.1101/2020.08.29.20182899 (Preprint posted September 2, 2020) - DOI

Publication types

MeSH terms

Supplementary concepts